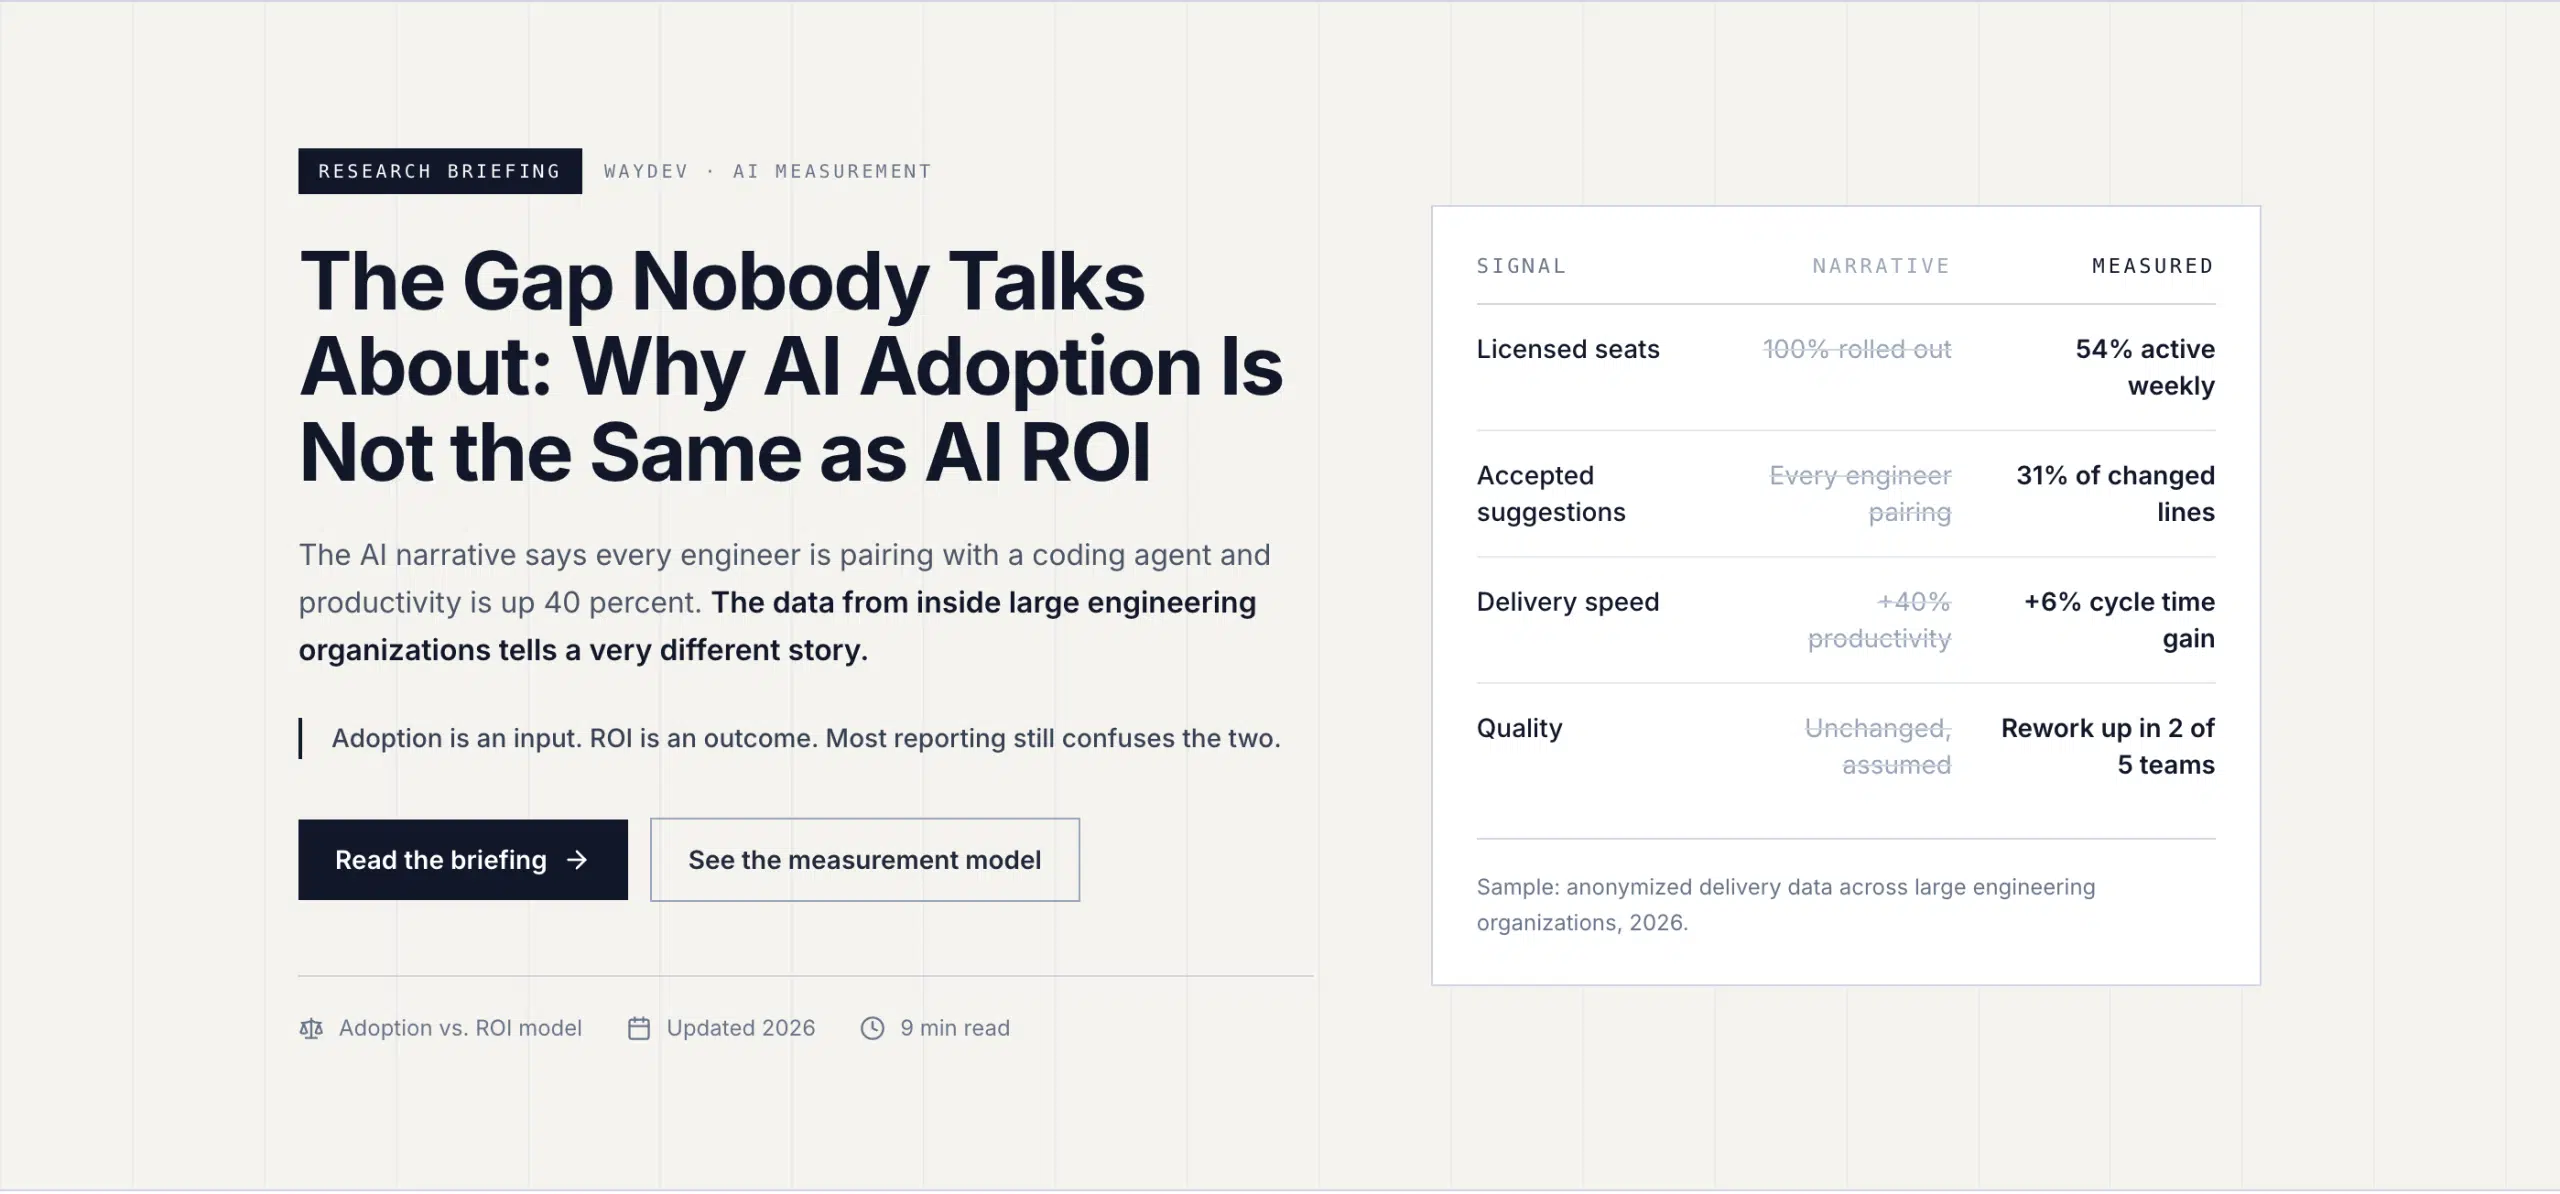
The AI narrative says every engineer is pairing with a coding agent and productivity is up 40 percent. The data from inside large engineering organizations tells a very different story.
The biggest disconnect in enterprise software right now is the distance between the AI narrative and the AI reality inside large engineering organizations.
The narrative says the companies that have not adopted are dinosaurs. The reality, from hundreds of conversations with engineering leaders at banks, insurers, and Fortune 500 companies, looks very different. And now the research is catching up to what practitioners have been seeing all along.
There is no doubt that engineers at large enterprises have touched coding agents. In the 2025 DORA report, 90 percent of technology professionals said they use AI at work, with a median of two hours per day [1]. Individual exposure is near universal.
But organizational adoption, agents actually integrated into the software development lifecycle with governance, security review, and procurement sign-off, is still early. MIT’s NANDA initiative mapped what happens between interest and production, and the funnel is brutal [2]:
Despite an estimated 30 to 40 billion dollars in enterprise GenAI investment, 95 percent of pilots delivered no measurable P&L impact [2]. And among the companies that did move fast on coding agents, more than a few have quietly pulled deployments back after incident rates spiked, review queues ballooned, or security teams flagged what was shipping.
Here is the uncomfortable part: most of these organizations cannot actually tell you which outcome they got. They know their license count. They know their seat activation rate. They do not know whether AI-generated code is making them faster, or just making them busier.
The 2025 DORA report captured the tradeoff precisely. For the first time, AI adoption showed a positive relationship with software delivery throughput. But it continued to show a negative relationship with delivery stability: more change volume exposing weaknesses downstream, more rework, more failed deployments [1]. DORA’s conclusion is one every engineering leader should internalize: AI is an amplifier. It magnifies the strengths of high-performing organizations and the dysfunctions of struggling ones.
There is an even sharper warning in the research: perception is not measurement. In METR’s randomized controlled trial, experienced developers using AI tools took 19 percent longer to complete real tasks in their own repositories. They believed AI had made them 20 percent faster [3]. The specific number has been debated and refined since, but the perception gap it exposed has not gone away. If your AI ROI story is built on developer surveys and vendor dashboards, you are measuring how AI feels, not what it delivers.
Every AI coding vendor now ships an adoption dashboard. Acceptance rates, suggestions served, lines generated. These numbers answer one question: is my team using the tool I bought?
They do not answer the questions your CFO and your board are asking. Is cycle time actually improving, or are we shipping more code that takes longer to review? Is quality holding, or are change failure rates climbing behind the adoption curve? Which teams are getting real leverage, and which are generating rework? And the biggest one: what is the return on the seven or eight figures we are committing to AI tooling?
Vendor metrics measure the tool. They cannot measure the organization. And they certainly cannot compare outcomes across the three or four AI tools most enterprises now run in parallel, alongside the shadow usage nobody procured. MIT found that employees at over 90 percent of surveyed firms regularly use personal AI tools at work, while only about 40 percent of companies have enterprise subscriptions [2]. If your measurement stops at the vendor dashboard, most of your AI activity is invisible to you.
If you are a bank, an insurer, or a healthcare company, “trust the vendor dashboard” is not an answer you can bring to a regulator or an internal audit committee. You need evidence.
Which code was AI-assisted, and did it pass the same quality gates as everything else? Can you attribute incidents to specific tools, teams, or workflows? Can you demonstrate that your AI investment governance is based on measured outcomes rather than vendor claims?
Guardrails and measurement have moved from an afterthought in a Confluence doc to a board-level requirement. The organizations getting this right treat AI adoption the way finance treats capital allocation: baselined before deployment, measured continuously, attributed precisely, and auditable end to end.
What is happening now mirrors the on-prem to cloud migration, a transformation that took the better part of a decade and is still in progress. Cloud adoption also ran ahead of cloud economics. Companies lifted and shifted, bills exploded, and only then did FinOps emerge as a discipline, several years after the infrastructure wave started.
AI in engineering is following the same arc, just compressed. The tooling wave came first. The measurement and governance discipline is arriving now, because the spend has become too large and the risk too visible to run on faith.
The winners of the cloud era were not the earliest adopters. They were the organizations that built the discipline to know what was working, kill what was not, and scale what compounded.
This is exactly why we rebuilt Waydev around three pillars: AI Adoption, AI Impact, and AI ROI.
Coding agents are part one of a longer transformation toward the software factory. That transformation will take years. But the organizations that will lead it are deciding right now whether they will navigate it with evidence or with anecdotes.
The gap between AI adoption and AI ROI is real, it is larger than most people realize, and it will not close on its own. It closes with measurement.
Ready to unlock your SDLC productivity?