





DORA: throughput
The current DORA research model includes change lead time, deployment frequency and failed deployment recovery time in throughput. Establish service-level baselines and keep definitions consistent.
SDLC
Gain full visibility into your SDLC, uncover friction points, and drive continuous improvement using SPACE and DORA metrics—benchmarked against industry standards.

Measure delivery speed, stability and experience without reducing engineering productivity to a single score.
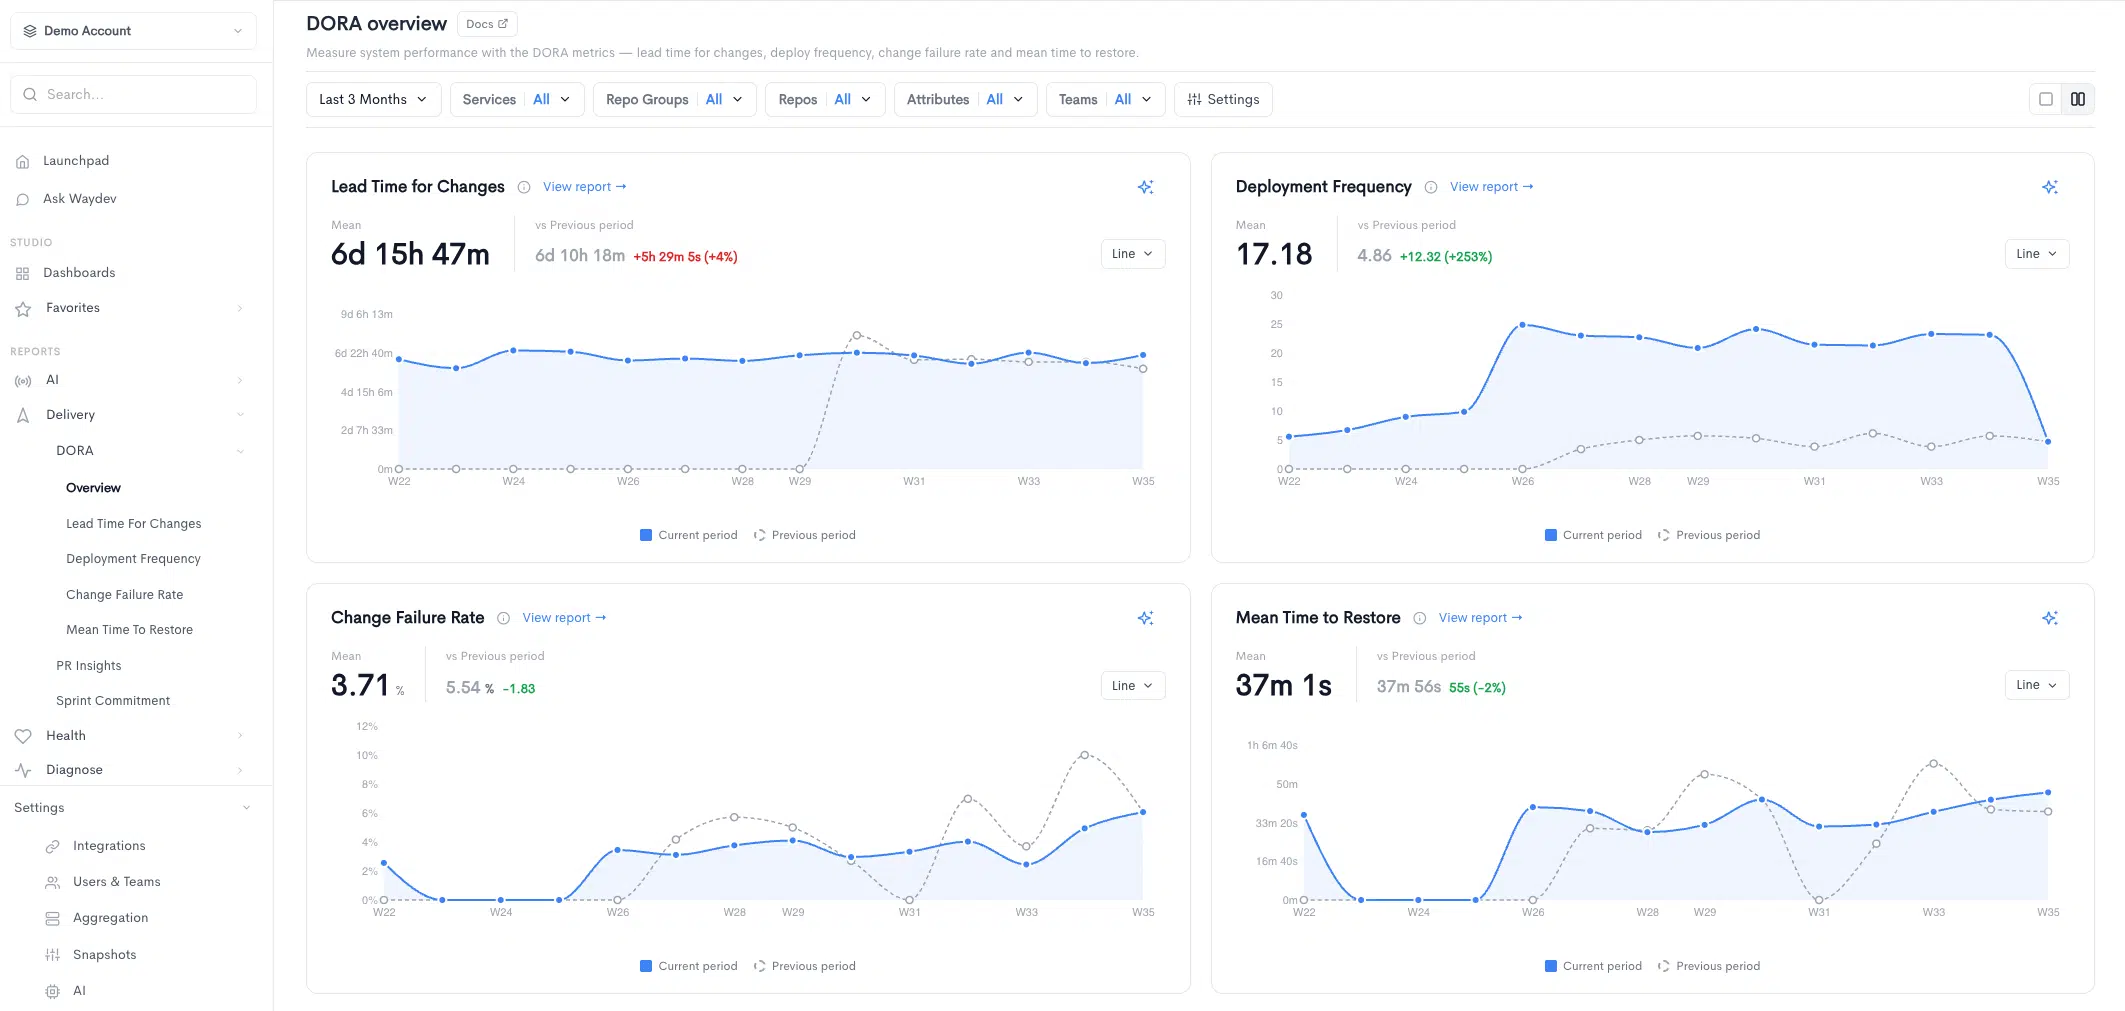
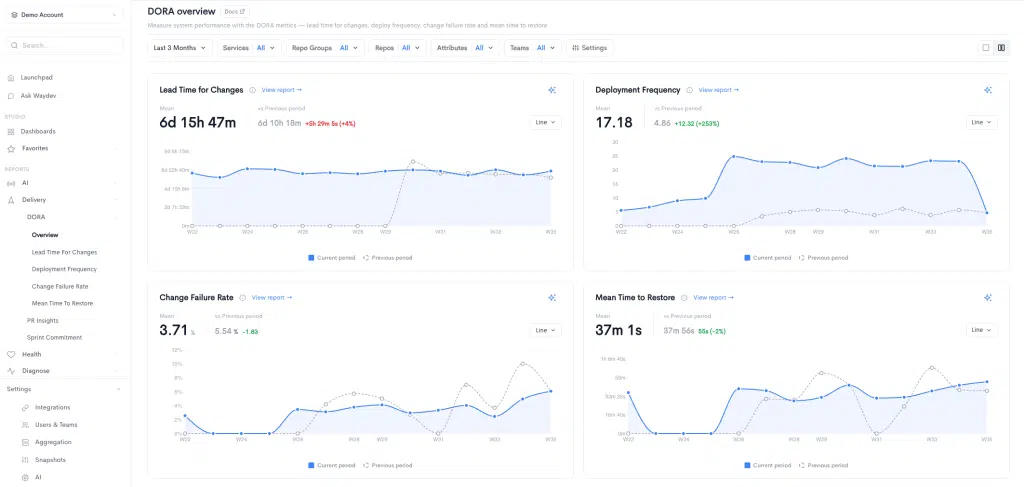
Track change lead time and deployment frequency alongside recovery and change-failure indicators. DORA’s current five-metric framework also includes deployment rework rate; verify which metrics your connected Waydev deployment supports and interpret them together.
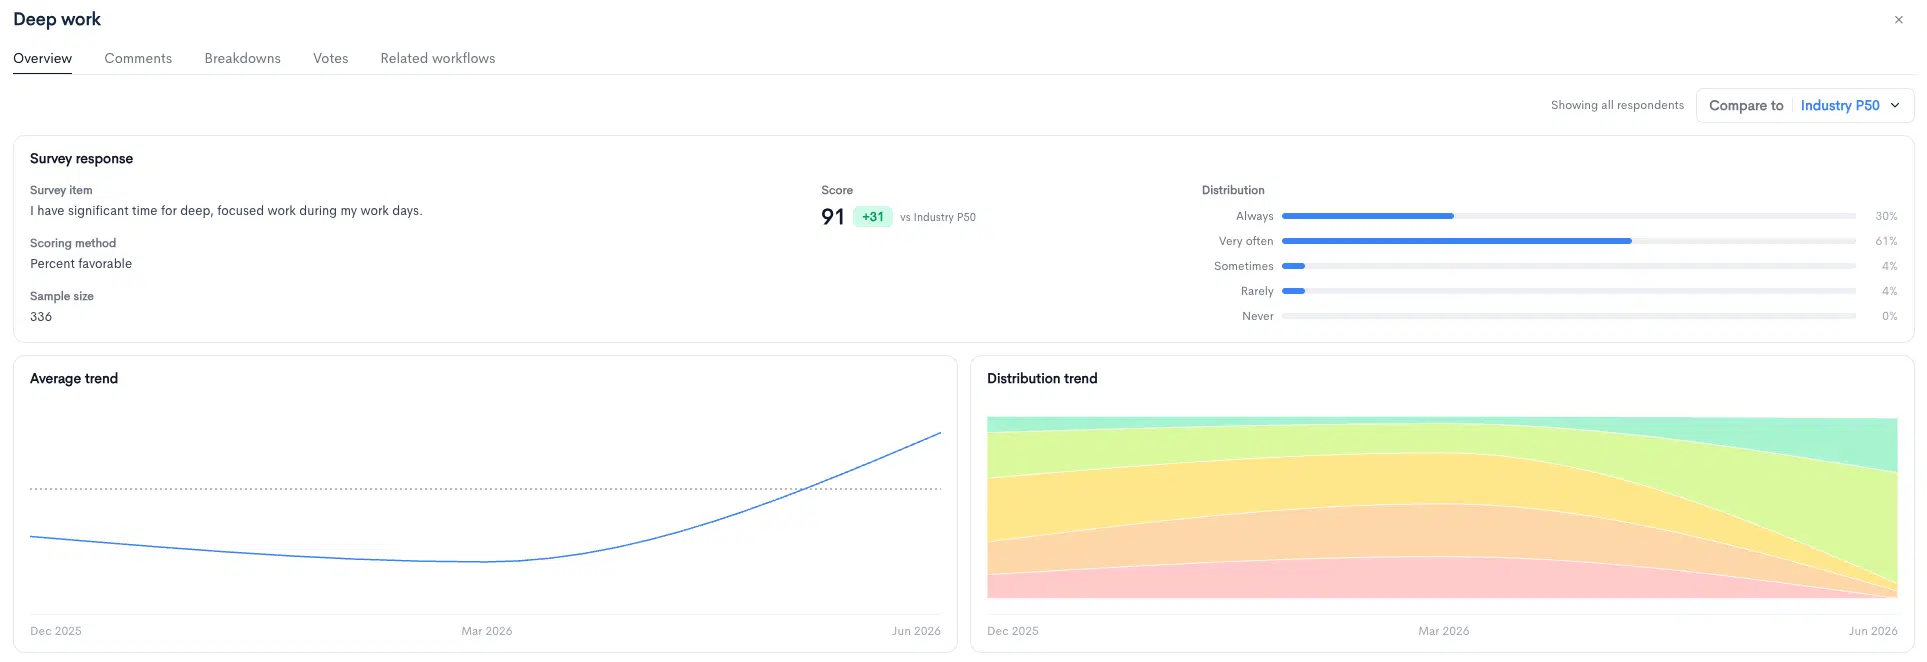
Using SPACE Framework metrics, you can gain a complete view of your organization’s performance and insights into areas for improvement in processes, tools, culture, and individual professional development.
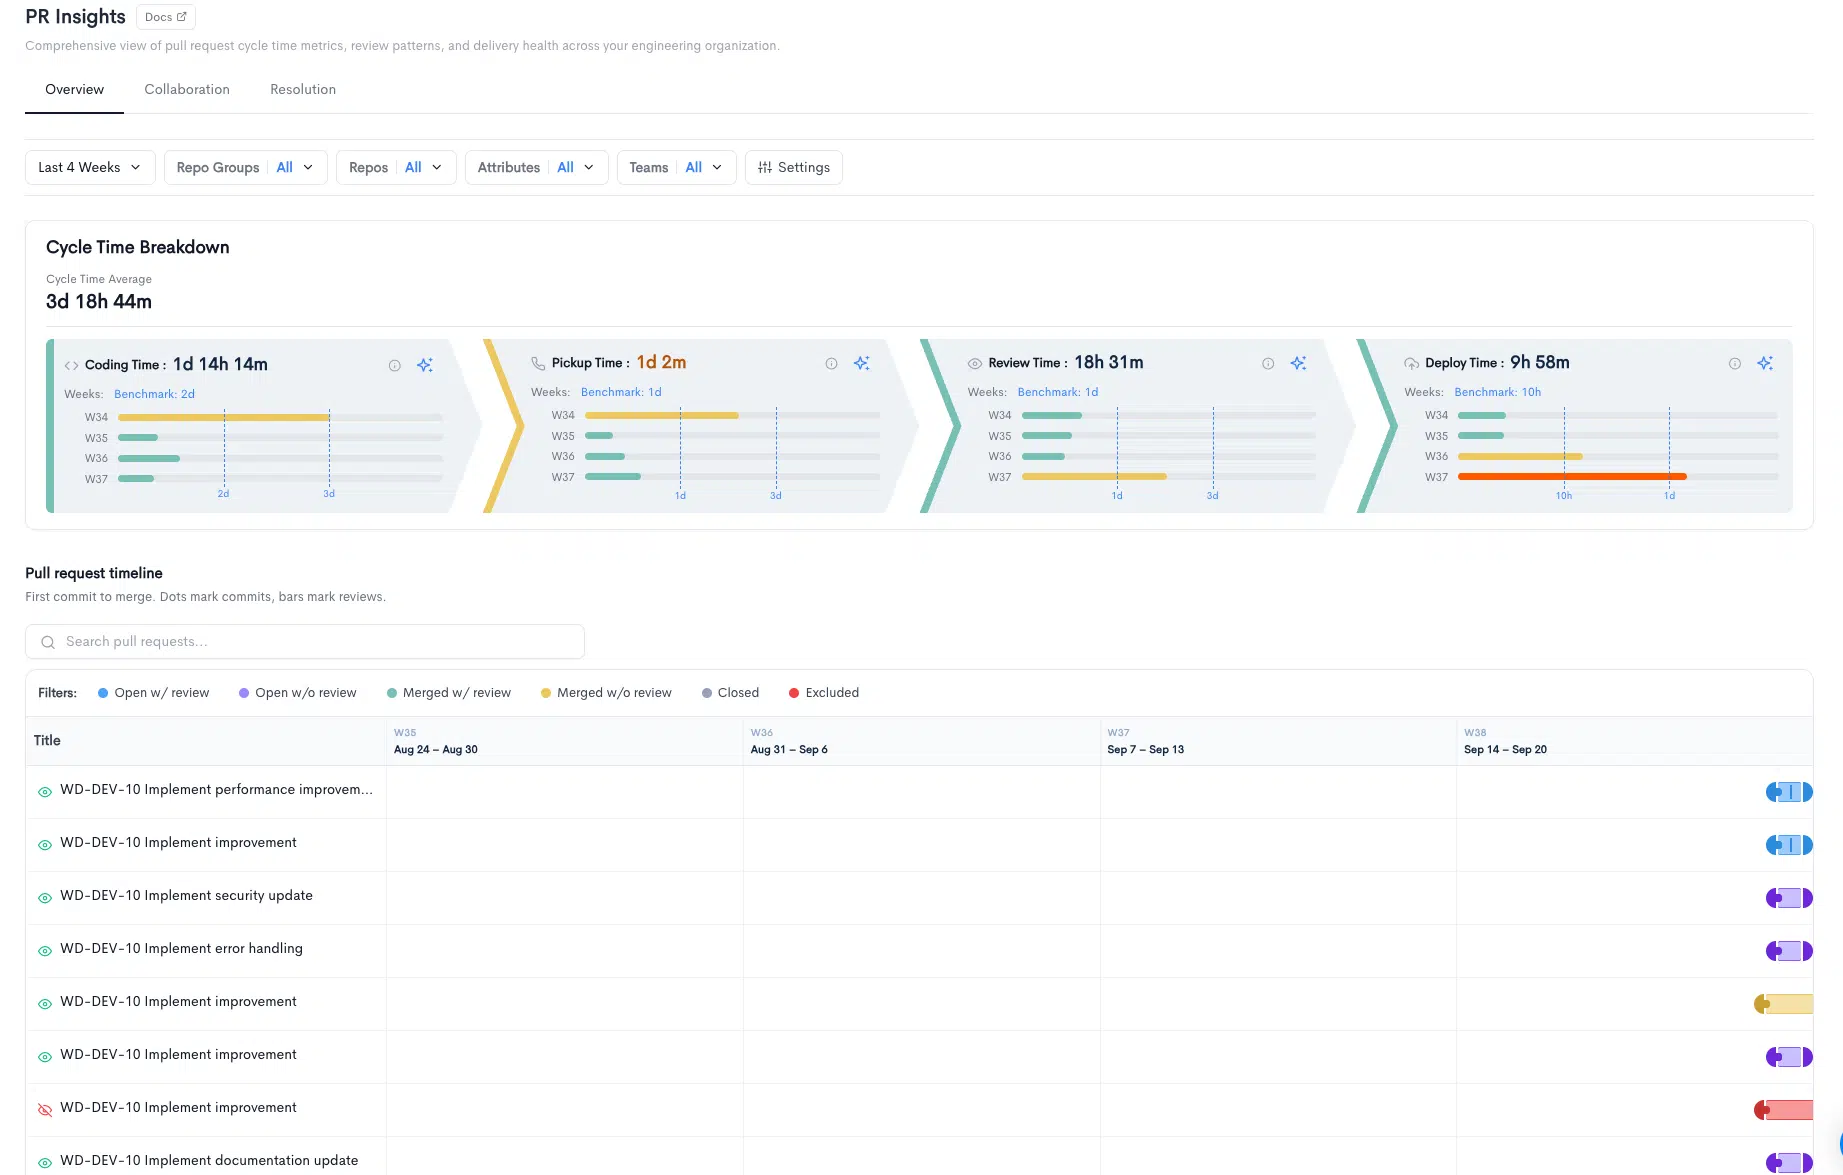
Identify bottlenecks and shorten the time-to-market by measuring and optimizing cycle time. Use baseline cycle time, review waiting and rework trends to test improvements in your own environment. Results vary by team, workflow, and measurement period.
Gain insights into how engineering teams collaborate across the development lifecycle. Understand patterns in code reviews, reviewer engagement, and cross-team dynamics to uncover opportunities for stronger alignment, smoother delivery, and improved engineering culture.
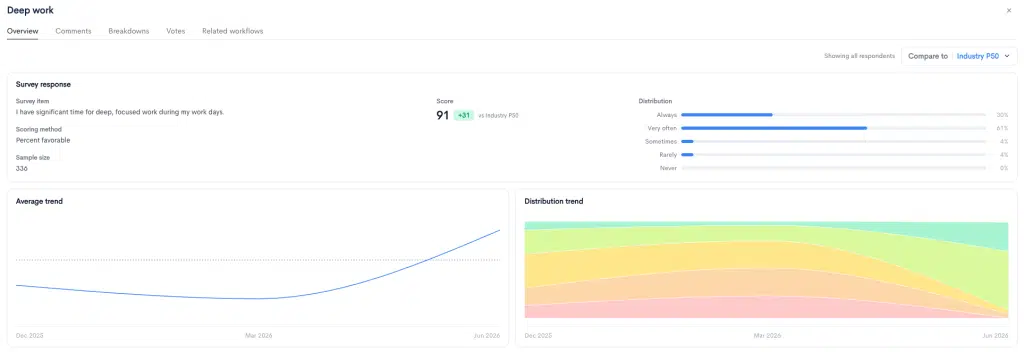
Measure team sentiment and satisfaction to strengthen retention, engagement, and performance. Leverage Developer Experience surveys to uncover hidden friction and assess morale.
DORA measures software delivery performance, while SPACE highlights the need for multiple dimensions of developer productivity. Use both, alongside developer feedback, to understand flow and stability instead of ranking people by commit counts.
The current DORA research model includes change lead time, deployment frequency and failed deployment recovery time in throughput. Establish service-level baselines and keep definitions consistent.
Change fail rate and deployment rework rate describe instability. Waydev’s currently documented DORA report lists four traditional metrics; confirm actual metric availability and definitions before claiming five-metric product coverage.
Add developer satisfaction, activity context, communication, flow and efficiency alongside surveys or other developer experience signals. Do not collapse the framework into one productivity score.
A platform team increases deployment frequency, but failed changes rise and reviewers report interrupt-driven work. Review both throughput and instability, then use team feedback to choose a process experiment.
Interpretation and limitations: DORA metrics are best interpreted within the context of an application or service, not as a league table of unrelated teams. The official framework has evolved beyond the original four metrics.
DORA currently defines five performance metrics. Waydev’s public product documentation explicitly describes four; feature coverage must be checked for the deployed version.
They are not suitable as a stand-alone individual ranking system. Use multiple measures and contextual discussions.
Static, real product screenshots sourced exclusively from Waydev feature pages. Example interface data.
READY TO ADOPT A DEVELOPER PRODUCTIVITY INSIGHT PLATFORM?