


Delivery
DORA Metrics
The DORA Metrics have become an industry standard for how effectively organizations deliver software. Waydev’s DORA Metrics report is designed for engineering leaders to track and measure software delivery performance metrics.
DORA Metrics will help you better understand how to assess velocity (using Deployment Frequency or Mean Time to Recovery) and code quality (with the help of Change Failure Rate and Lead Time For Changes).
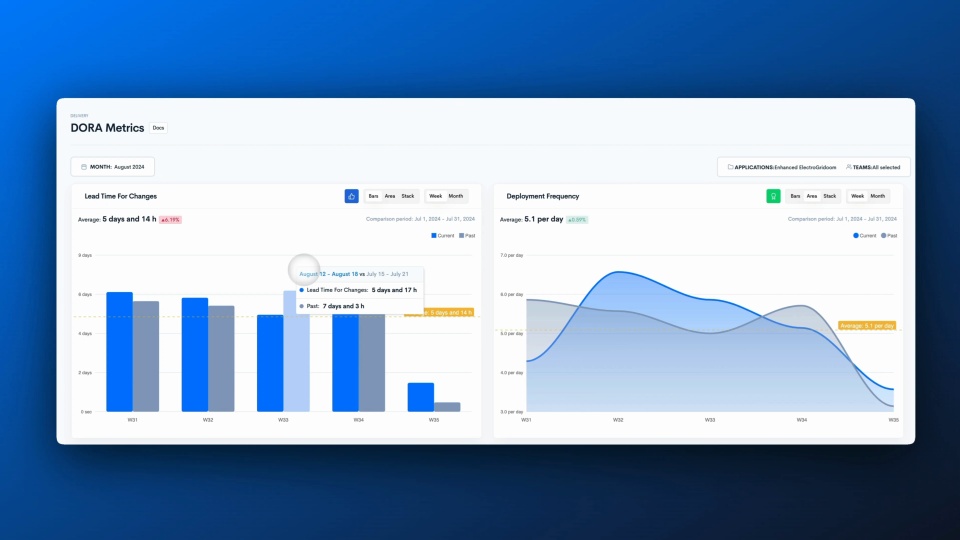
Deployment Frequency
- Deployment Frequency tracks how often a team successfully deploys code to production, reflecting delivery speed and responsiveness.
- The Deployment Frequency of releases depends on several factors, such as the tasks given or the deployment size. Teams that follow best practices usually work with tasks broken into smaller batch sizes to make the deployments more frequent.
- Depending on the task at hand, some teams may deliver once a week, while high-performing ones have deployments a few times a day.
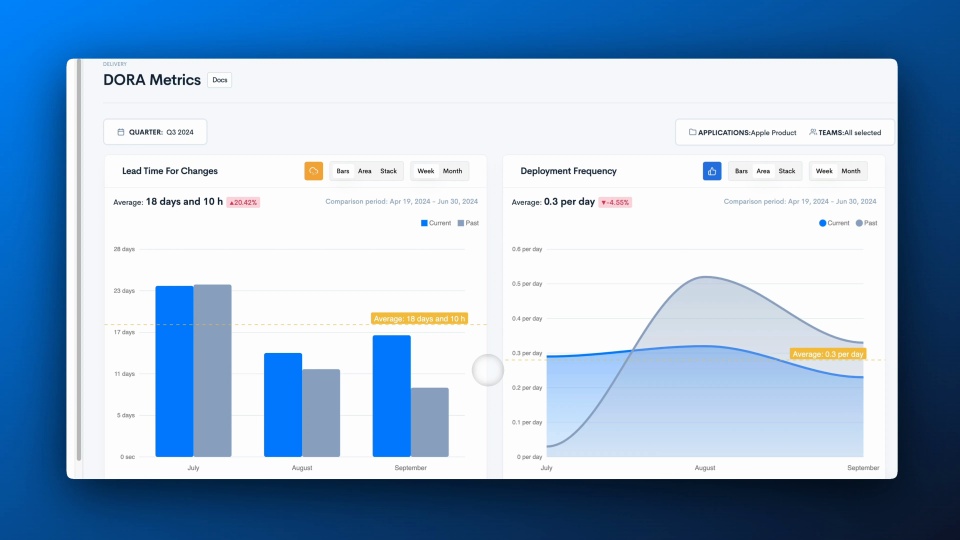
Lead Time for Changes
- Lead Time is a velocity metric that shows how long a commit takes to reach production.
- The less the value of Lead Time is, the higher the team’s performance responsible for implementing it. When the time between the first commit and release is long, this can indicate bottlenecks that delay deployment or an inefficient workflow.
- Lead Time is a great way of assessing the effectiveness of the deployment process, which is an important performance indicator.
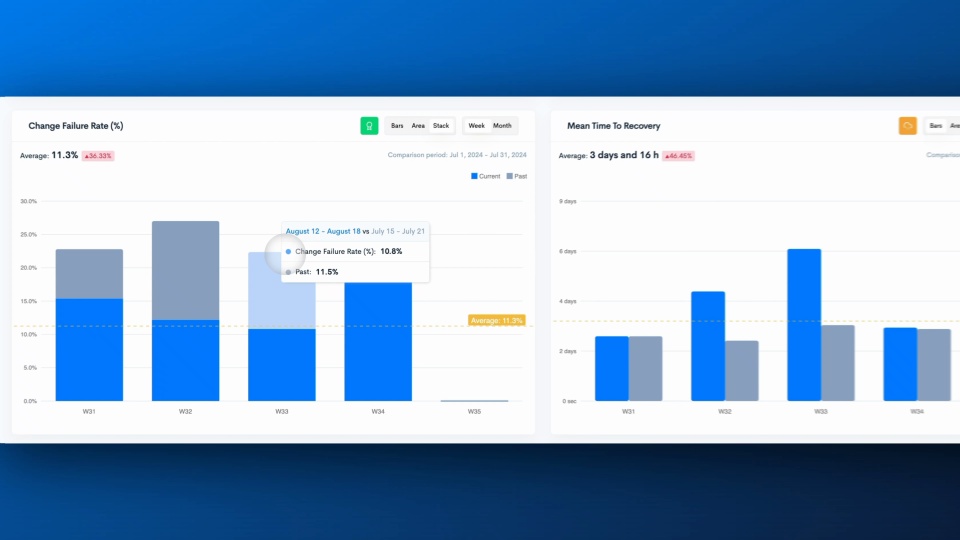
Change Failure Rate
- Change Failure Rate is a metric that measures the percentage of changes deployed to production that result in failures, such as downtime or critical issues.
- A high Change Failure Rate indicates potential issues in the deployment process, highlighting areas for improvement in software quality and stability.
- This metric is essential for understanding the reliability of releases and the effectiveness of testing and deployment practices.
Mean Time to Recovery
- Mean Time to Recovery measures the time it takes for teams to recover from a failure in production.
- This reflects the efficiency of engineering teams in identifying, responding to, and resolving issues quickly.
- Identifying the problem fast and responding as quickly as possible are indicators of high-performing engineering teams and it is crucial to prioritize velocity and quality and promptly address any issues.
Learn How to Track and Improve Software Delivery Performance with DORA Metrics
- Get to know the 4 Key Indicators of Elite DevOps Performance
- Download Waydev’s DORA metrics e-book
- Measuring team performance using DORA metrics and more
- Measuring developer performance using DORA metrics and more
- Leveraging DORA metrics as a proactive Engineering Manager
- DORA metrics and more software quality metrics
- DORA metrics for software Team Leads
- DORA metrics and more engineering metrics that matter
Trusted by FORTUNE 500 enterprise companies


READY TO ADOPT A DEVELOPER PRODUCTIVITY INSIGHT PLATFORM?