For
Measure and optimize your team's software delivery while identifying and addressing bottlenecks, to improve efficiency and drive results.
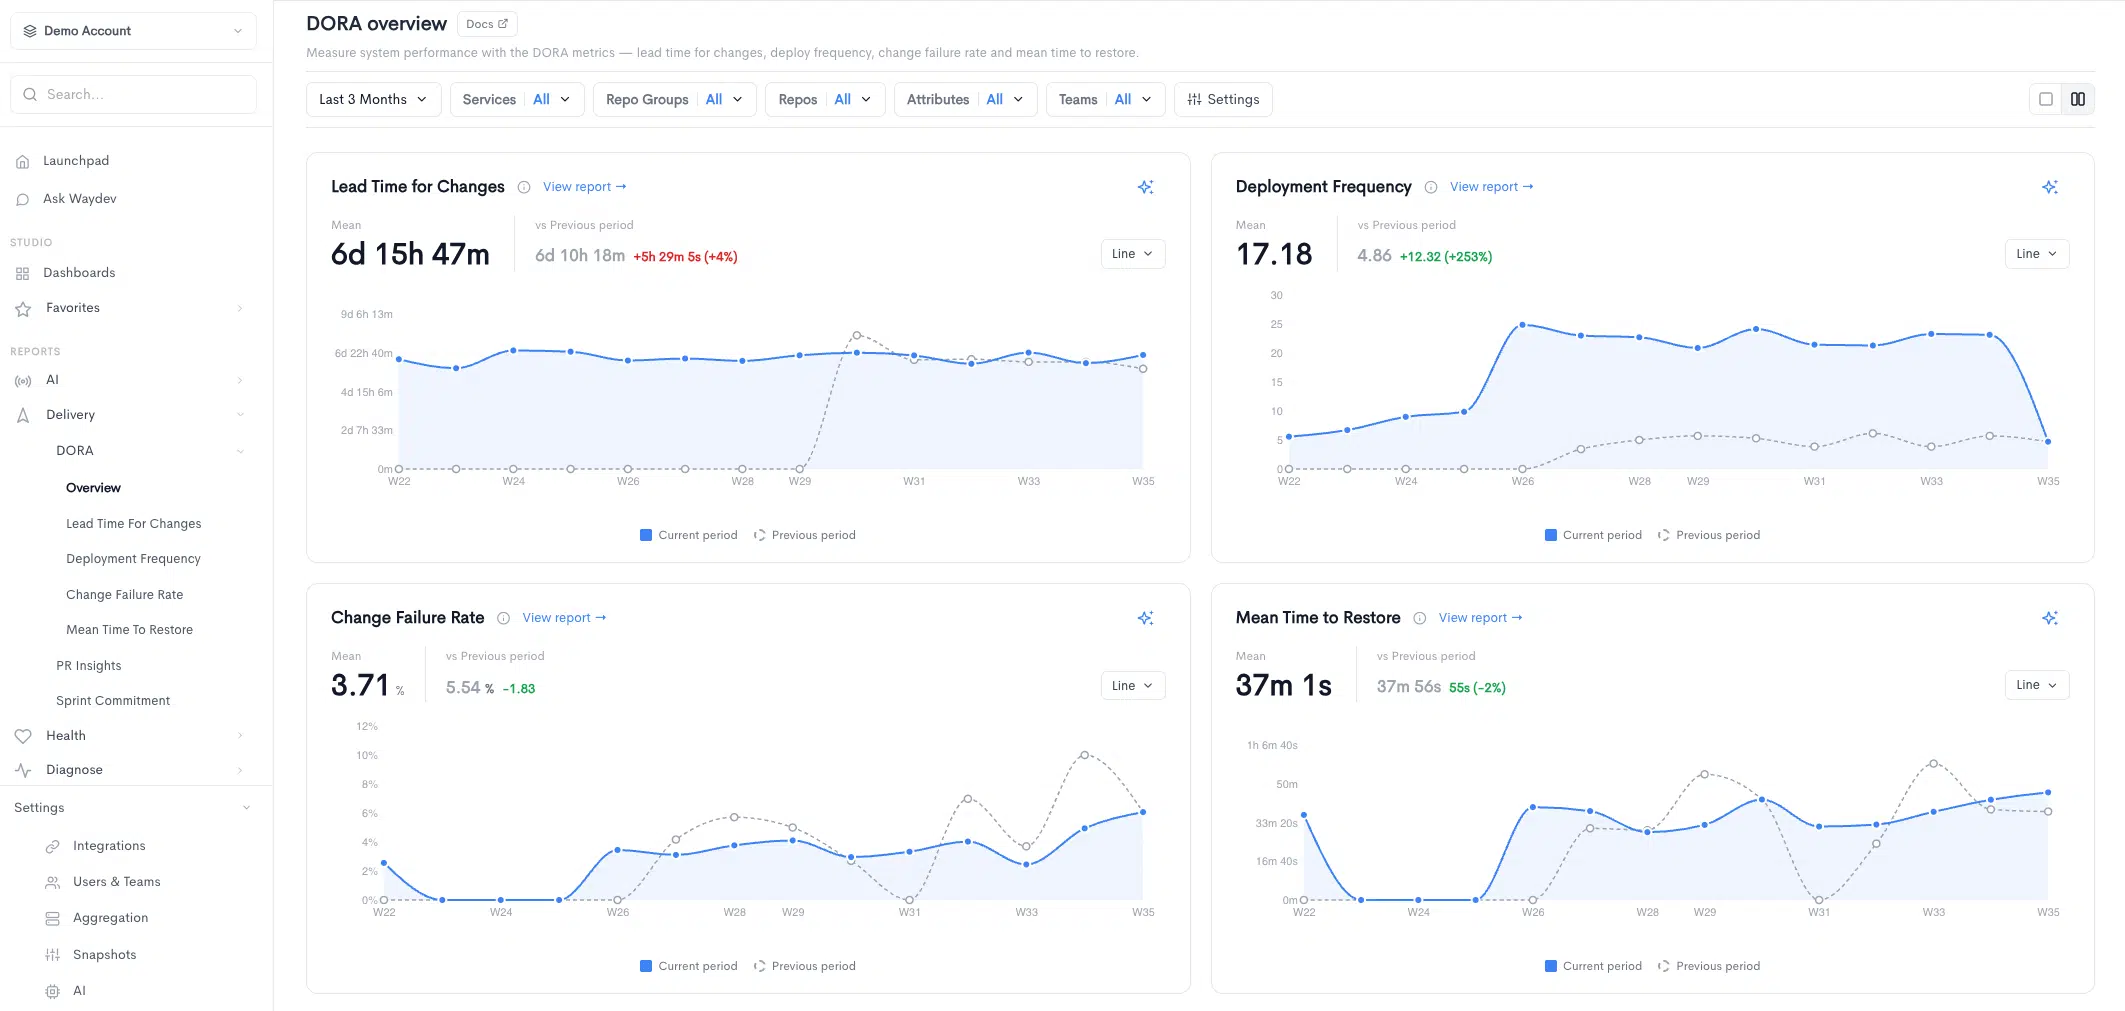
DORA Metrics will help you better understand how to assess velocity (using Deployment Frequency or Mean Time to Recovery) and code quality (with the help of Change Failure Rate and Lead Time For Changes).
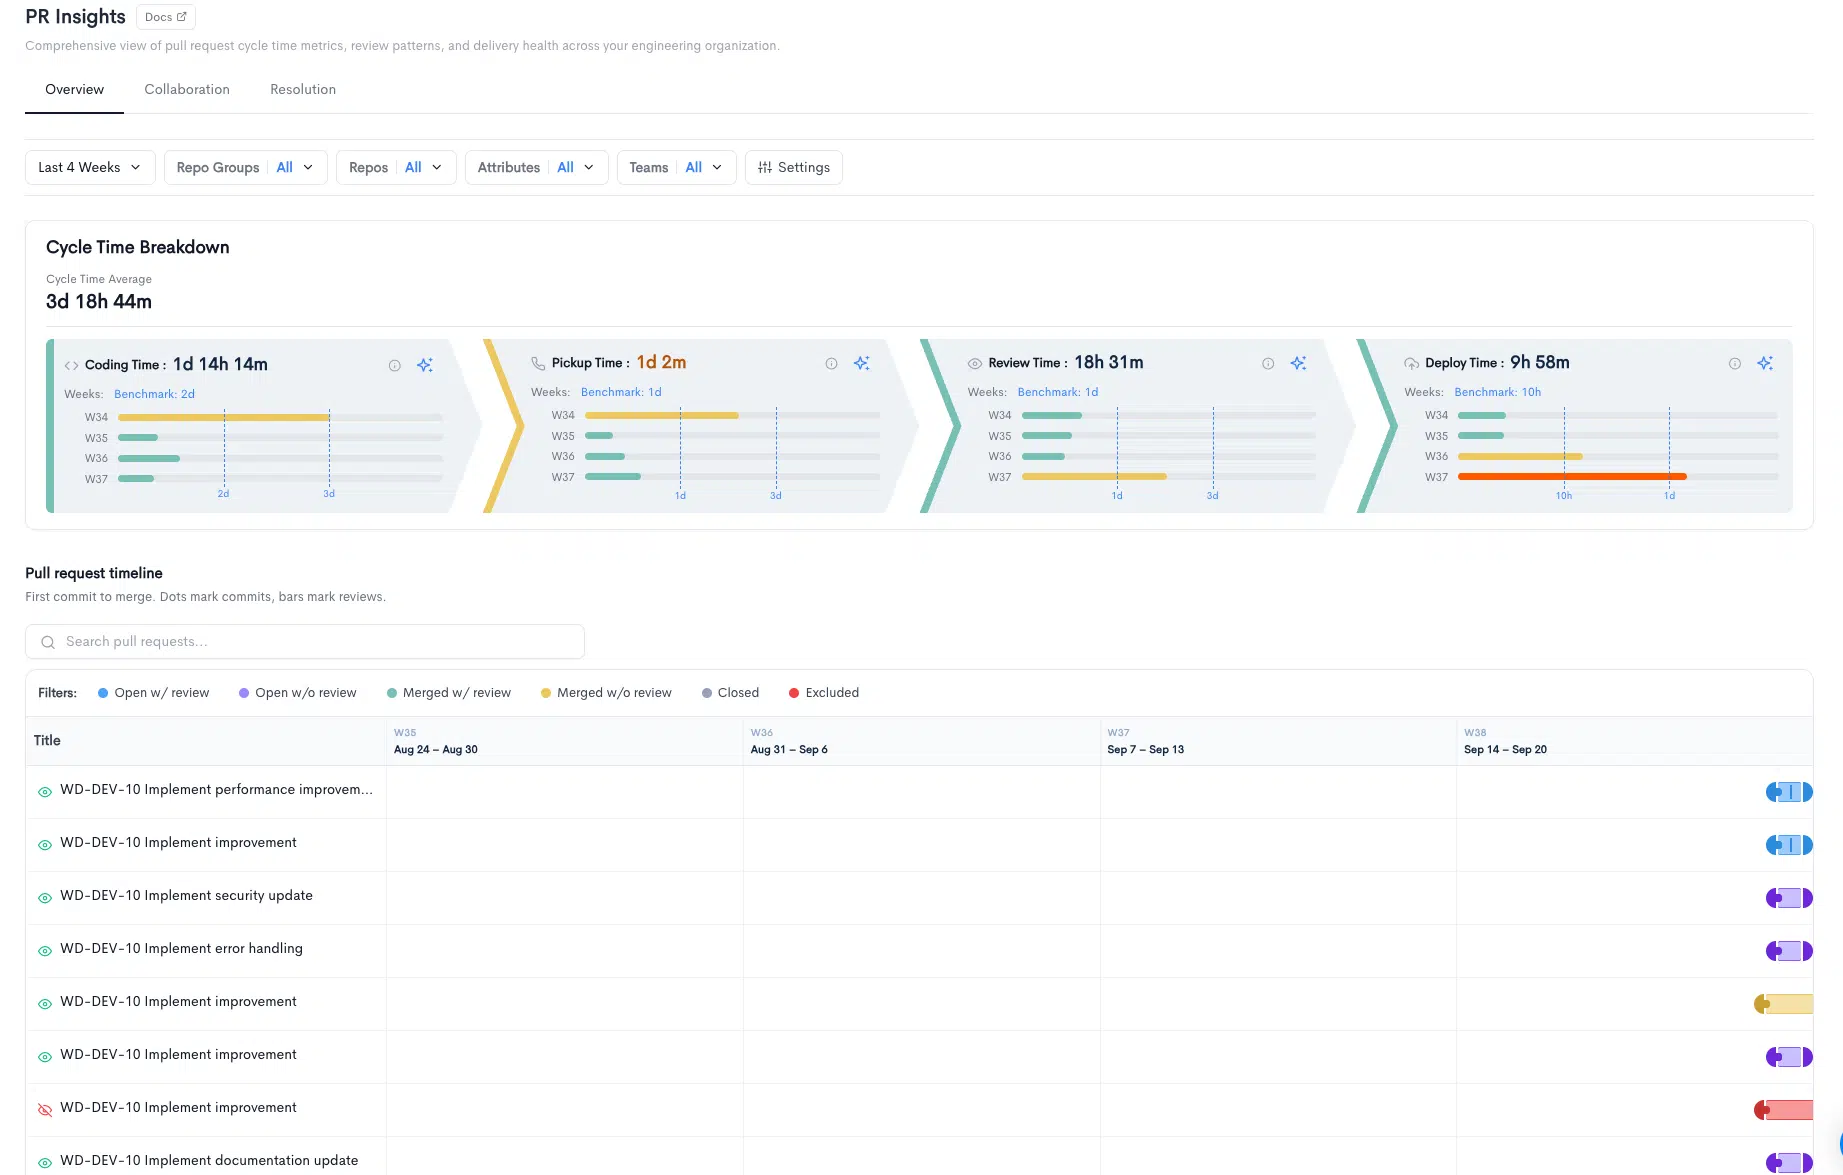
Cycle time measures process speed. It’s the speed of your development time, how fast you can deliver a feature to the customer, from the moment work has started to the moment it’s been delivered.
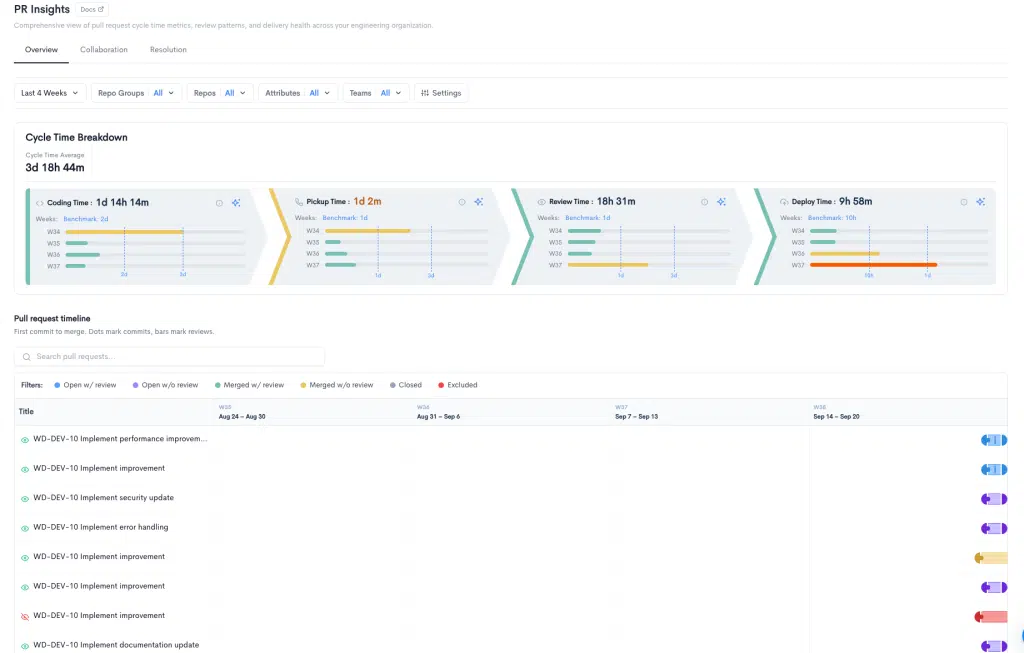
Gain complete visibility into all Pull Requests within any timeframe through a single, intuitive dashboard.
Keep a pulse on your sprint progress. Visualize and mitigate sprint risk using our forecast model. Identify capacity issues and scope creep.
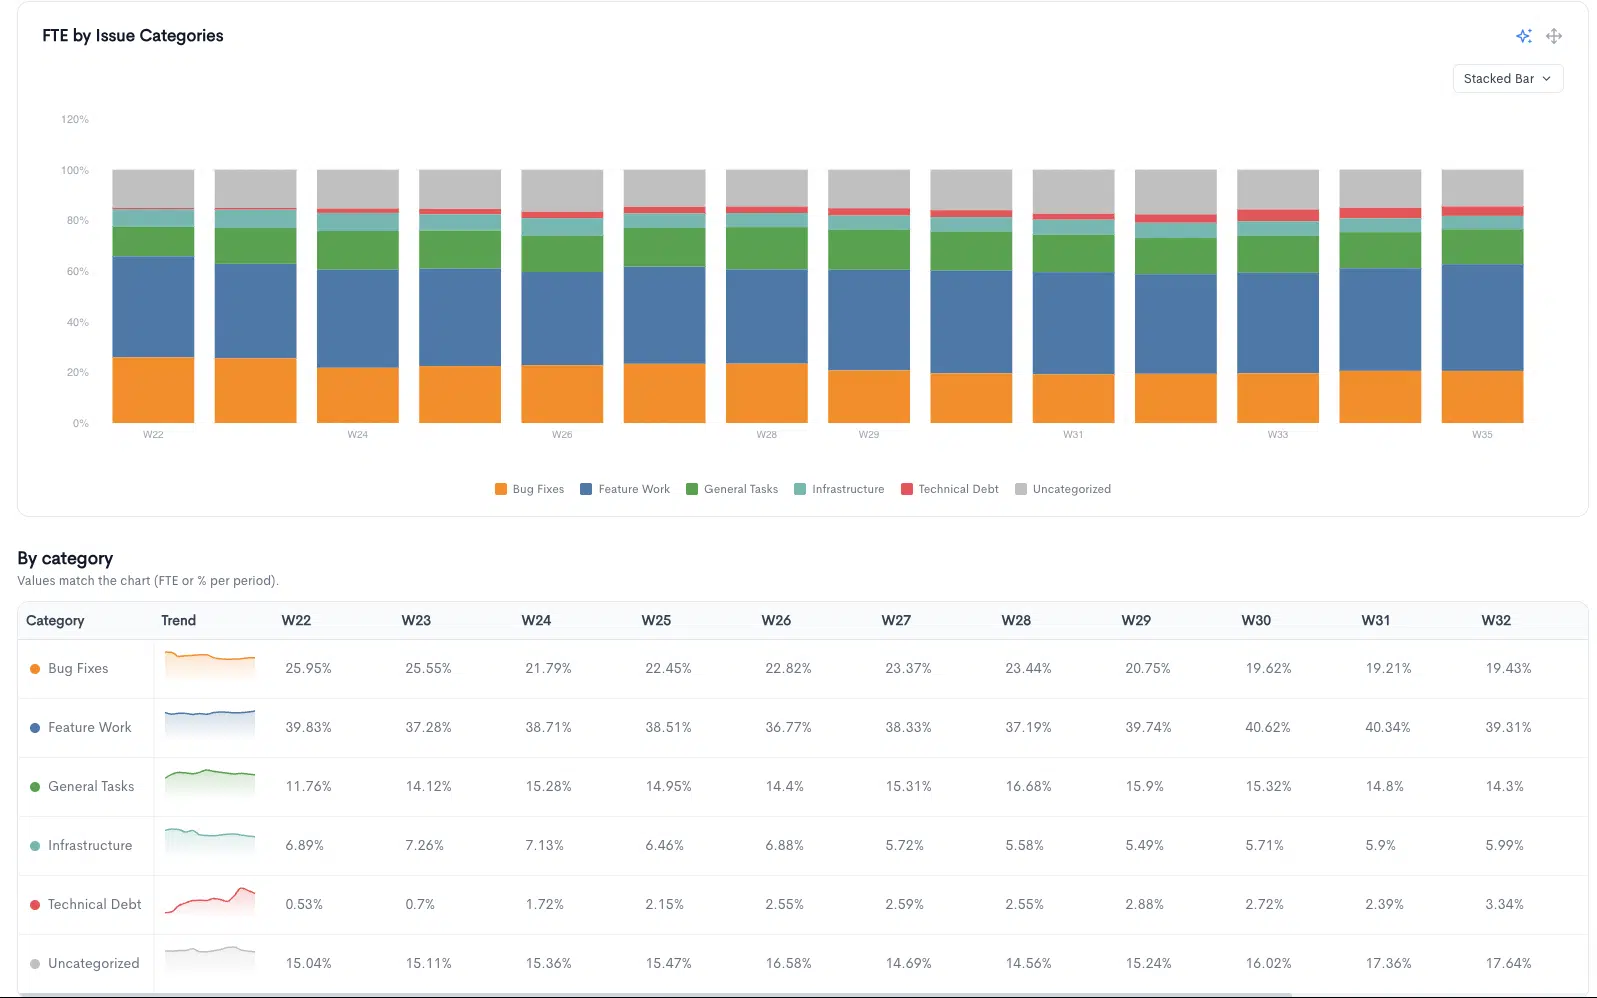
Contributor Insights provides a comprehensive overview of your engineering team members’ recent activities.
The Benchmark feature allows you to asses your team’s performance in alignment with key company standards and metrics.
Hygiene helps you assess whether your teams are properly tracking their work and maintaining high standards. It’s designed to provide valuable insights into your team’s commitment to best practices and continuous improvement.
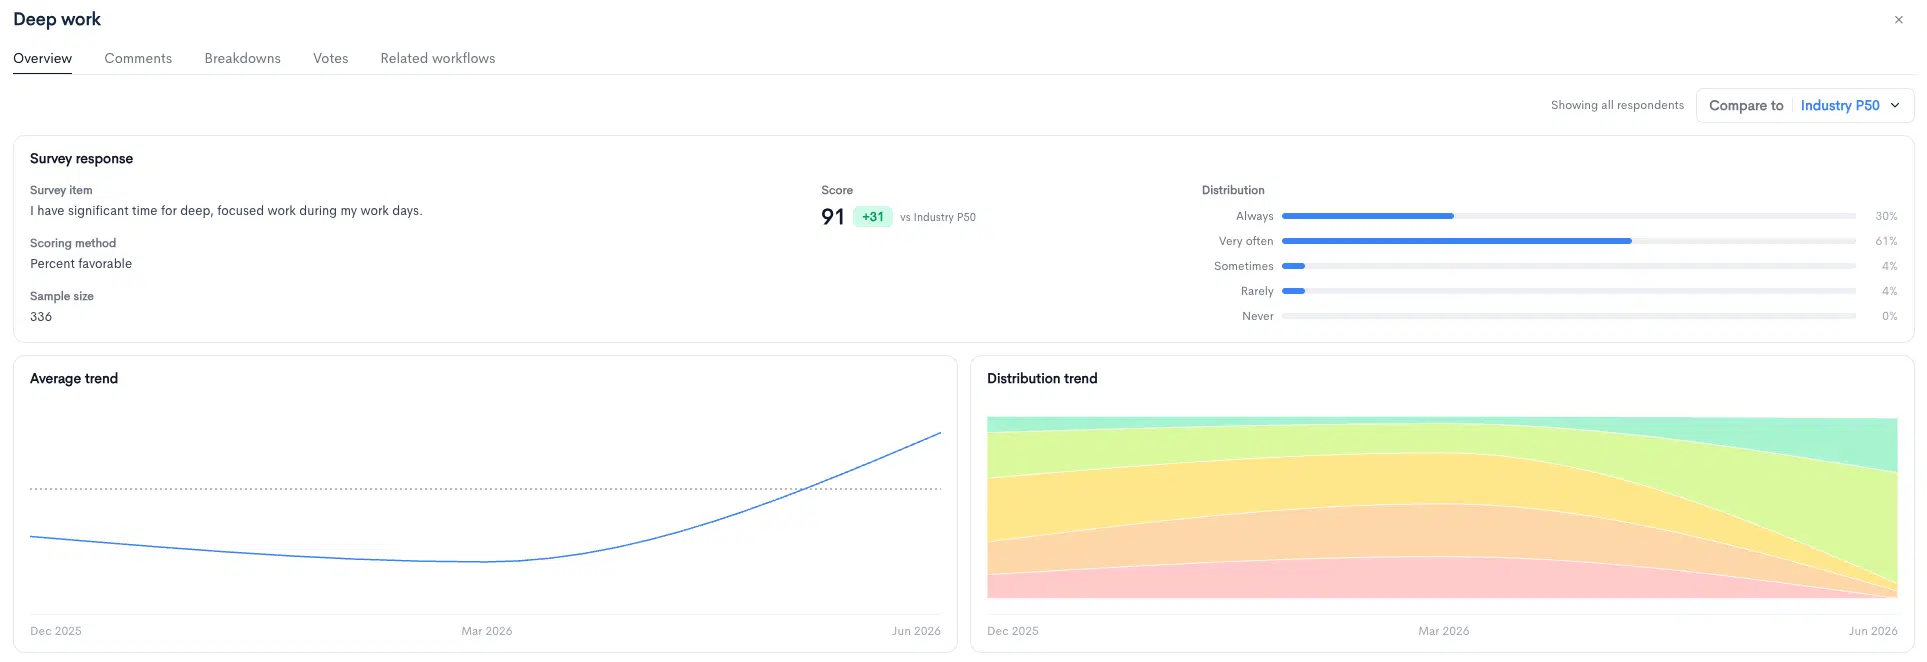
Developer Experience (DX), designed to give leaders the insights they need to identify the challenges their contributors face and unlock their full potential.
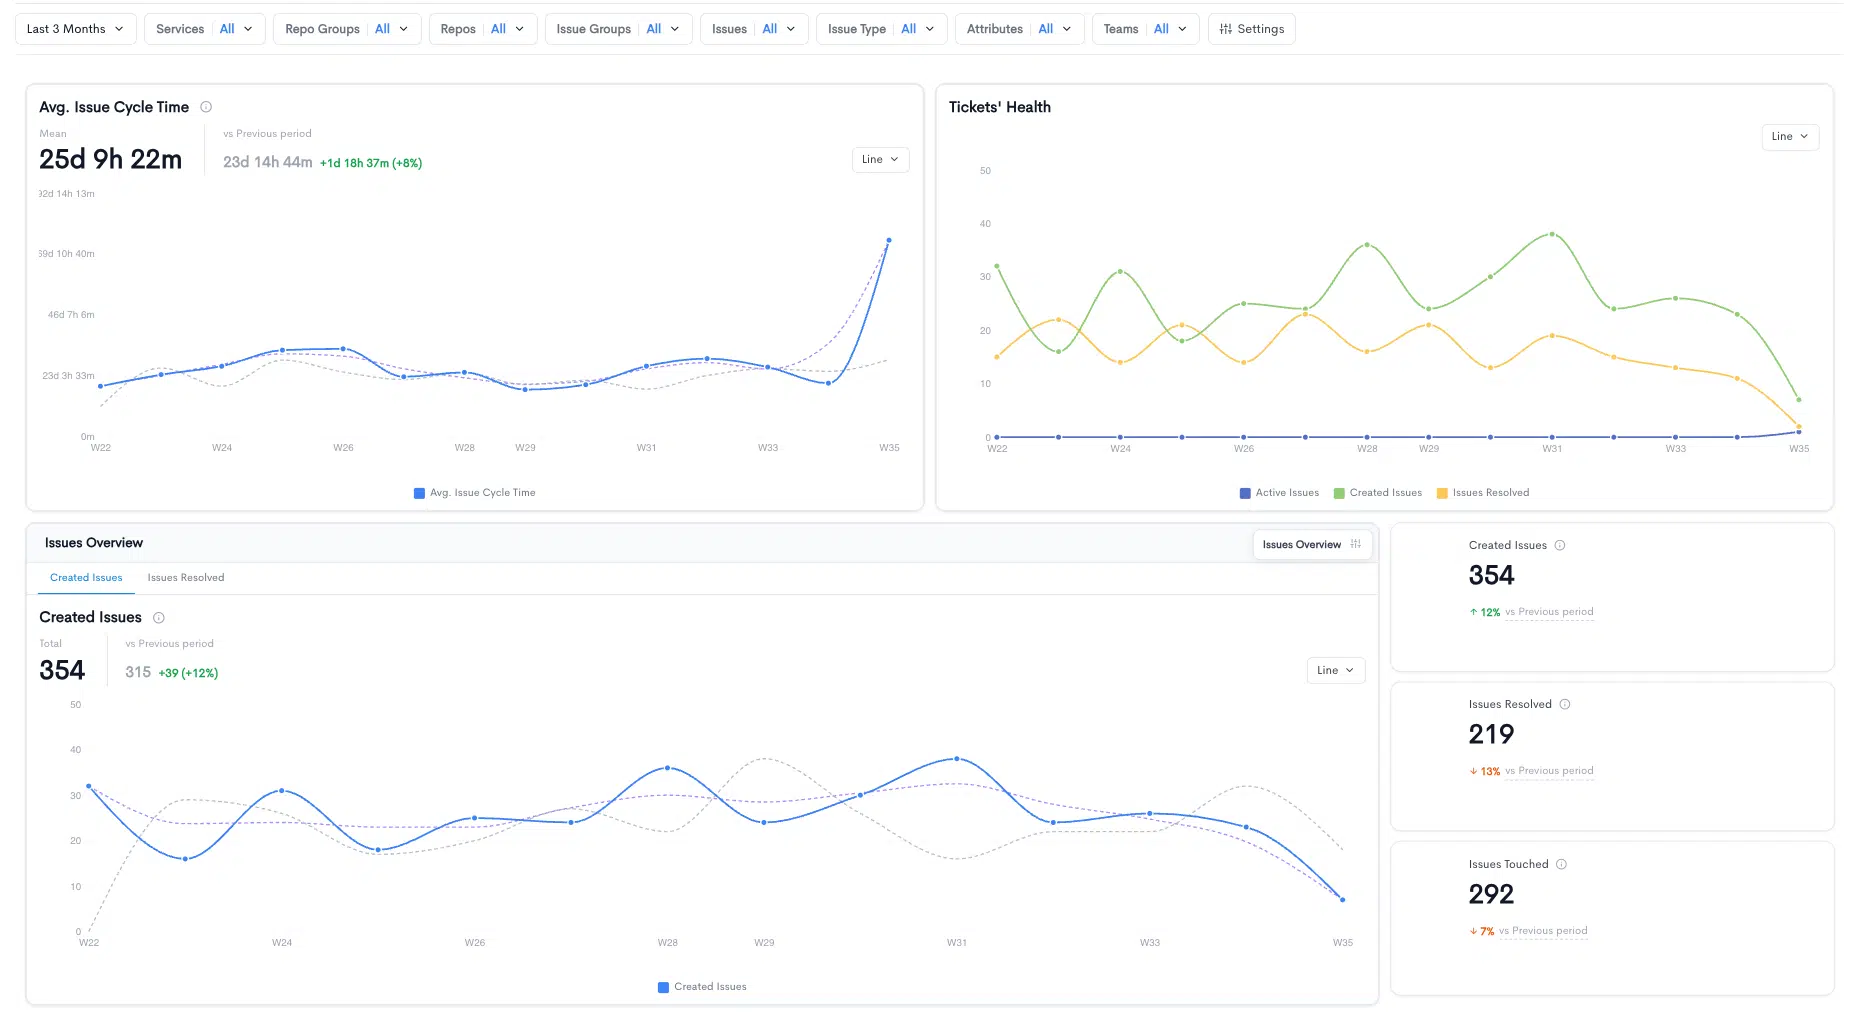
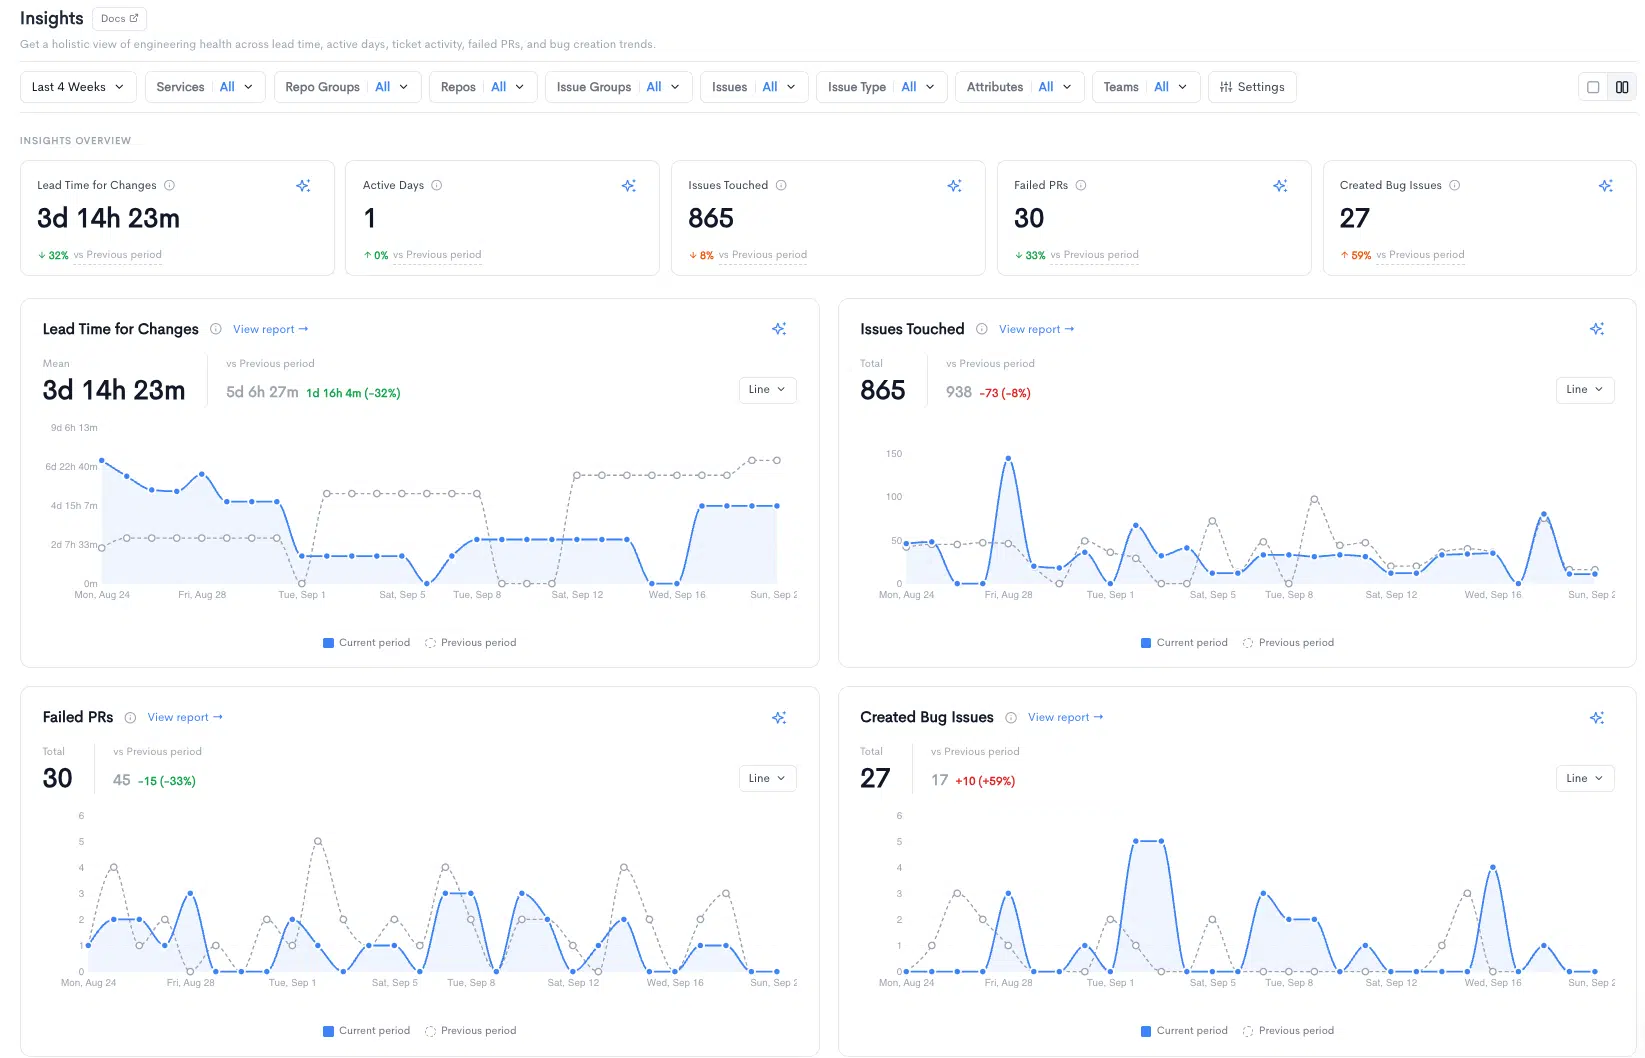
For engineering managers, monitor pull request pickup, review waiting, work-in-progress and sprint delivery. Combine the metrics with team discussions and focus on changes you can verify.
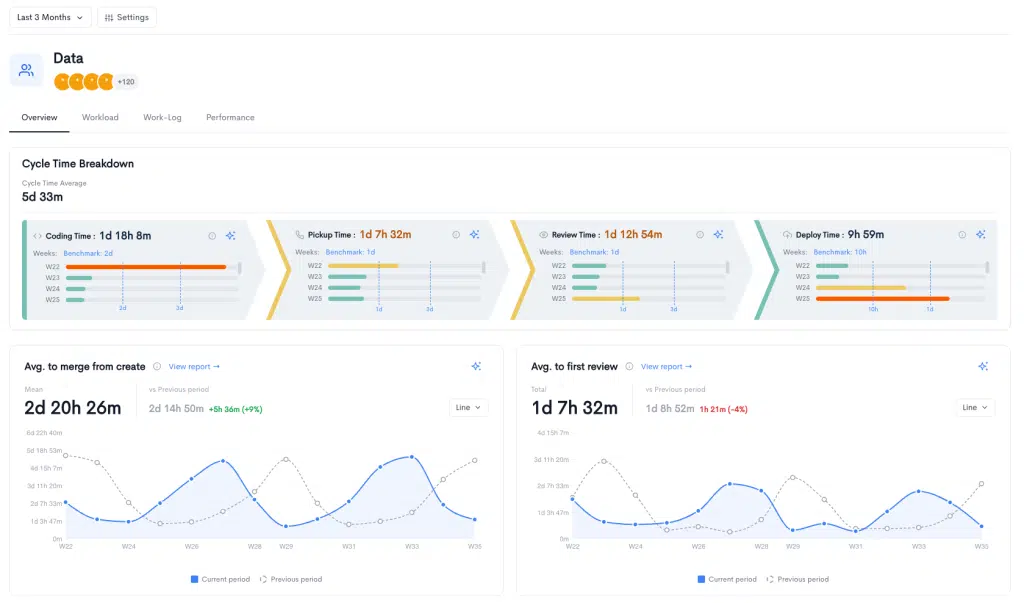
Identify whether a stalled PR is waiting for a reviewer or actually needs additional work before changing team capacity.
Real static screenshots from Waydev feature pages, with illustrative data. No video players.
Why Waydev
No more guessing, get granular visibility to manage your team’s better with objective data.
Understand insights in real-time, reduce engineering cycle time and increase your development speed.
Improve efficiencies, speed up engineering excellence and drive up productivity.


Ready to unlock your SDLC productivity?