





Baseline the workflow
Compare planned versus completed engineering work, code review waiting and cycle time for a representative period.
SDLC
Improve predictability with full visibility into the SDLC and mitigate risks by keeping track of the delivery process.

Compare actual flow and work-item progress with realistic prediction scenarios.
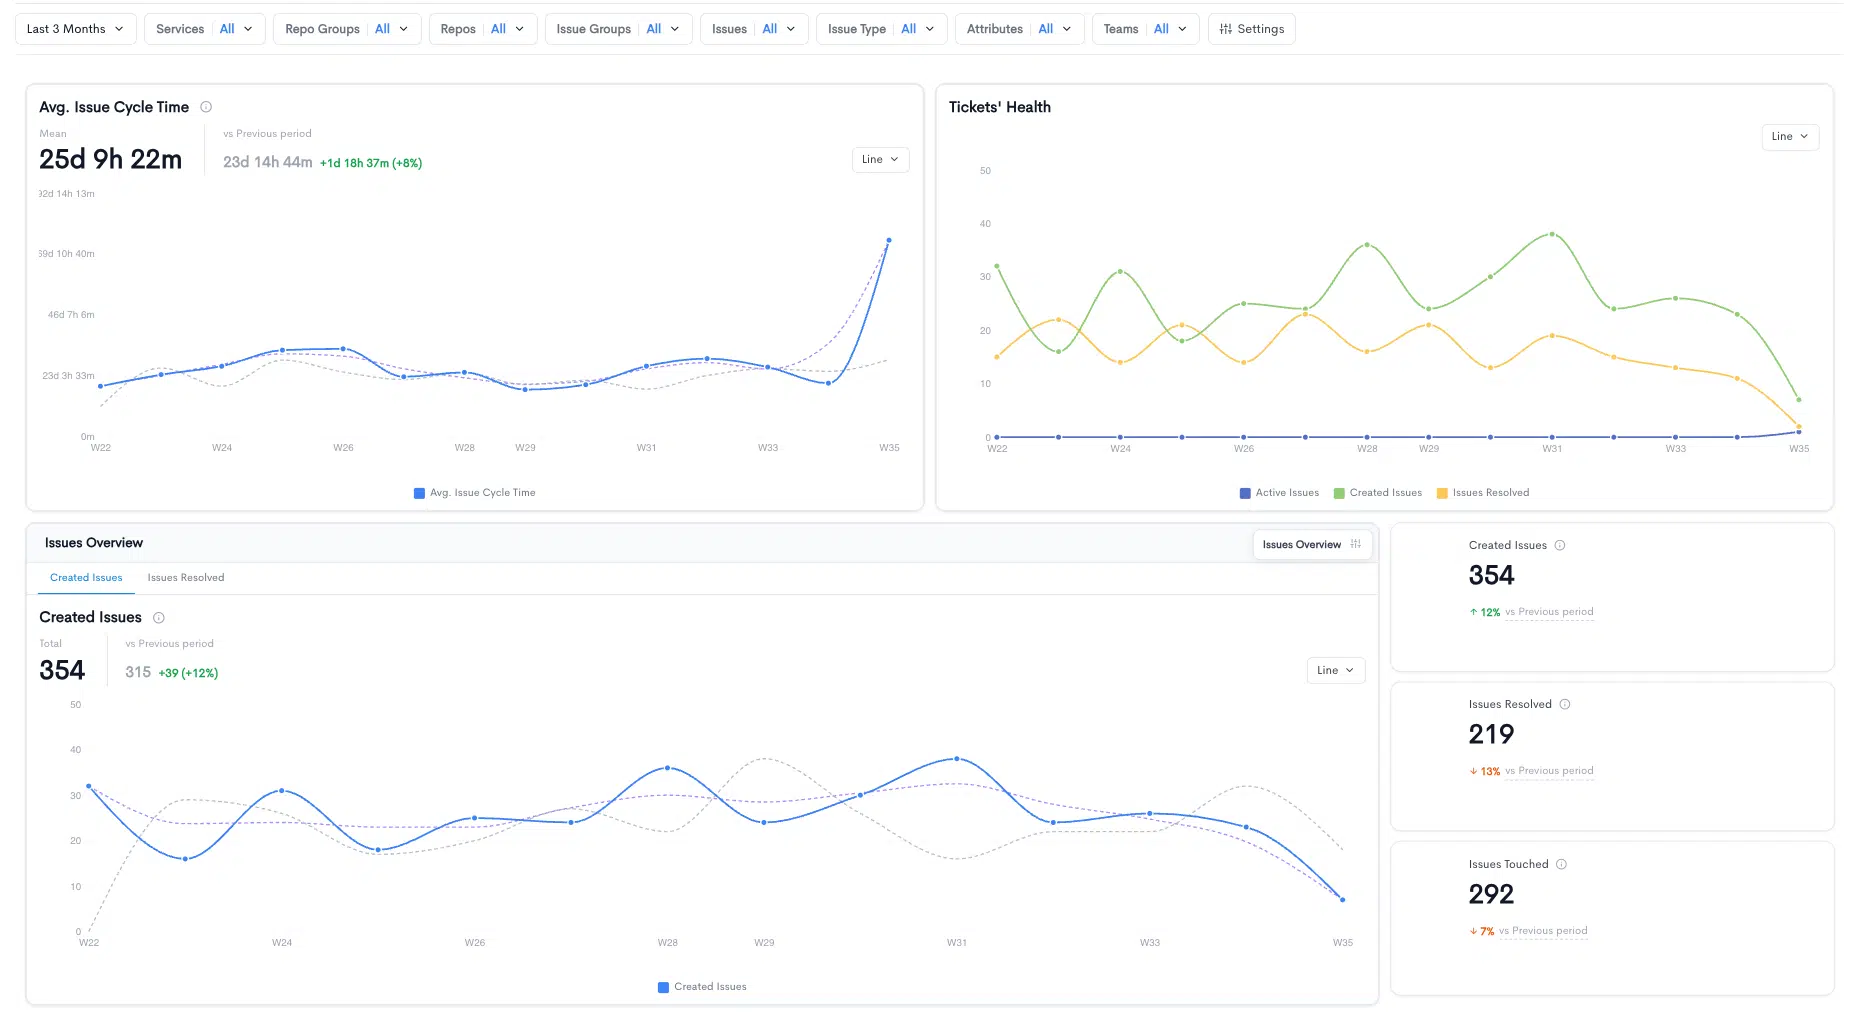
Leverage AI to forecast delivery timelines with greater accuracy and get a clear view of predicted outcomes with easy-to-read graphs, and understand what actions are needed to reach optimistic or realistic targets.
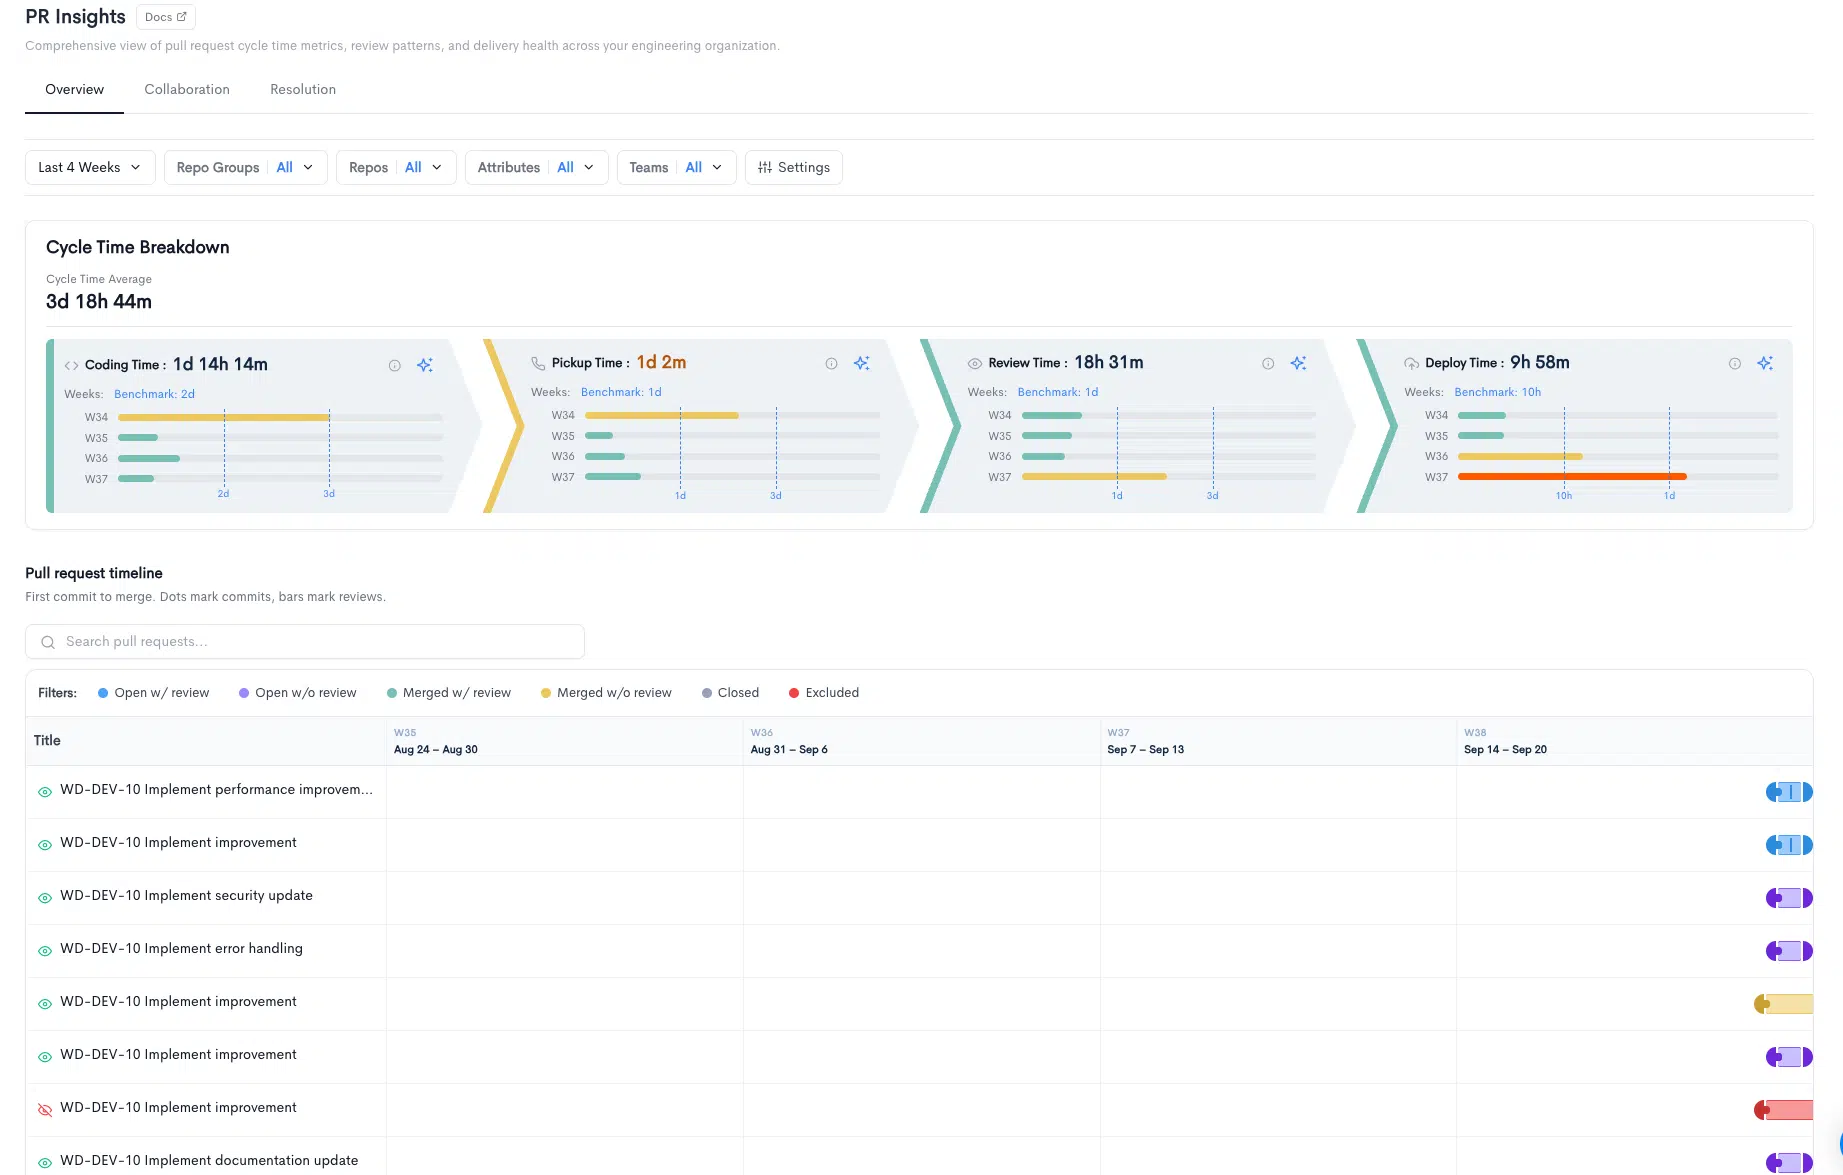
Increase delivery predictability by identifying risks early, setting clear targets, and staying ahead of blockers. With proactive notifications and real-time progress tracking, engineering leaders can course-correct before delays happen.
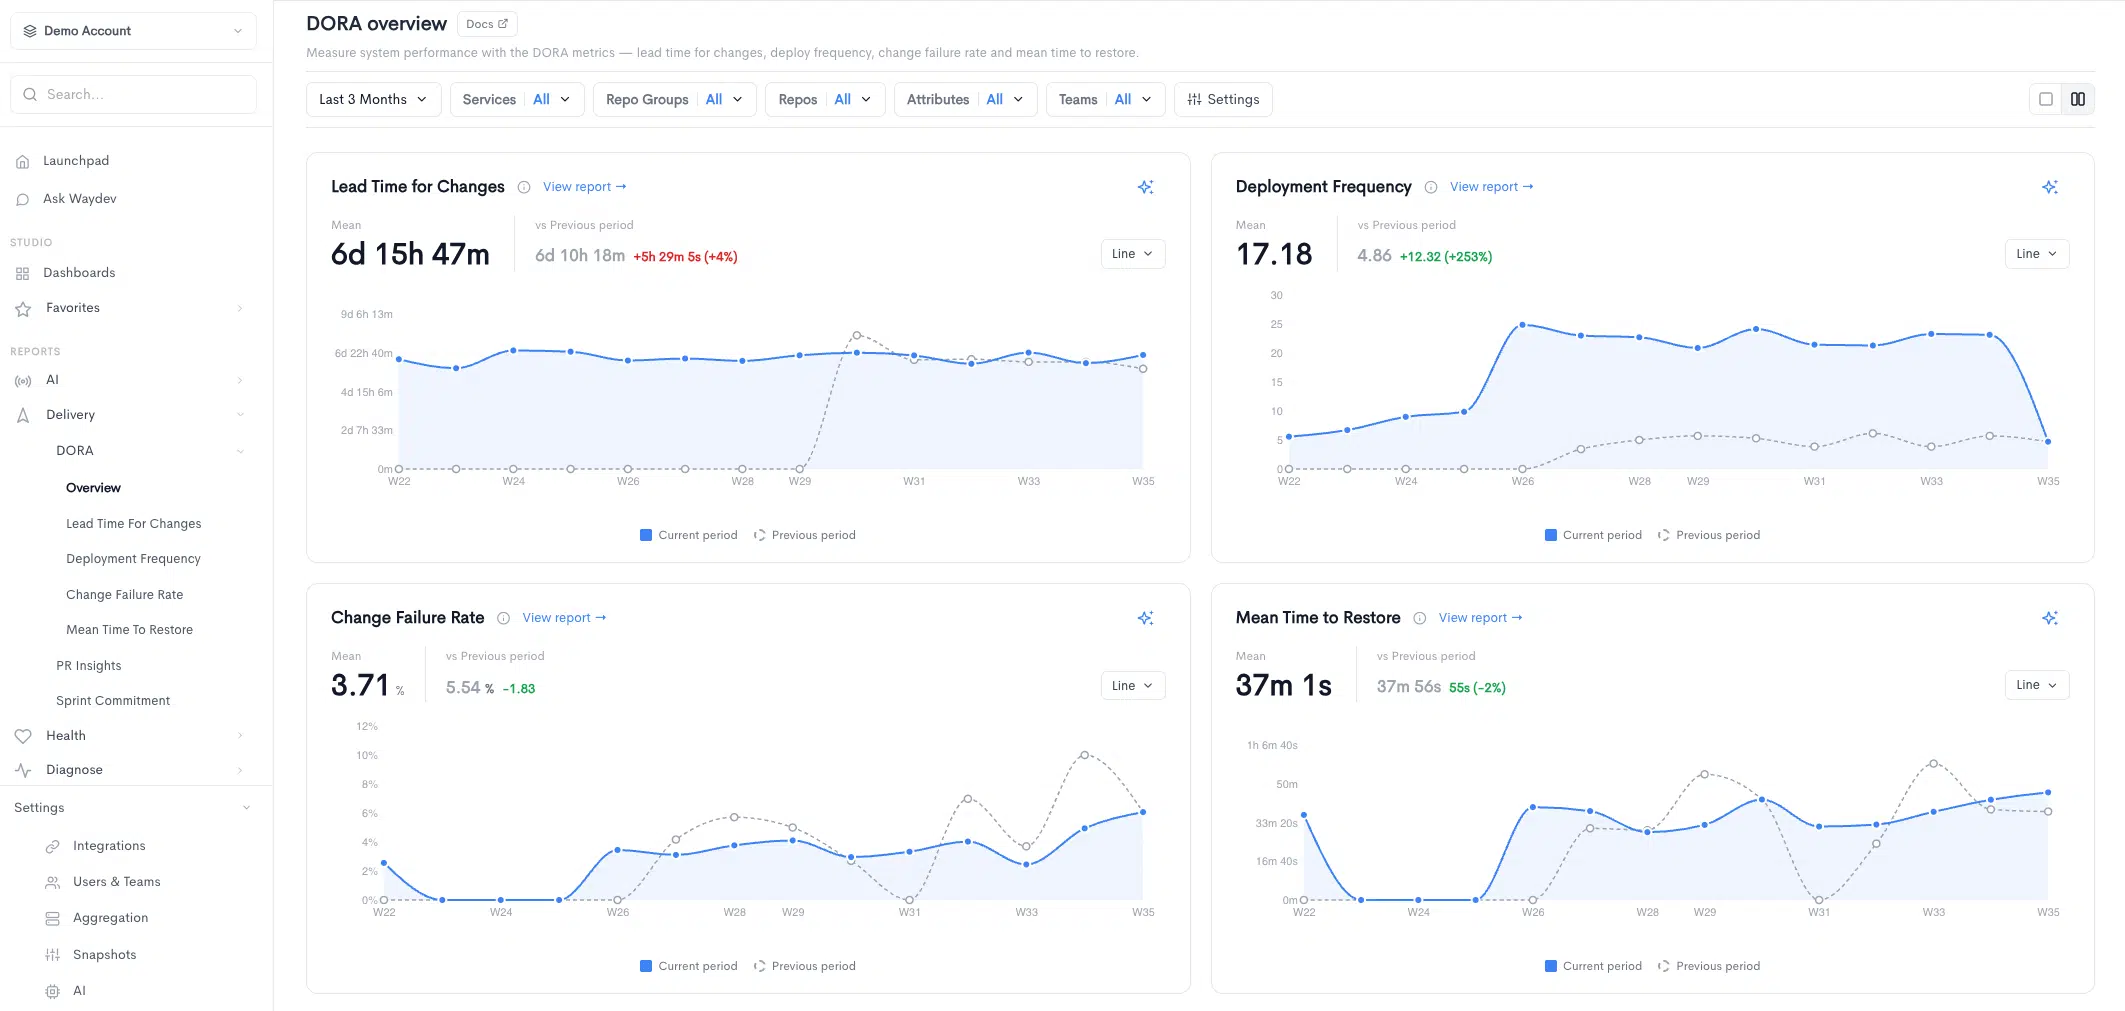
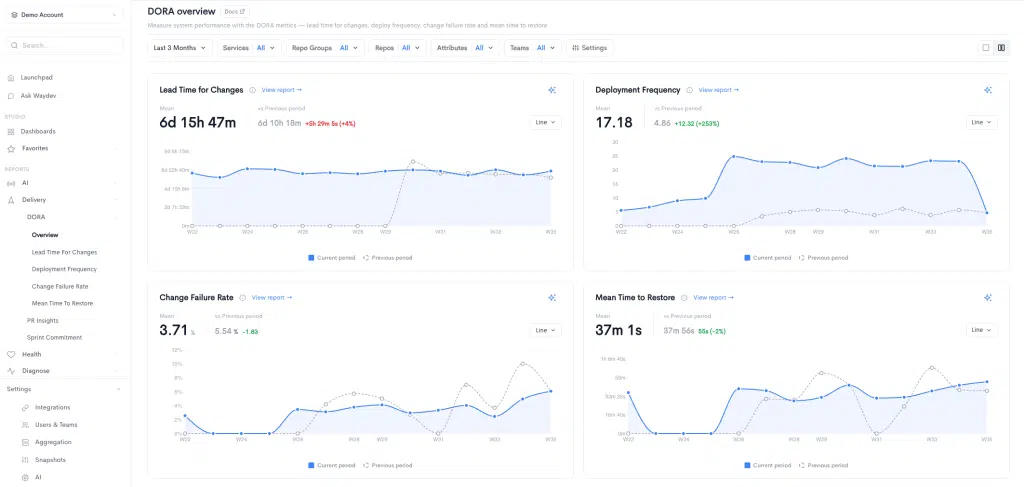
Track change lead time and deployment frequency alongside recovery and change-failure indicators. DORA’s current five-metric framework also includes deployment rework rate; verify which metrics your connected Waydev deployment supports and interpret them together.
Identify bottlenecks and shorten the time-to-market by measuring and optimizing cycle time. Use baseline cycle time, review waiting and rework trends to test improvements in your own environment. Results vary by team, workflow, and measurement period.
Predictability begins with a clear baseline for release flow, work-item aging and engineering constraints. Use Waydev metrics to discuss likely outcomes while keeping uncertainty visible.
Compare planned versus completed engineering work, code review waiting and cycle time for a representative period.
Use available predictions and realistic or optimistic target scenarios to investigate where work may diverge from the plan.
Compare forecasts with actual results across iterations. Improve assumptions when team scope, complexity or capacity changes.
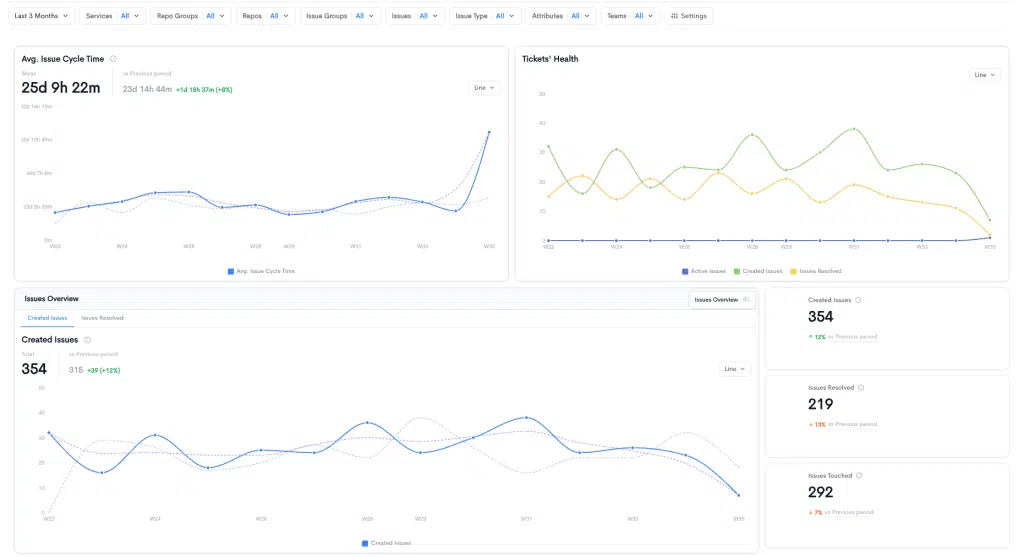
An engineering director sees slower review progress in a key initiative. The team evaluates an adjusted release plan using historic work patterns and checks the forecast against subsequent sprint outcomes.
Interpretation and limitations: Forecasts are estimates. The separate AI Predictability feature documentation notes external model use and warns that predictions can be wrong; private Waydev Brain deployment does not automatically imply every forecasting feature runs privately.
No. Predictions help evaluate scenarios and risks, but delivery dates remain subject to change.
No. Their documented model and deployment arrangements differ and should be reviewed individually.
Static, real product screenshots sourced exclusively from Waydev feature pages. Example interface data.
READY TO ADOPT A DEVELOPER PRODUCTIVITY INSIGHT PLATFORM?