




Understand the investment
Map engineering capacity and configured costs to product areas, initiatives and maintenance work.
Business Alignment
Optimize the balance between speed, cost, headcount, and impact to maximize engineering value and operational efficiency across the company.

Balance investment, delivery flow, rework and reliability when reviewing engineering economics.
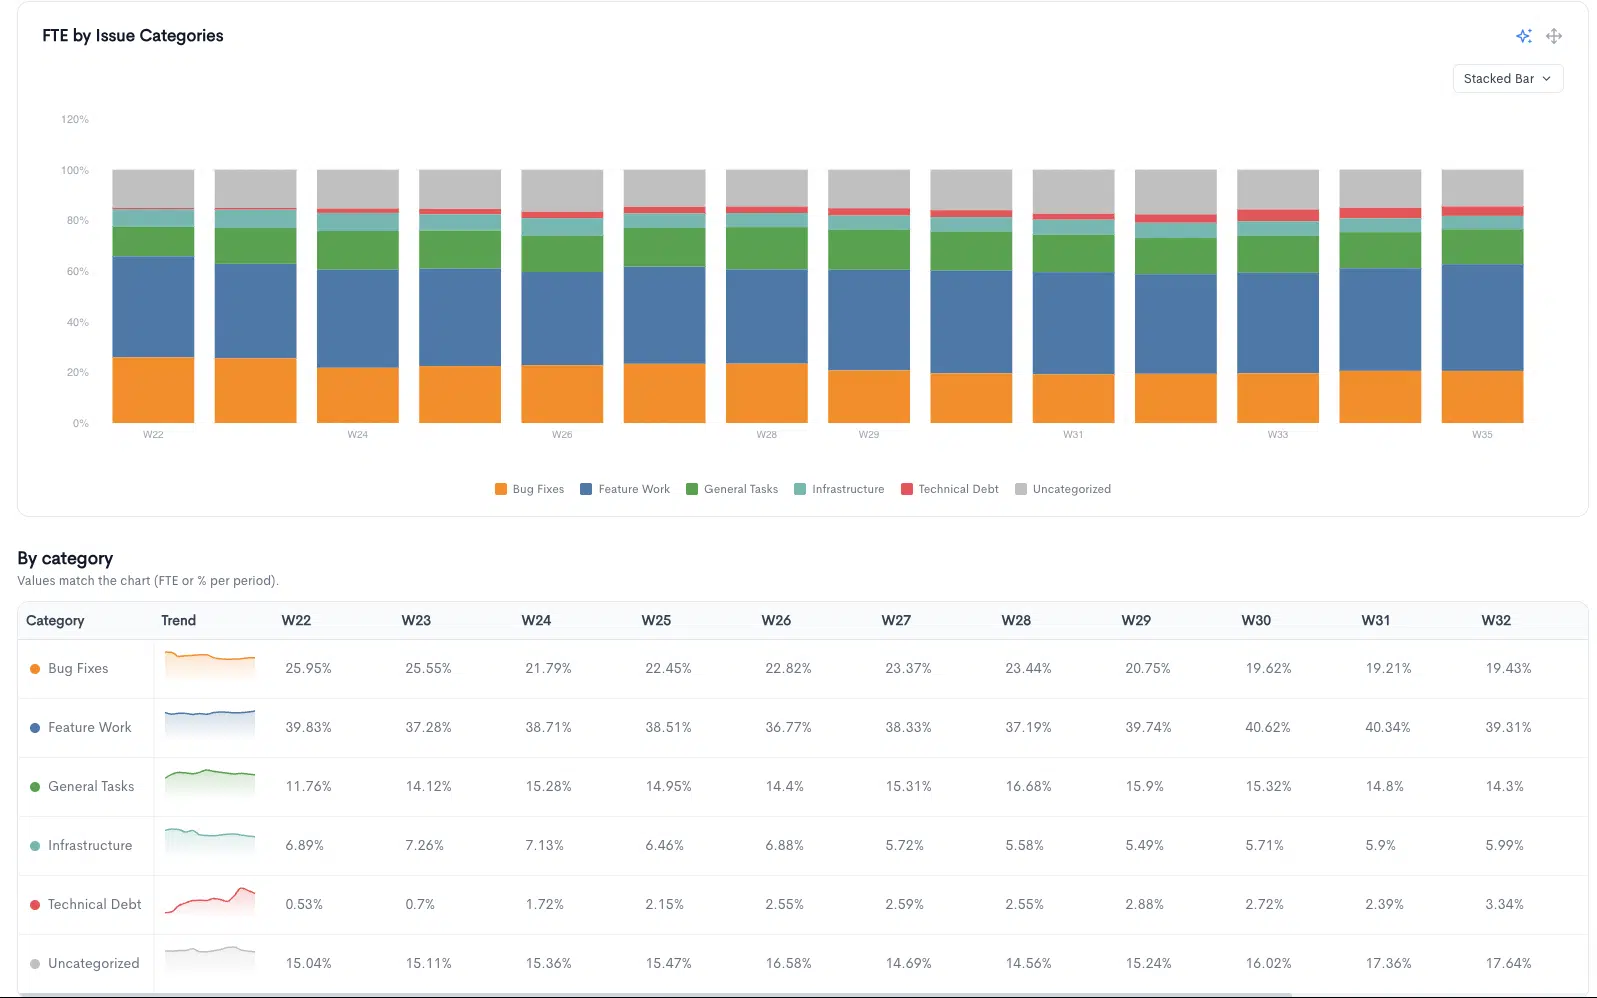
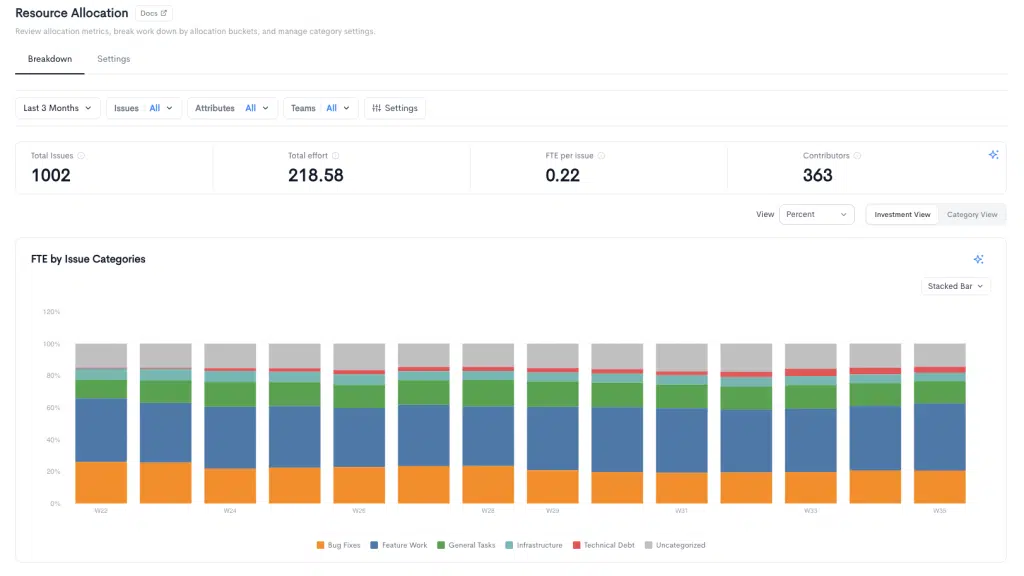
Visualize resource allocation across initiatives to focus efforts on what delivers impact. Focus on what matters most and enable informed conversations among stakeholders.
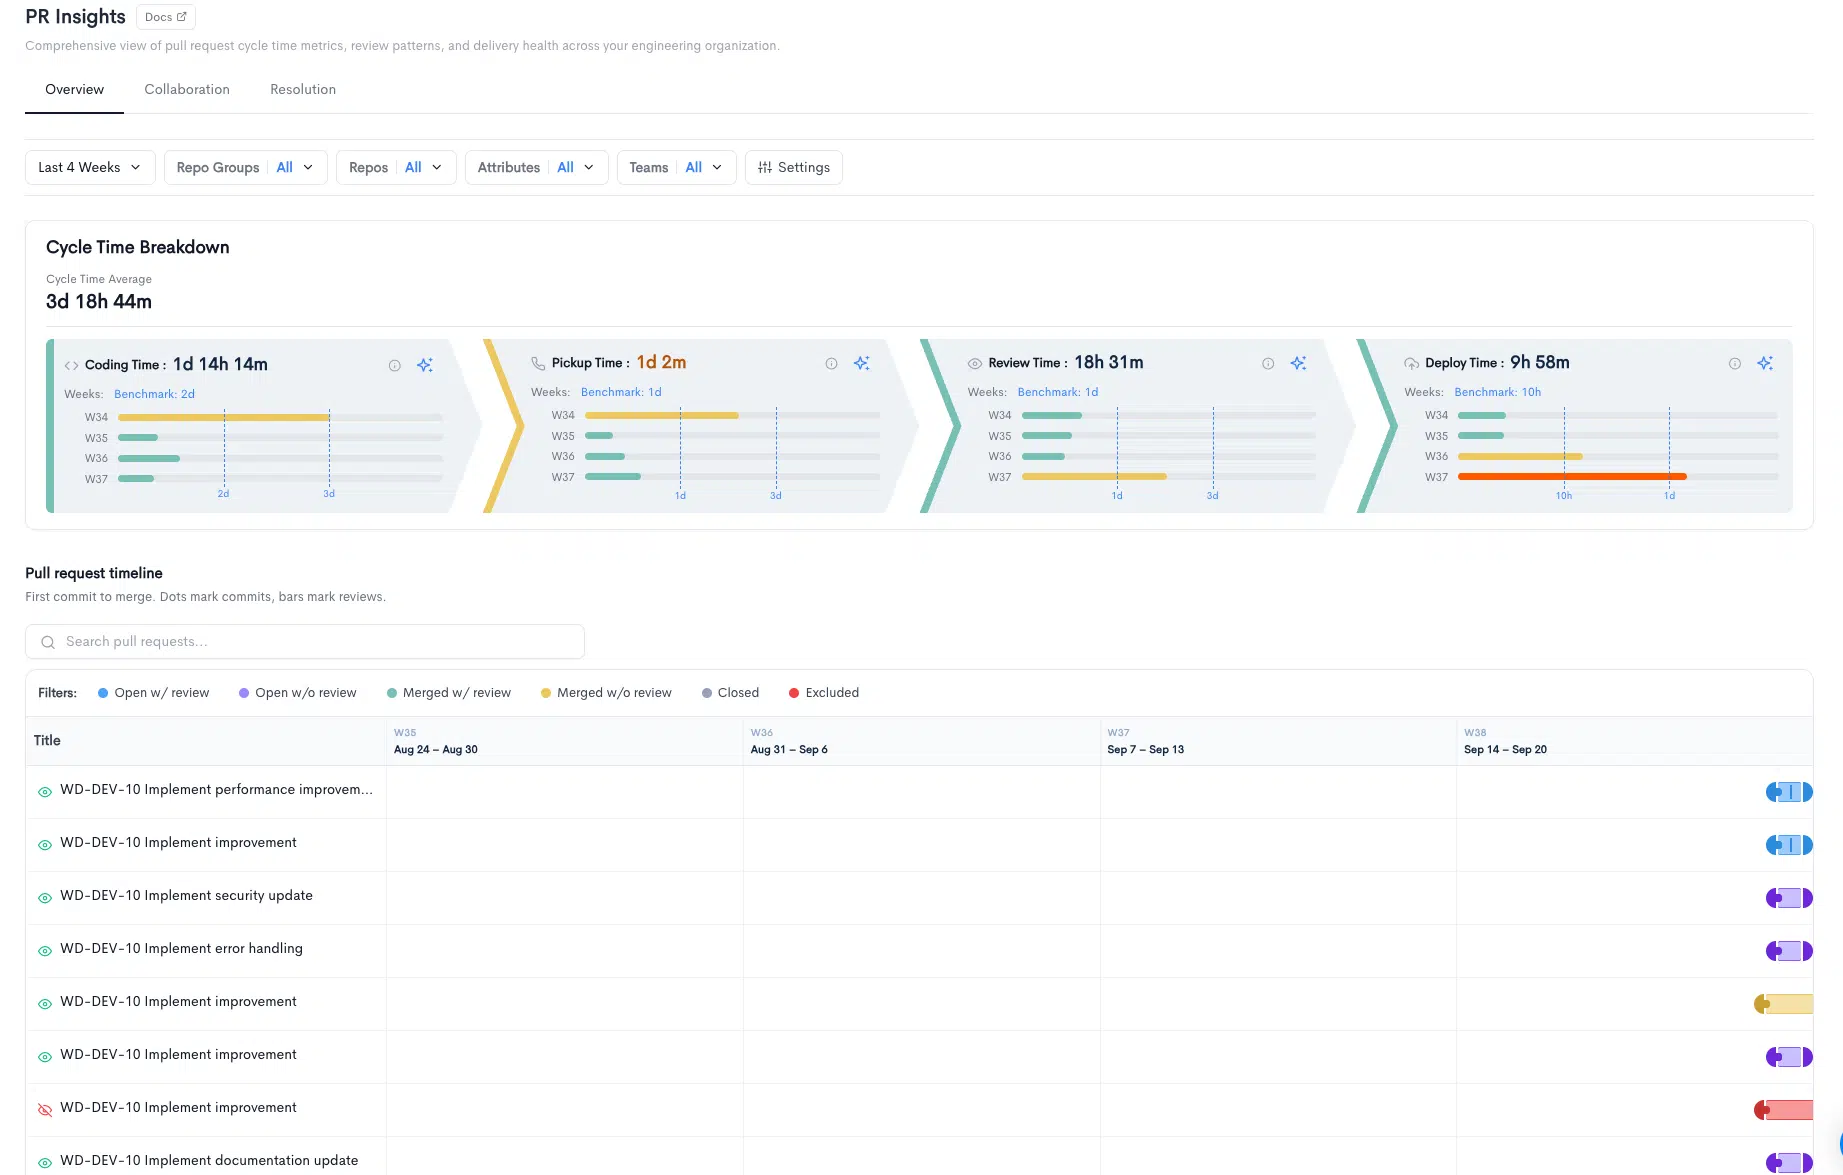
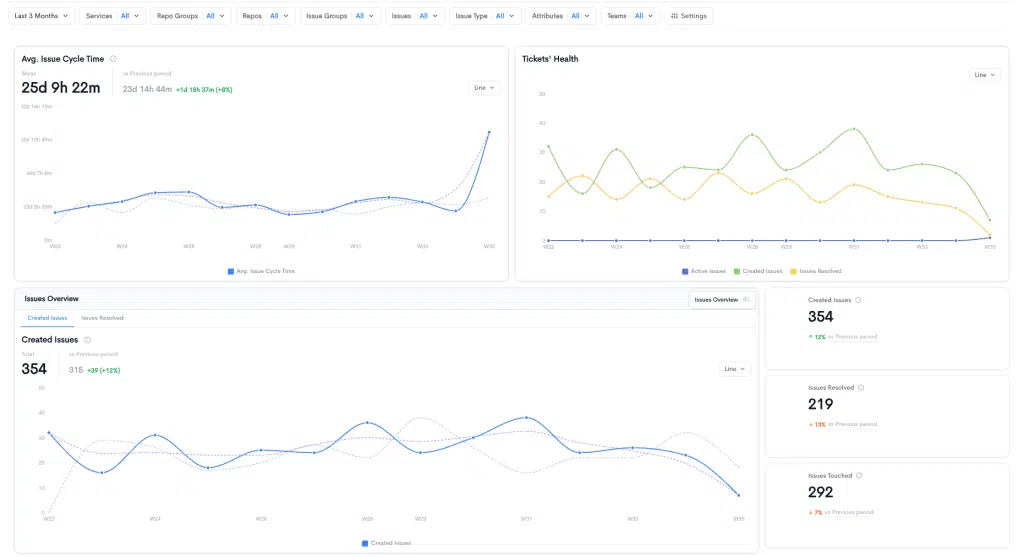
Use Cycle Time insights to optimize how work moves from the first commit to delivery. Identify delays across development stages and streamline execution to reduce costs, increase velocity, and deliver value faster—without compromising quality.
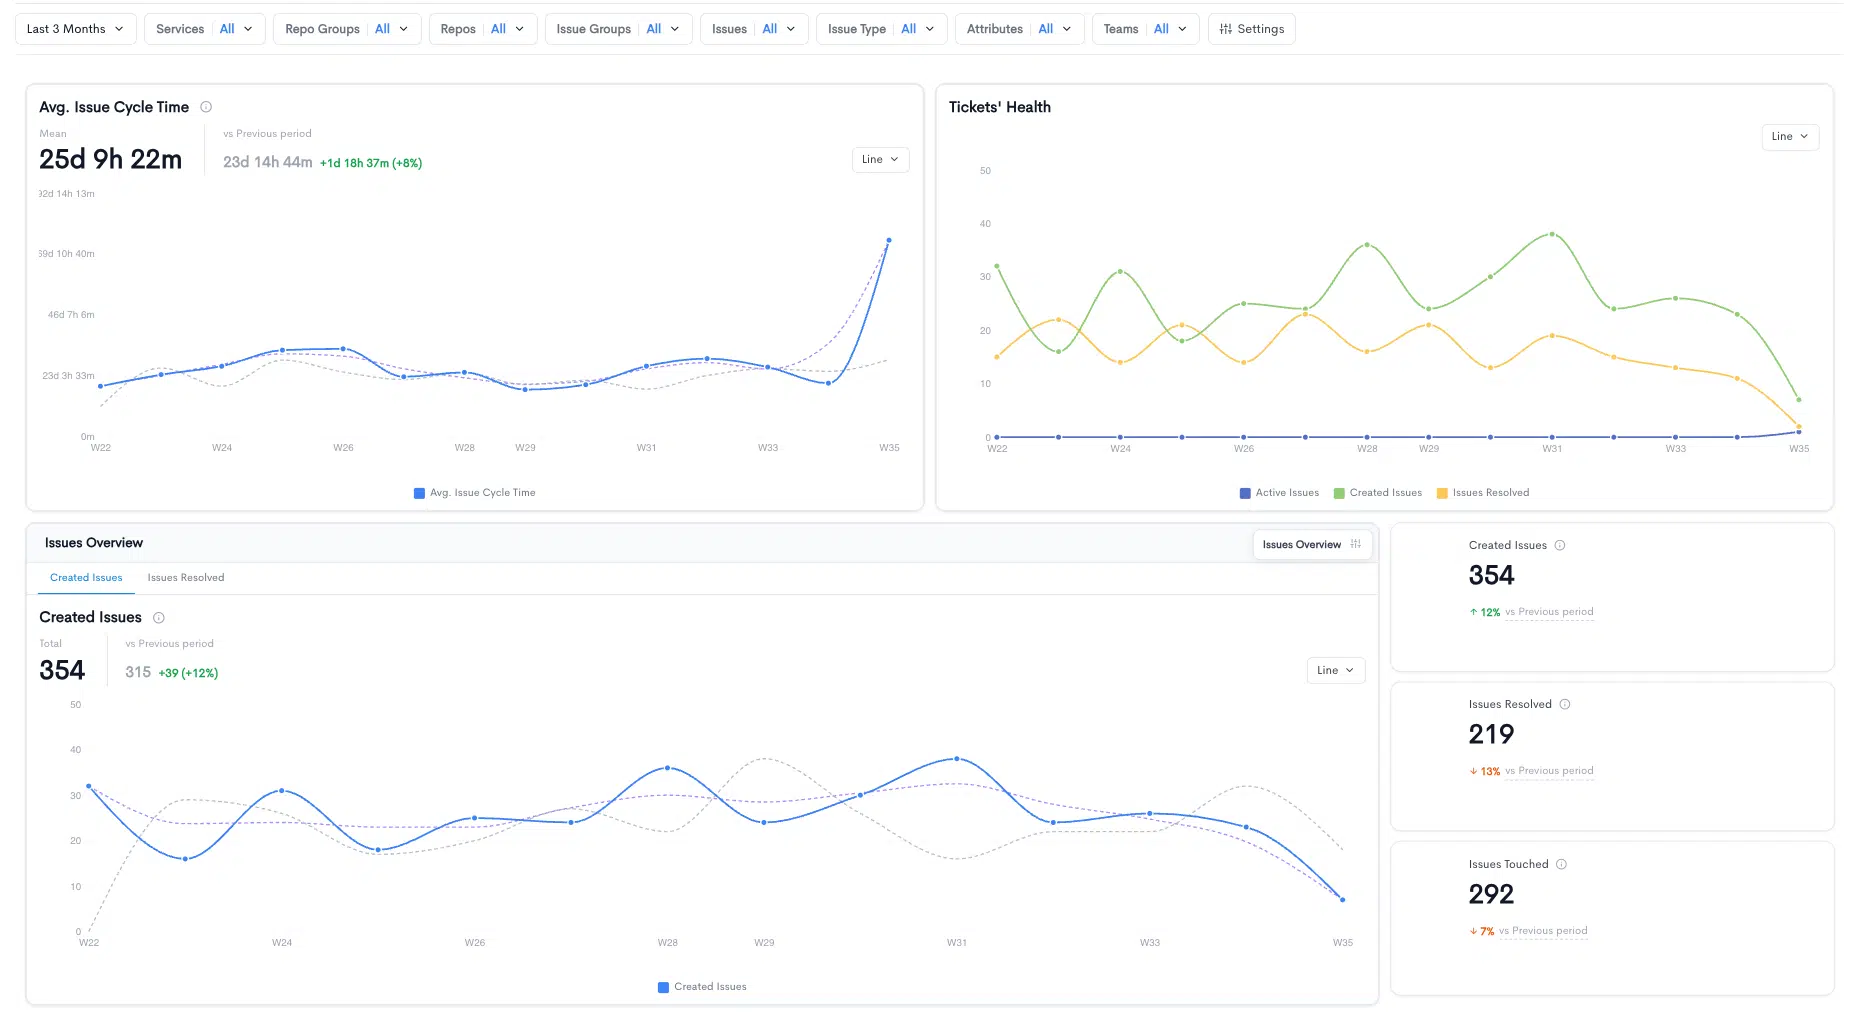
Leverage AI to forecast delivery timelines with greater accuracy, get a clear view of predicted outcomes with easy-to-read graphs, and understand what actions are needed to reach optimistic or realistic targets.
Profitable engineering is about delivering valuable outcomes at a sustainable cost. Combine investment allocation with work flow, reliability and change quality instead of assuming faster coding produces higher margins.
Map engineering capacity and configured costs to product areas, initiatives and maintenance work.
Review change quality, rework and cycle time alongside any apparent speed improvement.
Compare a proposed change in resource allocation against an agreed business objective, with indirect benefits distinguished from realized savings.
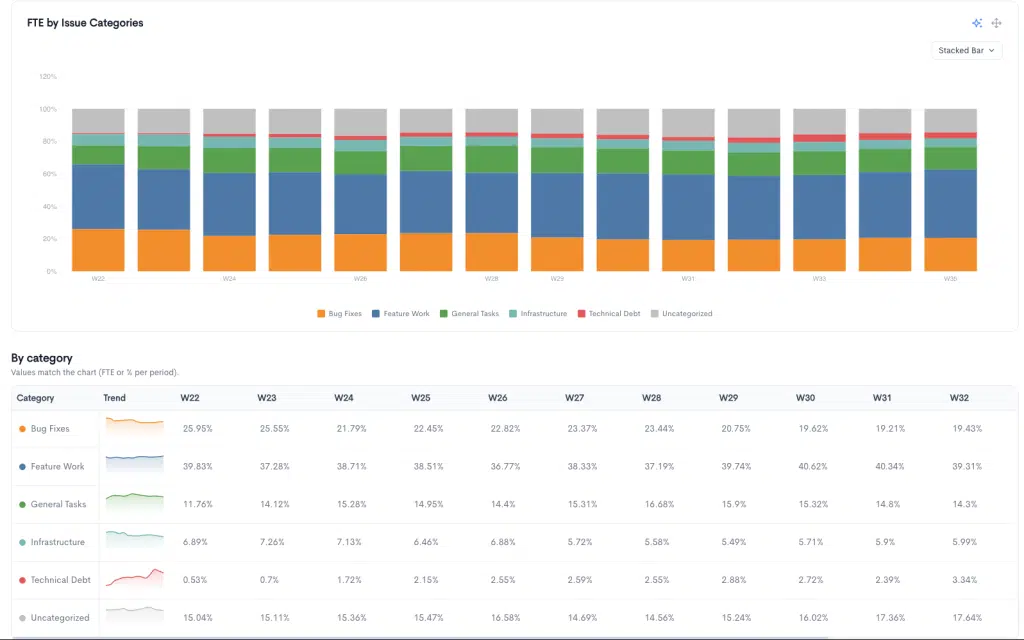
A product team considers shifting capacity from unplanned rework into reliability work. The plan is evaluated against incident impact and release predictability before making an ROI claim.
Interpretation and limitations: Profitability and gross margin depend on revenue, cost accounting and company operations outside Waydev’s engineering source data. Do not attribute margin expansion without financial validation.
No. Review labor cost, platform cost, rework and measurable business outcomes before drawing that conclusion.
Configured allocation and cost data can provide visibility into how software development effort is distributed.
Static, real product screenshots sourced exclusively from Waydev feature pages. Example interface data.
READY TO ADOPT A DEVELOPER PRODUCTIVITY INSIGHT PLATFORM?