Industry Research · AI ROI
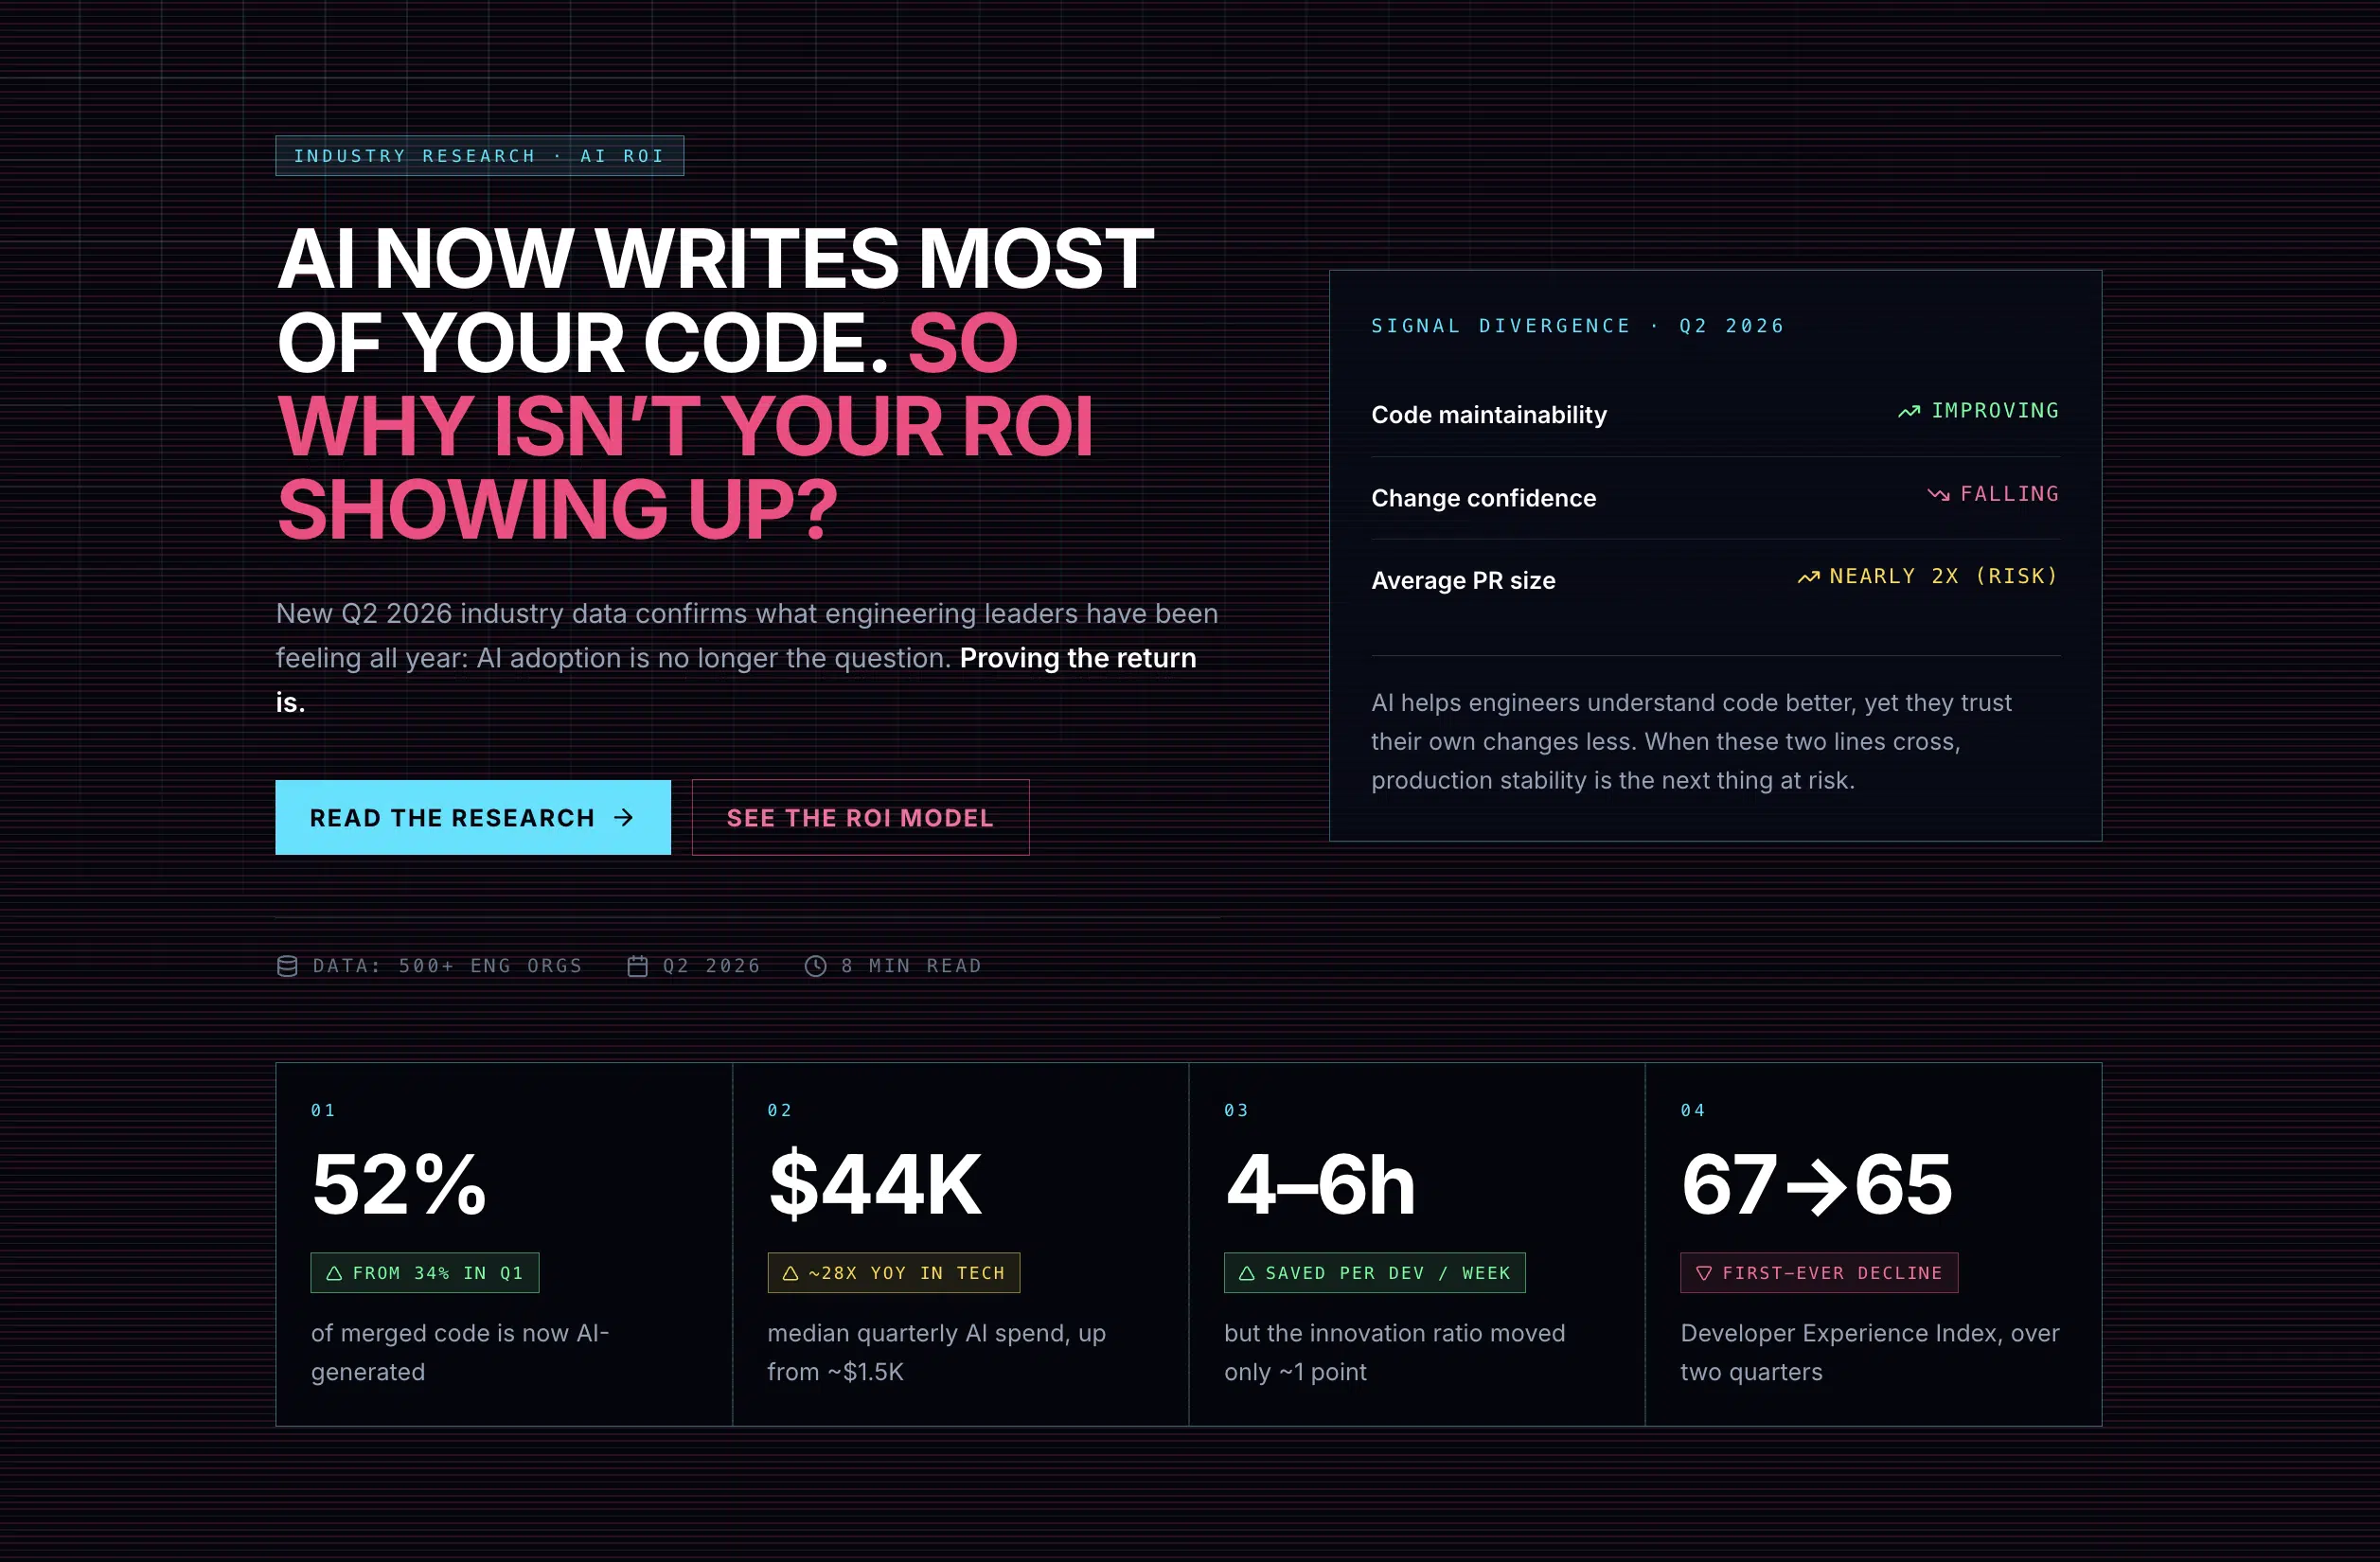
New Q2 2026 industry data confirms what engineering leaders have been feeling all year: AI adoption is no longer the question. Proving the return is. Here’s what the numbers say, and how the leaders we work with at Waydev are responding.
For the past two years, every AI conversation in engineering started with the same question: “Are your developers using it?” That question is now officially dead.
The latest State of AI Impact in Engineering research from DX, based on data from more than 500 engineering organizations, found that AI-generated code jumped from 34% of merged code in Q1 2026 to over 50% in Q2. Industry-wide adoption now exceeds 90%. Using AI is no longer a binary condition. It is the default state of software engineering.
It’s the same shift we’ve watched unfold across the Fortune 500 engineering organizations on Waydev. Twelve months ago, leaders asked us to measure adoption. Today they ask us to defend a budget line that grew by an order of magnitude. The Q2 data explains exactly why that conversation changed.
AI spend is exploding. Median quarterly AI spend rose from roughly $1,500 to $44,000, with the largest tech companies spending around 28 times what they did a year ago. This is no longer an experiment line item. It’s a budget category that CFOs are starting to interrogate, and in our experience, they interrogate it with a very specific question: show me what we got for it.
Time savings are real but capped. Developers report saving 4 to 6 hours per week with AI tools. That’s meaningful. But the innovation ratio, the share of engineering time going into new feature work, moved up by only about one percentage point. The hours saved are being absorbed by organizational friction: meetings, review queues, build waits, and environment toil.
Developer experience is declining for the first time. The aggregate Developer Experience Index slipped from 67 to 65 over two quarters, with incremental delivery, local iteration speed, and review turnaround all trending down. The first downward movement in the index happened during the biggest AI investment wave in history. That is not a coincidence. It’s a signal.
Quality signals are diverging. PR size nearly doubled, raising review and quality concerns. And in one of the most striking findings, two metrics that historically move together have split apart:
Signal divergence · Q2 2026
AI helps engineers understand code better, yet they trust their own changes less. When these two lines cross, production stability is the next thing at risk.
What the data describes is a pattern researchers now call the AI efficiency paradox: individual output surges, then piles up at human judgment gates. Reviews, approvals, validation, and remediation absorb the gains before they ever reach the roadmap.
One case study in the research makes this brutally clear. A team that reduced unnecessary meetings achieved roughly twice the PR throughput gains that AI tooling alone delivered. Read that again. Fixing the surrounding system outperformed the AI investment itself.
You’ve paid enterprise prices to accelerate 16% of the workflow while the other 84% quietly eats the savings.
This matches what we see in Waydev data every day. AI makes the coding portion of the job faster, but coding is only a fraction of a developer’s week. When customers like American Express-scale organizations map their full delivery pipeline in Waydev, the bottleneck almost never sits where the AI budget went. It sits in review queues, in build waits, in handoffs. That’s why our platform measures the pipeline around the code, not just the code itself.
The most important shift in this research isn’t any single metric. It’s the framing. The industry has moved from “what happens after AI adoption” to “is this paying off.” With adoption above 90%, there’s no longer a control group of non-users to compare against. The old measurement playbook is obsolete.
That leaves engineering leaders in a difficult spot. You’re being asked to justify AI budgets that grew 28x, using metrics that were designed to measure adoption, not return. Lines of AI-generated code won’t survive a CFO conversation. Neither will time-savings surveys on their own.
What survives that conversation is an auditable chain from investment to outcome. It’s the chain we rebuilt Waydev around when we relaunched as an AI-native platform this year:
If you can’t connect those four layers with real data, you’re not measuring AI ROI. You’re estimating it. And in regulated industries, the banks and insurers we work with will tell you: estimating it isn’t just risky. It’s an audit finding waiting to happen.
The question isn’t how many developers use AI. It’s where the saved hours went. Track your innovation ratio and delivery mix over time. If AI savings aren’t showing up in new feature work, find the friction that’s absorbing them. In Waydev, this is the gap between AI time savings and downstream delivery output, visible per team.
With PR sizes doubling and change confidence falling, review is where AI-era quality risk concentrates. Measure review turnaround, PR size distribution, and post-merge defect signals as first-class metrics, not afterthoughts.
Per-team cost visibility, benchmarks against industry peers, and the ability to show which investments produced measurable impact and which didn’t. If a tool’s cost curve is 28x steeper than its impact curve, you want to know in Q2, not at renewal.
The Q2 2026 data confirms a transition we built Waydev’s relaunch around: the AI adoption era is over, and the AI accountability era has begun. Code output is up. Spend is up dramatically. But developer experience is down, quality signals are mixed, and innovation output is nearly flat.
The organizations that win the next phase won’t be the ones with the most AI tools. They’ll be the ones that can prove, with auditable data, exactly what those tools returned, and that can find and fix the systemic friction absorbing the gains.
Waydev gives engineering leaders an auditable view of AI adoption, impact, cost, and ROI across the entire delivery pipeline. Benchmark your organization against the industry.
Book a demoSource: DX, State of AI Impact in Engineering, Q2 2026, based on data from 500+ engineering organizations. Analysis and commentary by Waydev.
Ready to unlock your SDLC productivity?