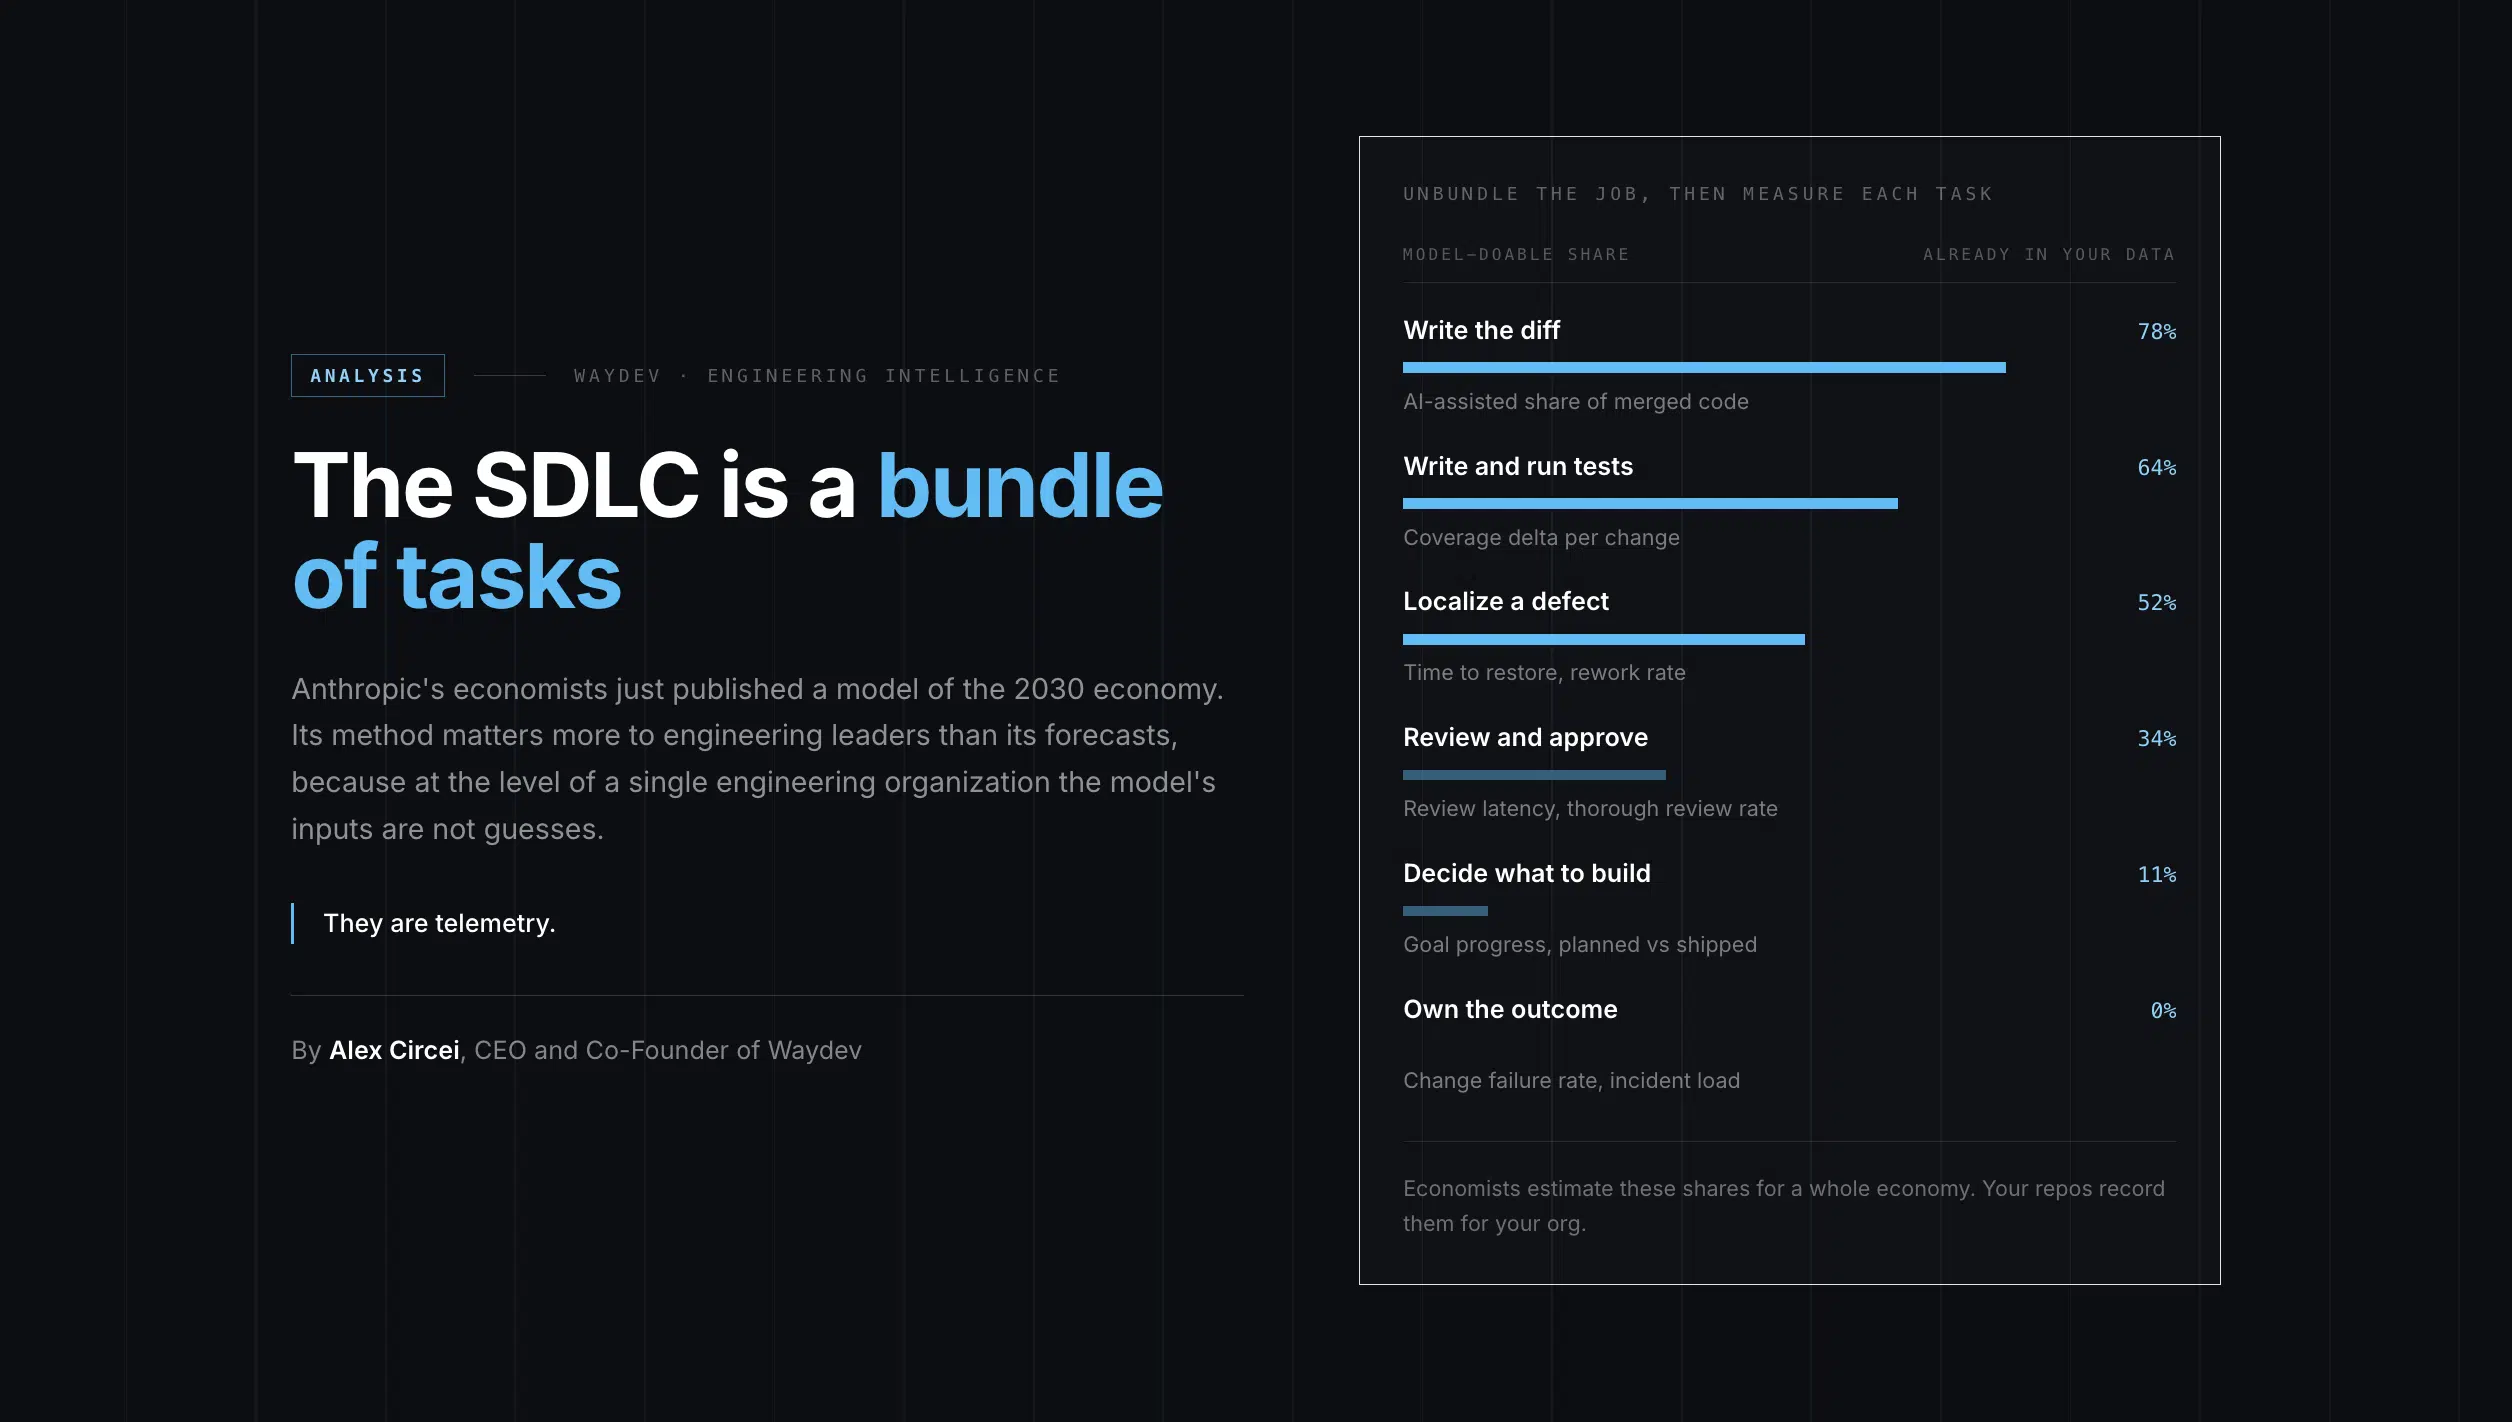
Anthropic’s economists just published a model of the 2030 economy. Its method matters more to engineering leaders than its forecasts, because at the level of a single engineering organization the model’s inputs are not guesses. They are telemetry.
Anthropic’s Economics team released a scenario explorer this month, Scenarios for our Economic Future, built on a technical report by Korinek, Jones, Sacher, Cotter and McCrory. It models what the US economy might look like in 2030 under different assumptions about how capable AI becomes and how widely it gets used.
The macro numbers are worth reading. The modeling method is worth copying.
The model’s central abstraction is that the economy is not made of jobs. It is made of tasks, and jobs are bundles of them. Anthropic works the example through a nurse. She does rounds, draws blood, triages patients, charts vitals, orders supplies. AI cannot bathe a patient. It can help draft discharge instructions. It can take over charting and supply ordering outright. And it creates tasks that did not previously exist, like checking how well an AI triages patients or reviewing an AI-proposed care plan.
Four buckets: unchanged, augmented, automated, newly created. The job changes as the composition of the bundle changes, and the bundle was never static. Nobody hand-writes paper charts anymore. Nobody monitored patients remotely thirty years ago.
Software engineering decomposes the same way, and more cleanly than most occupations, because almost every task leaves a timestamped artifact behind.
Figure 1. A working decomposition of the SDLC into Anthropic’s four task categories. The exact placement is arguable and will differ by codebase. That argument is the useful part of the exercise.
Negotiating scope with a difficult stakeholder. Deciding what not to build. Owning a Sev1 in front of a customer. Judging whether an architecture survives two more years of business model change. Convincing a skeptical staff engineer.
First-draft implementation. Reading unfamiliar code. Test writing. Migrations and refactors. Incident triage and log analysis. Documentation. Code review, where AI does the first pass and the human does the judgment pass.
Boilerplate and scaffolding. Dependency bumps and lint remediation. Test generation for well-specified units. Changelogs and release notes. Routine schema and API client updates. Ticket triage and labeling.
Writing and maintaining agent instructions and skill definitions. Building evals for AI output. Reviewing pull requests no human wrote. Managing context and tool access. Verification and provenance of machine-authored code. Cost governance across model spend.
That last bucket decides whether an engineering org shrinks or reshapes. Anthropic makes the point sharply: in the extreme scenario, AI creates essentially no new knowledge tasks for people, and that absence is a large part of why the outcome is severe. Every new task category your organization creates is a place where human judgment still compounds.
Figure 2. US GDP in 2030 by scenario, measured against the counterfactual economy without AI, at 2025 price levels. Bars show the uplift, not total output.
| Modest | Substantial | Extreme | |
|---|---|---|---|
| Macro shape | Impact comparable to the internet, gradual and inside historical norms | Growth at twice the normal rate | 15% annual growth, economy doubles every 4.5 years |
| AI capability | Assistive on narrow tasks | Capable of half of all knowledge work, most of it autonomously | More productive than humans on the vast majority of knowledge work |
| Inside your org | Completion and test generation. Cycle time improves at the margins. | Two orgs with identical model access produce very different output. The delta is diffusion. | Engineering reorganizes around specification, verification and accountability. |
| Headcount signal | Plans unchanged | Composition shifts faster than totals | Headcount curve breaks from the output curve |
| Knowledge-work wages | Broadly flat | Essentially flat while other occupations gain | Down more than 10% by 2030, unemployment past recessionary levels |
The substantial scenario is the one to sit with, because it contains the sentence that should reorganize your quarter: AI is capable of doing half of all knowledge work by 2030, and most knowledge work is still done without it.
The binding constraint in 2030 is not what the models can do. It is what your organization has actually rewired.
Anthropic surveyed more than 10,000 Americans in August. The typical respondent’s answers imply something close to the substantial scenario: GDP about 10% higher by 2030, unemployment around 5%. Roughly one in ten hold views consistent with the extreme scenario.
What the survey asked about is the useful part. Five variables: what tasks AI can do, how much people use it, how much it does by itself, how much more productive it makes people, and how long displaced workers take to find new work. At national scale those have to be surveyed. At the scale of one engineering organization, four of the five can be measured.
Figure 3. The substantial scenario assumes capability outruns use. Schematic, not measured. The endpoint on the capability curve is Anthropic’s assumption of half of all knowledge work by 2030.
Figure 4. Anthropic’s five survey variables, reframed as an instrument panel for a single engineering organization. Needle positions are illustrative of the common pattern, where capability sits well ahead of adoption and autonomy.
Your evaluation surface. Which task categories has AI actually cleared in your codebase, against your standards, rather than against a public benchmark?
Diffusion. What share of eligible work in each task category actually ran through AI last month? This is almost always lower than leadership believes. The distance between seats purchased and tasks changed is where most AI budgets quietly disappear.
The ratio of supervised to unsupervised work. What fraction of AI-touched changes shipped without a human editing the output? Moving that number from 5% to 40% is a different company, not a better-tooled version of the same one.
The multiplier, and the one most often mismeasured. Output volume is not productivity if rework, review burden and defect escape rates climb alongside it. Throughput gains that arrive as incident volume six weeks later were never gains.
In the macro model this is how long displaced workers take to find work. Inside a company it becomes reskilling velocity: how fast an engineer whose primary task bundle just got automated can move into the newly created one. Almost nobody instruments this, and it is the variable that separates a reshaped org from a shrinking one.
Figure 5. Autonomy is a ladder, not a switch. Most organizations report steps one and two as if they were step three.
The model’s fourth finding is that the pie grows while a larger share of it goes to capital. Today about 60 cents of every dollar the economy produces goes to workers. That share slips in every scenario, and it does not slip gently in the extreme one.
Figure 6. Labour share of GDP in 2030 by scenario. Average wages still rise in all three, but the composition of who receives the growth changes materially.
The same split now exists in an engineering budget, where capital means model spend, agent infrastructure, eval harnesses and tooling, and labour means salaries. Most engineering organizations have never had to think about the ratio, because compute was a rounding error against payroll. That is over. What fraction of your engineering capacity you buy versus employ is a live allocation decision with a real trend line, and very few teams can currently produce that number, let alone defend it in a board meeting.
Anthropic finds that average wages rise while knowledge-worker wages stagnate or fall. The internal analogue is a seniority curve that steepens.
Figure 7. Illustrative. The tasks that constituted a junior engineer’s first two years are the tasks most exposed to automation, while the newly created tasks presuppose the judgment those two years used to build.
If you automate the training ground without replacing it, you buy a short-term productivity gain and a medium-term pipeline problem. That tradeoff is a choice, and in most organizations it is currently being made by default.
Anthropic’s own reviewers disagreed with it in both directions. Several argued the extreme case reads better as a thought experiment than a scenario. Others argued the modest case understates what is already visible in the data. The model excludes policy responses, business cycles, aggregate demand effects from the data centre buildout, and hyper-capable robotics. It does not follow individual workers, so it can only paint a coarse picture of displacement cost. It is version 1.0, and it is a tool for structured thinking rather than a forecast. Treat the internal version the same way.
Anthropic closes by saying the future is not predetermined, that it depends on what AI can do and on how companies and workers choose to adopt it. At the scale of a national economy that is a statement about policy and about diffusion across millions of firms.
At the scale of one engineering organization it is a statement about you. The capability curve is set elsewhere. Adoption, autonomy, how productivity gets measured, and whether new human work gets created are decisions your organization makes, mostly implicitly, mostly this quarter. Which of the three scenarios you end up living in is, internally, substantially a choice.
Source: Scenarios for our Economic Future, Anthropic Economic Futures, version 1.0, September 2026, based on the technical report Economic Scenarios for Transformative AI (Korinek, Jones, Sacher, Cotter and McCrory, 2026). Figures 1, 3, 4, 5 and 7 are our own interpretation applied to engineering organizations and are not part of Anthropic’s model. Figures 2 and 6 restate published model outputs.
Ready to unlock your SDLC productivity?