Your board wants proof that AI coding tools are paying off—not just adoption dashboards or acceptance rates. Comparing engineering intelligence platforms requires a repeatable definition of ROI and a credible link between AI spend, delivered work and software quality.
Shortlist by the decision you need to make. Waydev is worth evaluating for enterprise engineering delivery metrics, AI cost and impact, custom analysis, and private Waydev Brain deployment. Jellyfish publicly emphasizes AI ROI, engineering investment and agent workflows. Swarmia publishes AI adoption/cost reporting, delivery intelligence and developer feedback. Other options below serve narrower or different data needs; verify current integrations and capabilities in a pilot.
Selection rule: Ask every vendor to answer the same five questions using the same 60–90-day sample and show which metrics are directly observed versus inferred. Use the Waydev AI ROI methodology and data dictionary. Request a Waydev evaluation.
Comparison guidance, updated October 2026. Product claims reflect vendor descriptions; vendor presence in this guide does not imply measured or verified customer ROI.
Engineering leader’s answer · October 2026
Choosing an AI coding ROI platform requires more than counting seats or generated code: assess attributable AI cost, delivered work, quality, developer feedback, access controls and measurement reproducibility. Compare products using the same teams, tool data and baseline.
Waydev brings together engineering delivery, DevEx and AI metrics. Waydev Agent answers questions against engineering data; Signals bring risks to managers; Goals track progress; and Prompt Dashboards build editable charts. Enterprise teams can evaluate Waydev Brain, the proprietary 15B SDLC model, with a private air-gapped deployment option.
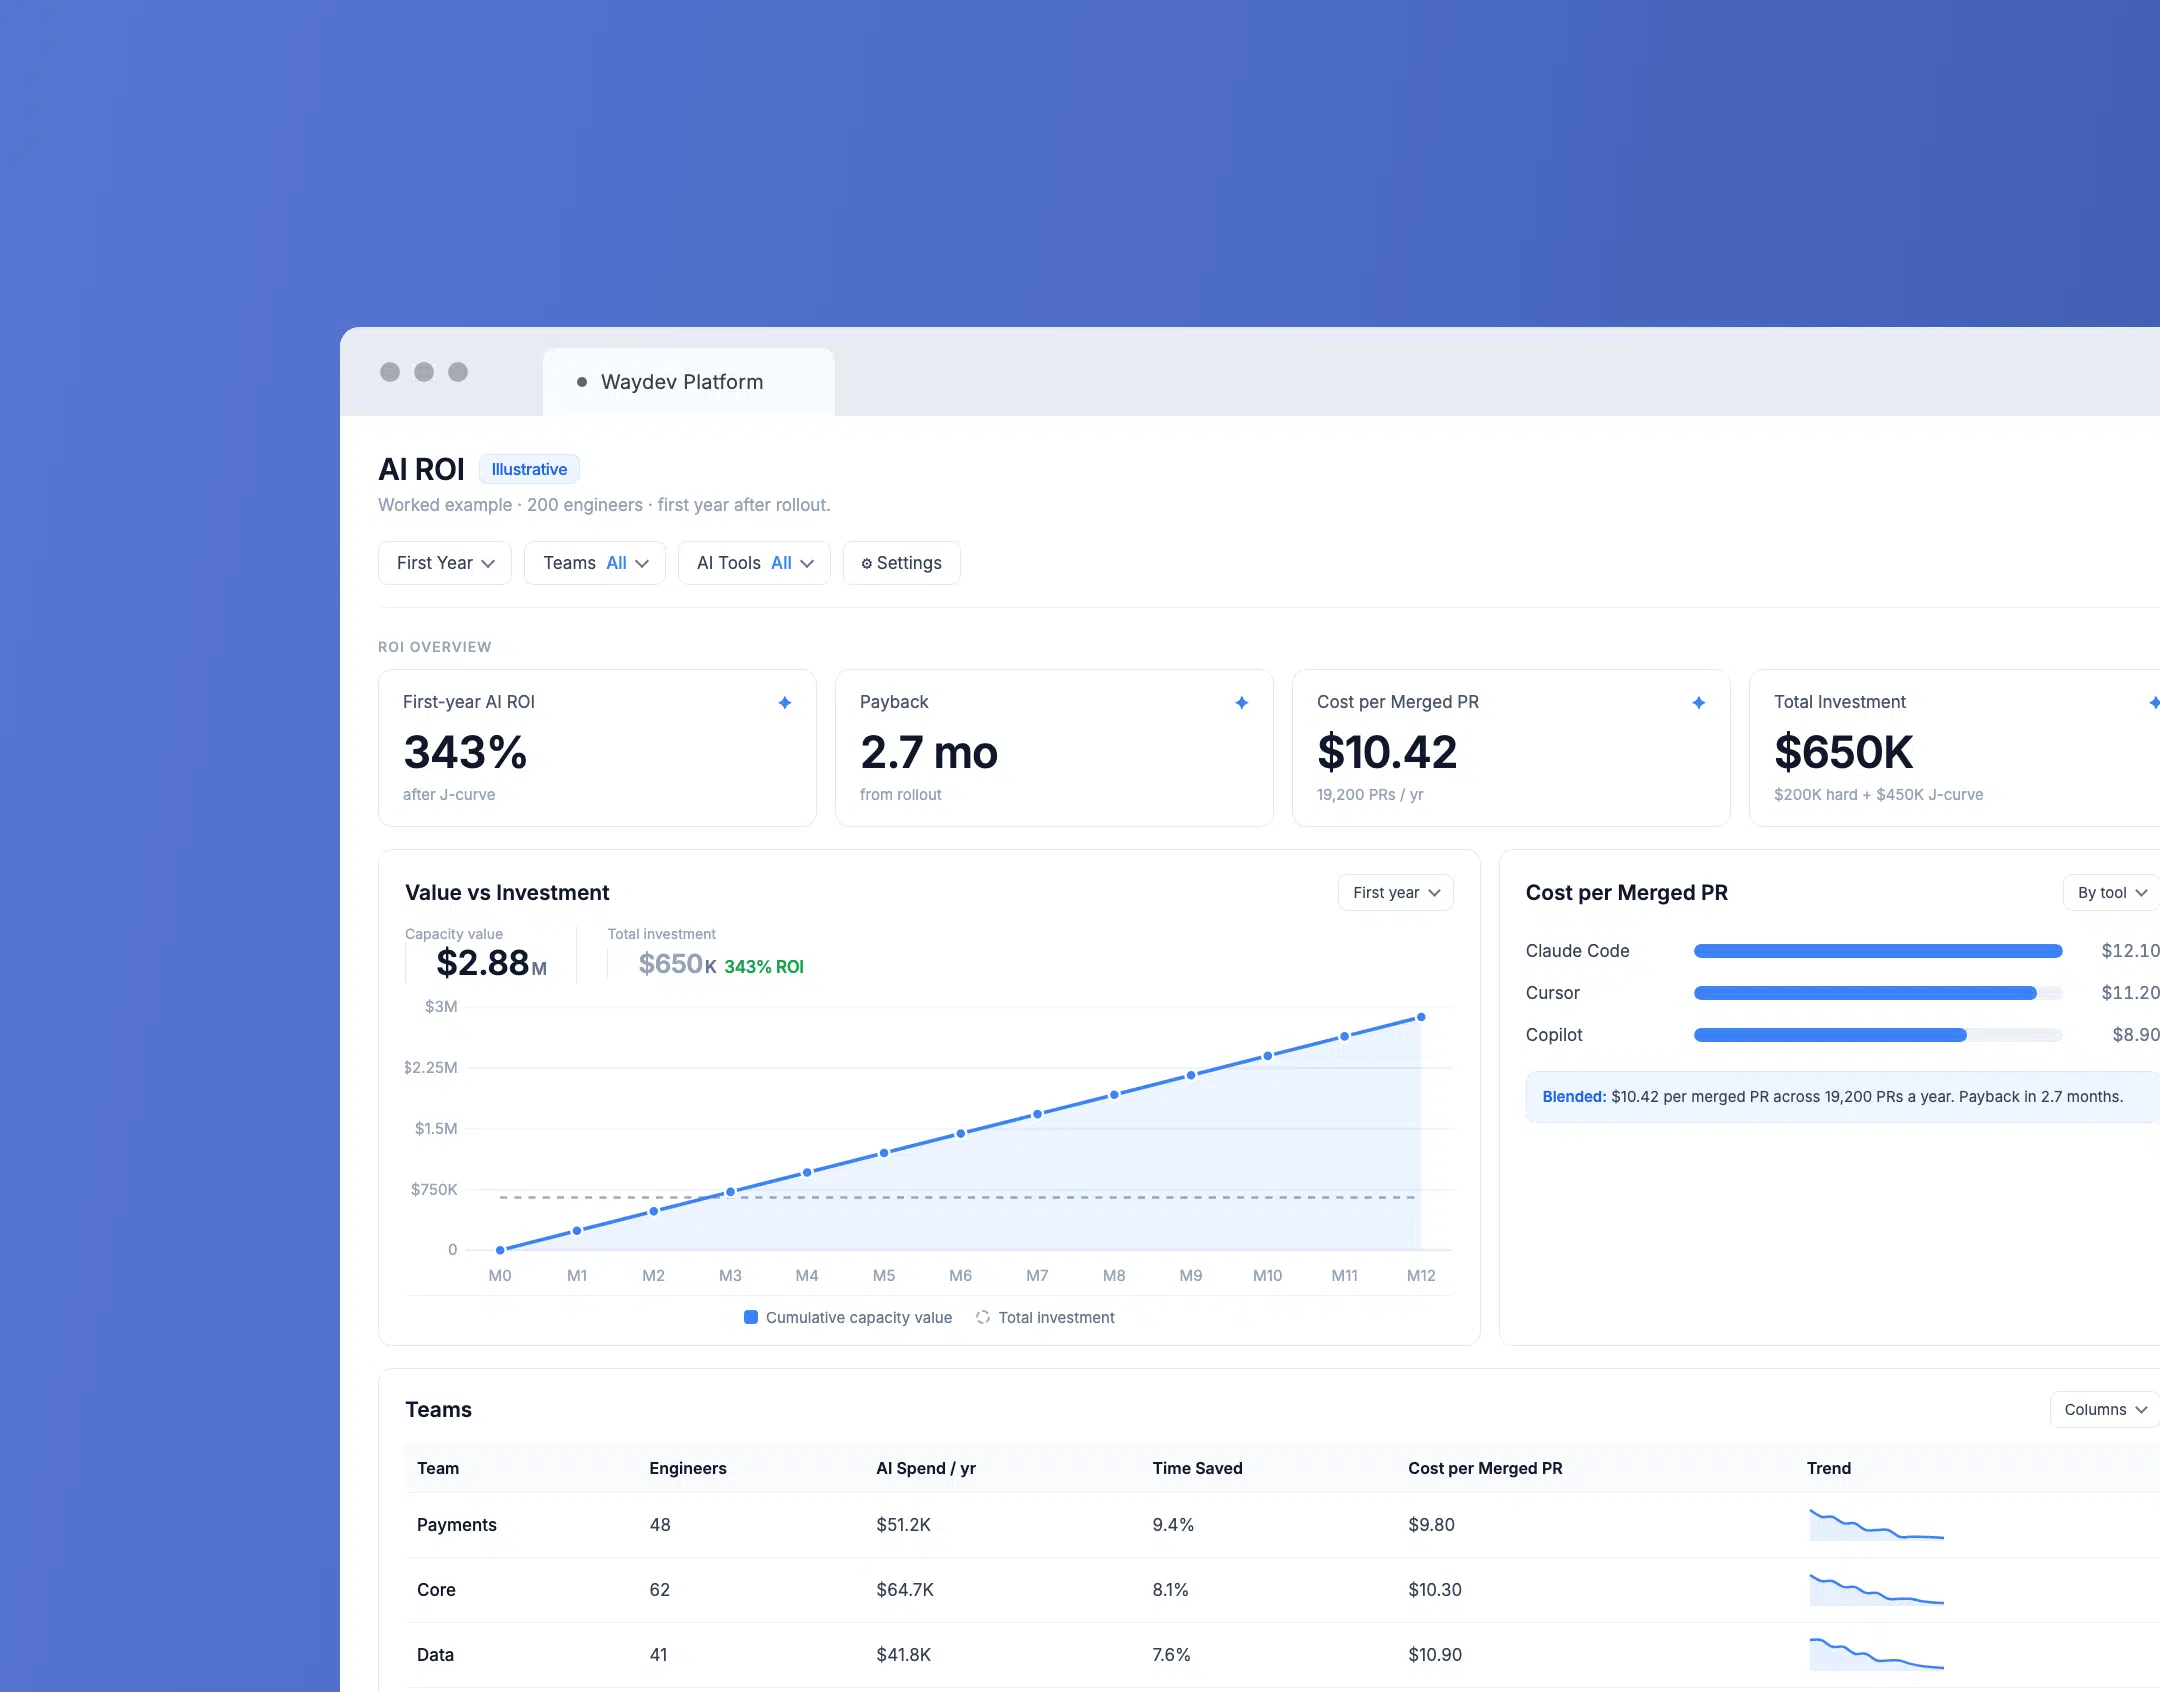
Document the measurement window, coverage gaps, attribution assumptions, team boundaries and quality controls. For a reproducible AI ROI approach see Waydev’s AI coding ROI research protocol. The Agent Registry describes the metadata and ownership model, and AI Governance and Limits details budget alerts and policy controls. Avoid treating a vendor screenshot as a customer outcome or promising guaranteed savings.
Explore these metrics in a Waydev enterprise demo →
Waydev-authored feature descriptions; verify integrations, model hosting and availability in your environment. Enterprise pricing is private.
Waydev is an AI-native engineering intelligence platform trusted by Fortune 500 companies including American Express, Dropbox, and PwC. It measures AI adoption, impact, and financial return at the organization level, not just the team level.
What separates Waydev from every other platform on this list is patented Git analytics that distinguish AI-generated code from human contributions, a capability the majority of competing platforms openly admit they lack. That distinction matters enormously when you need to tell a CFO whether Copilot or Cursor is actually moving the needle on delivery speed and code quality. Waydev’s AI ROI measurement feature connects adoption signals directly to engineering output, giving VPs a single source of truth instead of a patchwork of vendor dashboards. Just as comprehensive visibility tools give operations teams full coverage across every asset, the best engineering intelligence platforms must account for every line of code — regardless of whether a human or an AI wrote it.
The platform’s core product concepts are built for executive reporting. AI Checkpoints track adoption milestones. Signals surface anomalies in real time. The Ask Waydev natural-language interface means you don’t need a data team to pull an answer. And the Predict & Improve engine flags where AI investments are underperforming before the next board meeting.
Waydev integrates across Git providers, CI/CD pipelines, and issue trackers through MCP integration, so your existing data pipelines feed directly in. It’s a Y Combinator W21 alum with nine years in the engineering intelligence space, and it’s recognized by both Gartner and G2. The only real prerequisite is having those data pipelines already in place, which any enterprise team will.
Key Takeaway: Waydev is the only platform on this list that can attribute code output to AI vs. human authors at the Git level, which is the foundation of any credible AI ROI calculation.
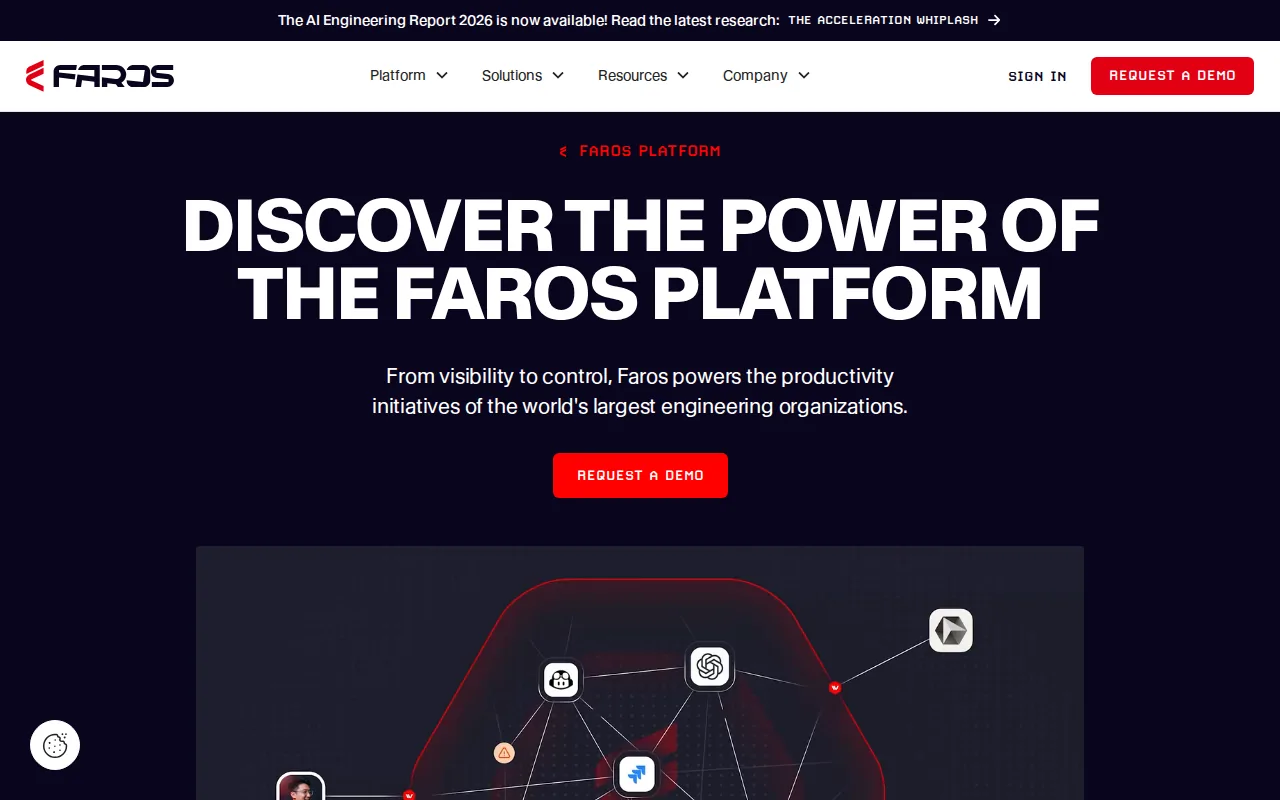
Faros AI is built for enterprise engineering teams that want AI-focused analytics tied together in a unified data model. Its core differentiator is a graph data model with a natural-language query layer, so an engineering leader can ask a question in plain English and get a graph traversal result without writing SQL.
On the metrics side, Faros covers DORA metrics plus custom reporting, which makes it viable for teams that need to extend beyond the standard four. The natural-language query layer is genuinely useful for executive ad-hoc questions, the kind that come up in a QBR when someone asks why deployment frequency dropped in Q2.
The limitation is usable: full customization often requires data-team involvement. If your engineering org doesn’t have a dedicated data engineer, you may find yourself waiting on someone else to build the views you need. Faros also doesn’t capture IDE heartbeat data, so it can’t tell you how a developer actually used an AI tool during coding, only what showed up in the repo afterward.
Best for enterprise teams that already have data infrastructure in place and want a flexible, query-driven analytics layer over their engineering data.
Jellyfish generates executive narratives from engineering data, think auto-drafted summaries like “Q1 saw a 23% rise in unplanned work driven by Project Atlas.” For a CFO who wants plain-English budget reporting without digging into metrics, that’s genuinely useful.
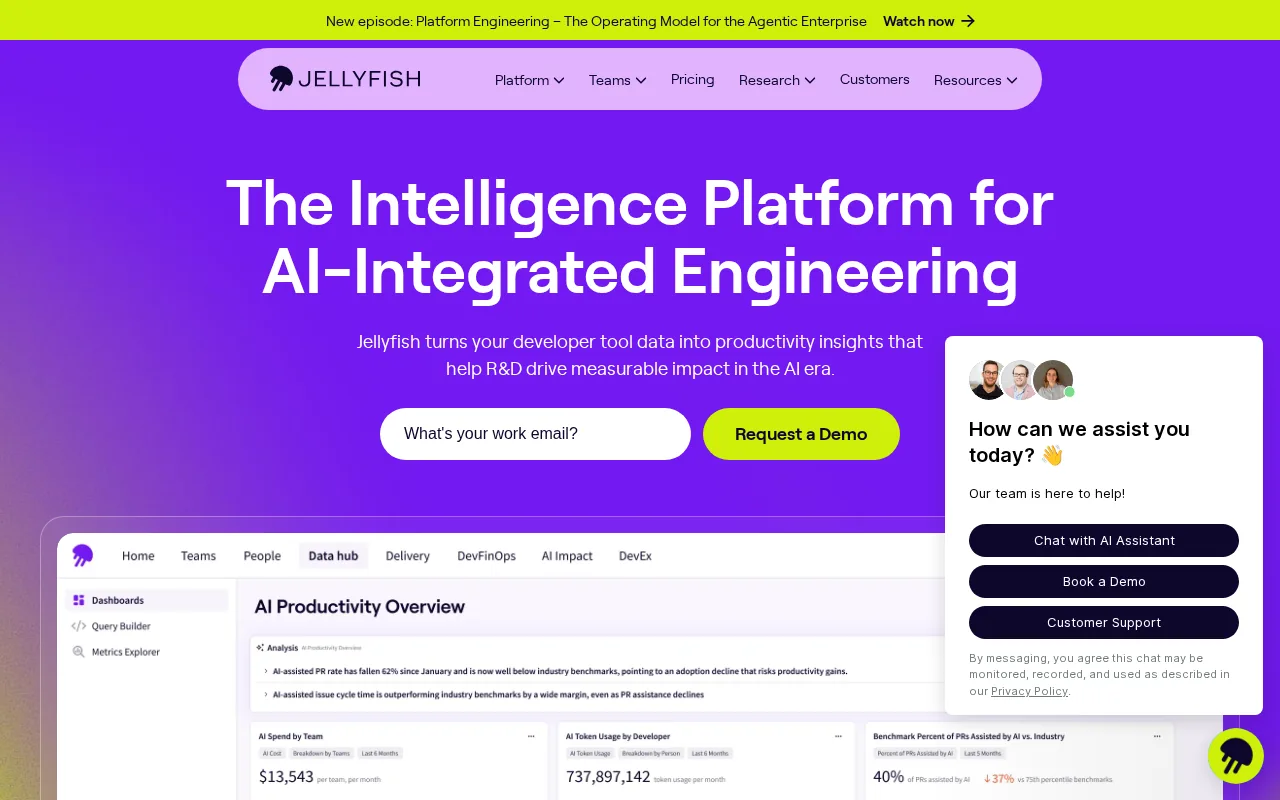
The platform targets financial reporting and resource allocation. It works well when the primary question is where engineering capacity is going and whether spend aligns with roadmap priorities. Engineering investment allocation for R&D capitalization is a real strength here.
For AI ROI specifically, though, Jellyfish runs into a wall. It can’t distinguish AI-generated code from human contributions. Setup takes weeks. And because its data traceability back to source is shallow, you’re working with summaries rather than evidence. If a CFO pushes back and asks “how do you know Copilot wrote that code?”, the platform doesn’t have an answer.
Use Jellyfish if your immediate priority is executive-facing financial narrative and you’re not yet being asked to prove AI attribution at the code level.
Exceeds AI takes a commit-level approach to AI attribution. Its AI Usage Diff Mapping shows exactly which lines in a pull request are AI-generated versus human-written, down to specific numbers like 623 of 847 lines in a given PR. That’s the kind of granularity that turns an ROI argument from assertion into evidence.
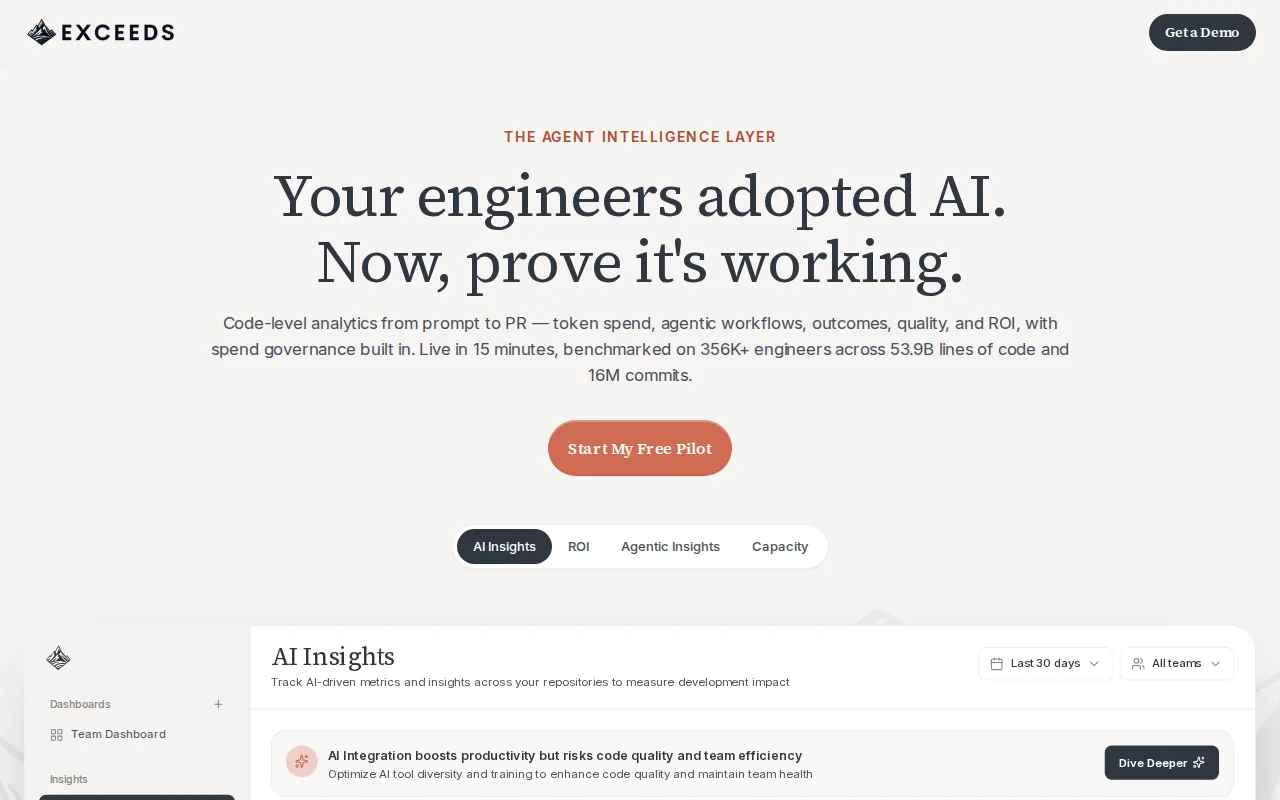
The platform covers tool-agnostic detection across Cursor, Claude Code, and GitHub Copilot, which matters as most engineering orgs now run two or three AI coding tools simultaneously. Outcome Analytics then tracks whether AI-generated lines required more rework over a 30-day window, connecting adoption data to quality outcomes rather than stopping at acceptance rates.
Exceeds was built by former engineering executives from Meta, LinkedIn, and GoodRx, and it’s explicitly designed for two audiences: executives who need board-ready ROI proof, and managers who need coaching data to improve individual AI adoption. That dual framing makes it more operationally useful than platforms that only surface metrics at the org level.
The trade-off is repo access. Exceeds requires direct access to analyze diffs, which some security-conscious enterprise teams will need to clear through their security review process first. If that’s a blocker, expect a longer procurement cycle. If it isn’t, the depth of attribution data you get in return is hard to match.
Swarmia gives engineering teams clean visibility into cycle time and deployment frequency, the delivery metrics that tell you whether your pipeline is actually moving. It’s well-suited for teams that want to benchmark against DORA without a heavy implementation lift.
The developer engagement layer is a genuine differentiator for culture-focused teams. Swarmia surfaces where friction accumulates in the review cycle and where PRs sit idle, which helps engineering managers have better conversations with their teams about process rather than output volume.
For AI ROI measurement, though, Swarmia offers limited AI-specific context. It can’t track multi-tool AI environments, and it doesn’t connect AI usage to business impact beyond basic adoption counts. If your stakeholders are asking whether Copilot is improving delivery speed, Swarmia will show you delivery speed, but it can’t tell you what’s driving the change. Consider pairing it with a tool that has code-level attribution if you need to make that causal link to AI spend. Understanding what to measure when AI writes the code is a separate challenge from tracking delivery health.
If your org is standardized on Copilot and you need a quick, zero-cost way to track adoption, the native Copilot Metrics dashboard is a logical starting point. It reports on acceptance rates, suggestions generated, and active users across the org.
The setup friction is minimal since it’s already part of your enterprise or Copilot Business subscription. For a VP trying to show Copilot utilization to a skeptical CFO, the active-user count and acceptance rate trend are at least a starting point for that conversation.
The ceiling is low. The dashboard doesn’t tell you whether engineering output actually improved as a result of Copilot usage. It can’t compare Copilot-touched PRs to human-only PRs on quality outcomes. And it’s completely blind to any other AI tools your engineers are using. As the Waydev AI Agents Engineering Metrics Report highlights, most orgs run multiple AI tools simultaneously, which makes single-vendor telemetry increasingly misleading as a proxy for total AI impact. Use this as a baseline, not a conclusion.
Typo is a software engineering productivity platform that includes AI adoption tracking alongside delivery metrics, code review analytics, and spend reporting. It’s designed for teams that need real data but won’t clear the budget for an enterprise-grade platform.
The platform covers adoption tracking, deployment metrics, and code review data in a single interface. For a mid-size engineering team that’s just starting to build the habit of measuring AI impact, that breadth at an accessible price point is a usable entry point.
The limitations are real. Typo doesn’t provide the code-level attribution depth you’d need for a serious board-level ROI argument. Multi-tool AI environments and long-horizon outcome tracking aren’t core strengths. If your team grows past a few hundred engineers or your CFO starts asking harder questions about AI-specific financial returns, you’ll likely outgrow Typo fairly quickly. That’s not a criticism of the product, it’s just the right way to think about where it fits.
The table below maps each platform against the four capabilities that matter most when your job is to prove AI coding ROI to a CFO or board. These aren’t the only capabilities these tools have, but they’re the ones that determine whether a platform can actually answer the question “is our AI spend working?”
| Platform | AI Code Attribution | Multi-Tool AI Support | Executive Reporting | Best For |
|---|---|---|---|---|
| Waydev(Our Pick) | Yes (patented Git-level) | Yes (Copilot, Cursor, Claude Code, Windsurf) | Yes (NLQ, Signals, AI Checkpoints) | Enterprise AI ROI & org-level reporting |
| Faros AI | Partial (no IDE heartbeat) | Yes | Yes (graph NLQ) | Enterprise with data-team resources |
| Jellyfish | No | No | Yes (narrative generation) | CFO-level financial narrative |
| Exceeds AI | Yes (commit-level diff) | Yes | Partial | Coaching-focused AI ROI proof |
| Swarmia | No | No | Partial | Delivery health & DORA tracking |
| GitHub Copilot Dashboard | No | No (Copilot only) | No | Copilot adoption baseline |
| Typo | Partial | Limited | Partial | Mid-size teams on tighter budgets |
The pattern is clear. Most platforms were designed before AI coding tools went mainstream, so AI attribution was never a design priority. Waydev and Exceeds AI are the two exceptions that can draw a direct line between AI tool usage and engineering output. For enterprise teams reporting to a board, that line is the whole point.
Not every platform that claims to measure AI coding ROI can actually do it. Here’s what to pressure-test before you sign a contract.
Code-level AI attribution. Ask directly: can the platform tell me which lines in a merged PR were AI-generated versus human-written? If the answer is “we track acceptance rates” or “we look at metadata,” that’s not attribution. That’s adoption tracking, which is a different and weaker measurement.
Multi-tool coverage. Most engineering orgs now use more than one AI coding tool. A platform that only tracks a single AI coding assistant will give you an incomplete picture. Look for support across Cursor, Claude Code, Windsurf, and whatever tools your engineers are already experimenting with. Measurement frameworks need to evolve as AI implementation patterns change, which means your platform needs to keep pace with new tools as they emerge.
Outcome tracking, not just adoption tracking. Acceptance rate is a usage metric. What matters for ROI is whether AI-generated code holds up: does it require more rework within 30 days? Does it correlate with incidents? Does it change PR cycle time in a meaningful way? Platforms that stop at adoption are measuring activity, not outcomes.
Implementation speed. Some platforms take weeks to fully configure. If you’re being asked to show AI ROI at next quarter’s board meeting, a multi-week onboarding timeline is a real problem. Factor that into your evaluation, not just the feature set.
Privacy and governance posture. Enterprise security teams will ask where your code goes. Look for platforms that measure at the signal level rather than ingesting code content, and verify their data residency and compliance posture before repo access becomes a procurement blocker. For teams in regulated industries, this often ends up being the deciding factor.
When thinking about how to evaluate whether AI tools are genuinely moving the needle on your engineering org, the right mental model isn’t adoption, it’s impact. Faster merges that push technical debt downstream aren’t wins. A useful framing comes from thinking about what makes an engineering intelligence platform genuinely AI-native versus one that retrofitted AI metrics onto a legacy analytics base.
Pro Tip: Before evaluating platforms, define the one question your CFO will ask at the next board meeting. Build your platform shortlist backward from that question. If the question is “which AI tools deliver the best cost per commit?”, you need code-level attribution. If it’s “where is engineering capacity going?”, financial allocation tools may be enough.
Security visibility is a related concern worth noting. Just as cybersecurity asset management tools give security teams full visibility across every asset, the best engineering intelligence platforms give VPs full visibility across every AI tool contributing to the codebase. The same principle applies: you can’t govern what you can’t see.
An engineering intelligence platform pulls data from Git providers, CI/CD pipelines, and issue trackers to give engineering leaders visibility into delivery performance. For AI coding ROI specifically, the best platforms go further and distinguish AI-generated code from human contributions, then track whether that AI code performs well over time on metrics like rework rate, PR cycle time, and incident frequency. ROI is calculated by connecting time savings and quality changes to financial inputs like loaded developer hourly rates.
Waydev is the strongest choice for CFO-facing ROI reporting. Its patented Git-level AI attribution, AI Checkpoints, and Signals features give you org-wide data that connects AI tool adoption to real engineering output. That’s the causal chain a CFO needs to approve continued investment. Legacy engineering analytics tools handle financial narrative but can’t distinguish AI from human code, which weakens any attribution argument.
No. A built-in tool dashboard — such as the one available for tracking acceptance rates and active users — is useful for utilization tracking but tells you nothing about whether AI-touched code is higher quality, faster to ship, or more incident-prone than human-only code. It’s also blind to every other AI tool in your stack. Use it as a baseline data point, then layer a platform that can provide outcome-level attribution on top.
DORA metrics (deployment frequency, lead time for changes, change failure rate, and mean time to restore) measure delivery throughput and stability. They’re a useful before-and-after baseline for AI adoption, but they don’t isolate AI as the cause of any change. A complete AI ROI picture requires DORA metrics plus AI-specific attribution: which code was AI-generated, and did it move those DORA numbers in the right direction?
It varies significantly. Some platforms take weeks to configure fully, especially those requiring custom data pipelines or data-team involvement. Waydev’s standard prerequisite is existing engineering data pipelines, which enterprise teams already have, so the implementation path is more direct. If you’re evaluating multiple options, ask each vendor for a realistic time-to-first-dashboard figure, not just the headline onboarding promise.
The best ones don’t. Engineering intelligence platforms should measure at the team and org level, not rank individual engineers. Waydev specifically avoids surveillance framing and focuses on aggregate signals that help leaders make investment decisions. Before deploying any platform, verify that it measures delivery signals rather than individual keystroke or activity data, and communicate that clearly to your engineering team to maintain trust during rollout.
If you’re in front of a board that wants proof your AI coding investment is working, most of the tools on this list will leave you short. Waydev is the platform we’d put in front of that conversation: AI-native attribution, patented Git-level analysis, and the executive-facing reporting features to turn raw signals into a board-ready story. Start with the AI Adoption feature to benchmark your current tooling, then build the financial case from there.
Ready to unlock your SDLC productivity?