
A dashboard is easy to prototype. The harder job is maintaining trustworthy data, consistent metrics, useful AI measurement, and the operating workflows that make insights actionable. Compare the full cost and the organizational trade-offs before deciding.
Evaluate WaydevTry the ROI calculatorEvaluate a platform such as Waydev when you need repeatable delivery, team, AI-adoption and engineering-investment reporting and want to avoid operating an internal analytics service.
Build when your needs are unusually proprietary, vendor telemetry cannot meet policy requirements, or you already have a well-funded data-product team that owns long-term reliability.
The real choice is not “dashboard versus subscription.” It is operating an engineering-data product yourself versus using a platform, plus any necessary extensions and governance. A hybrid approach is often sensible.
Compare like-for-like capabilities, including integration maintenance and quality checks, not merely the appearance of charts.
| Dimension | Build in-house | Evaluate with Waydev |
|---|---|---|
| Integrations | Own Git, issue tracker, CI/CD and AI-tool connectors, API changes, rate limits and data reconciliation. | Assess supported integrations and the effort needed to onboard your actual tools and projects. |
| Metric definitions | Maintain event normalization, team mappings, edge cases and changes to DORA or cycle-time definitions. | Review existing engineering reports, definitions, historical coverage and configuration options. |
| AI adoption & cost | Unify user activity, vendor billing, model usage, assisted work and outcome attribution. | Evaluate documented AI adoption, impact, vendor-spend and ROI workflows where integrations support them. |
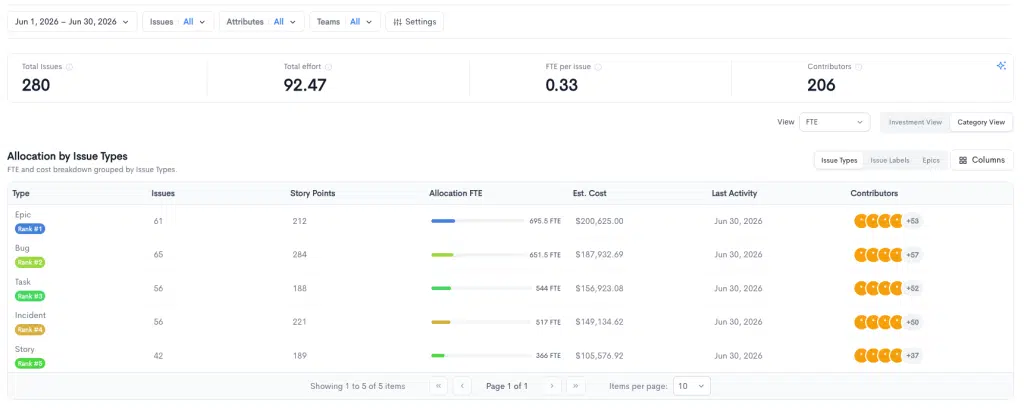
| Decision-making | Create your own dashboards, alerts, drill-downs and review process. | Explore delivery, team effectiveness, finance and planning reports, then validate actionable use cases. |
| Governance | Control all infrastructure; own privacy, access reviews, auditability, retention and uptime. | Validate access controls, deployment, data residency, contract terms and requirements for each module. |
| Three-year TCO | Development, data engineering, storage, security, QA, maintenance, support and staff turnover. | License, onboarding, integration, administration, deployment and any internal BI work. |
A check in either column is not a product certification. Require a hands-on evaluation against real connected data before procurement.
A proof of concept can chart merged pull requests quickly. Production-grade engineering intelligence requires trustworthy attribution across changing teams, work systems and AI tools.
One engineer may use multiple identities across Git and issue tracking. Teams move, split and merge. Without a stable mapping, trend comparisons become misleading.
Rate limits, auth updates, pagination and vendor API changes create maintenance work long after the dashboard ships.
Cycle time, deployments, reverts, bots, reviews and unmerged work require explicit rules, exclusions and versioning.
Assistant adoption is observable only to the extent supported by integrations. Claiming causal delivery improvement or autonomous-agent value requires stronger evidence.
Leaders need drill-downs and consistent access rules so they can review claims without exposing sensitive developer data.
Dashboards need tests, documentation, alerting and a named maintainer even after their original builder changes roles.
Start by checking deployment frequency, change lead time, change failure and recovery signals against raw source events. DORA research now describes five delivery-performance metrics; confirm which metrics are implemented in a specific product version instead of assuming complete framework coverage.
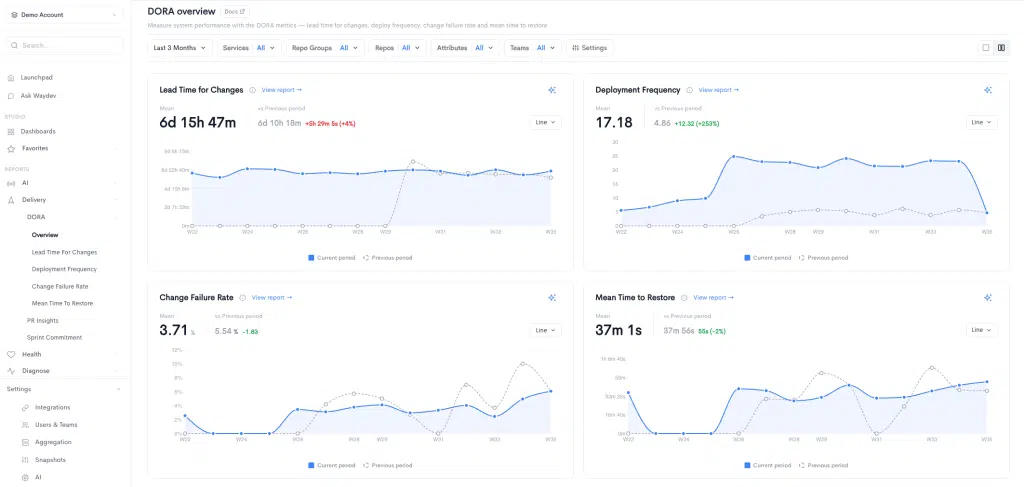
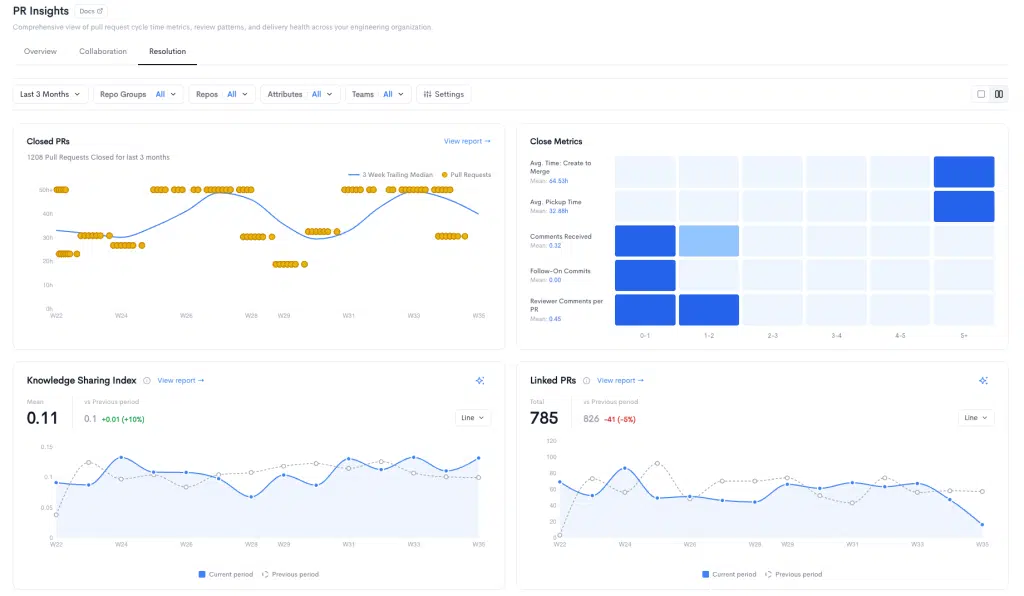
A useful system moves from “review time increased” to the specific queue, work type or process causing the delay. Test whether the solution distinguishes coding, pickup, review, rework and deployment stages, and whether teams can evaluate the change after intervention.
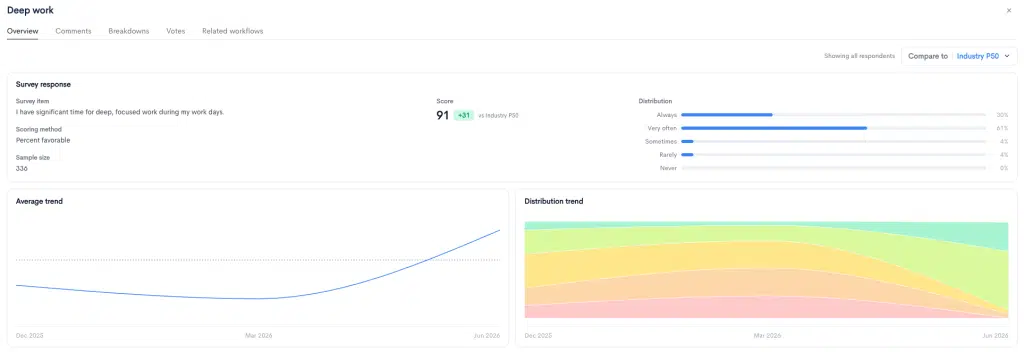
Metrics alone do not explain interruptions, developer sentiment or unclear ownership. Add surveys and qualitative feedback. Use team-level evidence to improve the system, not to rank individuals by visible activity.
Compare a full first-year and three-year horizon. Separate one-time implementation work from recurring maintenance and opportunity cost. The example below is hypothetical, not Waydev pricing or a reported customer outcome.
Build TCO = implementation labor + data infrastructure + connector maintenance + QA/security + analytics improvements + ongoing support.
Buy TCO = product subscription + implementation + integration + private deployment requirements (if any) + internal administration and extensions.
| Illustrative internal build | Assumption | Calculation |
|---|---|---|
| Initial delivery | 2 engineers × 4 months × 160 hours/month × $100 loaded hourly cost | $128,000 in labor |
| Annual maintenance | 0.5 FTE × 1,920 hours/year × $100 loaded hourly cost | $96,000/year |
| Three-year labor subtotal | Initial delivery plus three full years of maintenance at that rate | $416,000 |
| Additional costs | Infrastructure, security reviews, analytics extensions, rework, staff transitions | Calculate separately |
The three-year subtotal assumes maintenance starts after the initial delivery and continues for three years. It is not a standardized estimate; use your own staffing and timelines to avoid double-counting implementation versus maintenance periods.
For the buy scenario, compare the actual commercial quote and rollout scope. A lower cost does not automatically imply greater business value, and more developer activity does not necessarily imply better outcomes.
Engineering ROI calculator · AI ROI calculator · Explore Resource Allocation
Hybrid is a legitimate third path: retain company-specific financial or product metrics in internal BI, while using a specialized platform for supported engineering measurement. Validate data export, APIs and governance before committing.
No. Compare an actual proposal and integration scope with your full internal build and maintenance costs over the same period, including staff continuity and infrastructure.
Yes. The hard part is maintaining consistent event definitions and reliable source data over time. Compare results with the official DORA metrics guide and confirm what your chosen platform supports.
AI tools can accelerate coding and dashboard prototypes, but do not automatically solve identity resolution, permissions, API maintenance, data completeness, reliable metric definitions or causal impact measurement.
Waydev provides supported AI usage, impact and spend signals. A defensible ROI needs validated baselines, fully loaded costs and evidence of sustained improvements in delivery or quality. Correlation alone is insufficient.
Deployment and processing vary by feature and configuration. Confirm the documented architecture, integrations and security controls for the specific modules you plan to use.
Not necessarily. Most teams can preserve internal commercial dashboards and use engineering intelligence for workflows that would otherwise require specialized data collection and metric maintenance.
Bring your integration inventory, required engineering outcomes and security constraints. We can walk through the relevant product views and identify the differences you would still need to implement internally.
Schedule a product walkthroughAlso useful: AI Agents Playbook · Explore Waydev Features.
Updated November 2026. Screenshots are from published Waydev feature pages. Product coverage, pricing and deployment options should be verified for your environment; calculations are illustrative.
Ready to unlock your SDLC productivity?