Estimated reading time: 16 minutes
Boost software delivery performance with DORA Metrics. Track Deployment Frequency, Lead Time for Changes, Change Failure Rate, and MTTR using Waydev. Gain actionable insights to optimize DevOps efficiency.
Software delivery performance refers to how successful engineering teams are in the velocity, quality, and stability of their delivered code at a basic level. However, understanding what it takes to have high-performing Engineering teams in an organizational environment is challenging, with some even stating that it’s impossible to measure something as intangible and abstract as performance.
Over the years, many industry experts have tried to devise ways of predicting performance with more or less success. One widely accepted conclusion is that to improve a process, you first need to be able to define it, identify its end goals, and have the capability of measuring the performance. Improving software delivery performance is one of the main goals of OKR DevOps, and metrics such as the DORA metrics can be used to measure and optimize the performance of the software delivery process.
The DORA Metrics, a research program conducted by industry trailblazers Dr. Nicole Forsgren, Gene Kim, and Jez Humble, would redefine what we know of software delivery performance. Furthermore, the co-founders of DORA pitched the idea that after identifying those capabilities that can drive DevOps team performance, one should take the collected data and implement a personalized model to fit each organization. Their innovative ideas became an industry benchmark for identifying what’s needed to understand potential pitfalls and practical ways of improving software delivery performance. Their proposed models have proven to optimize OKR for DevOps teams’ performance and drive the success of tech organizations across all industries.
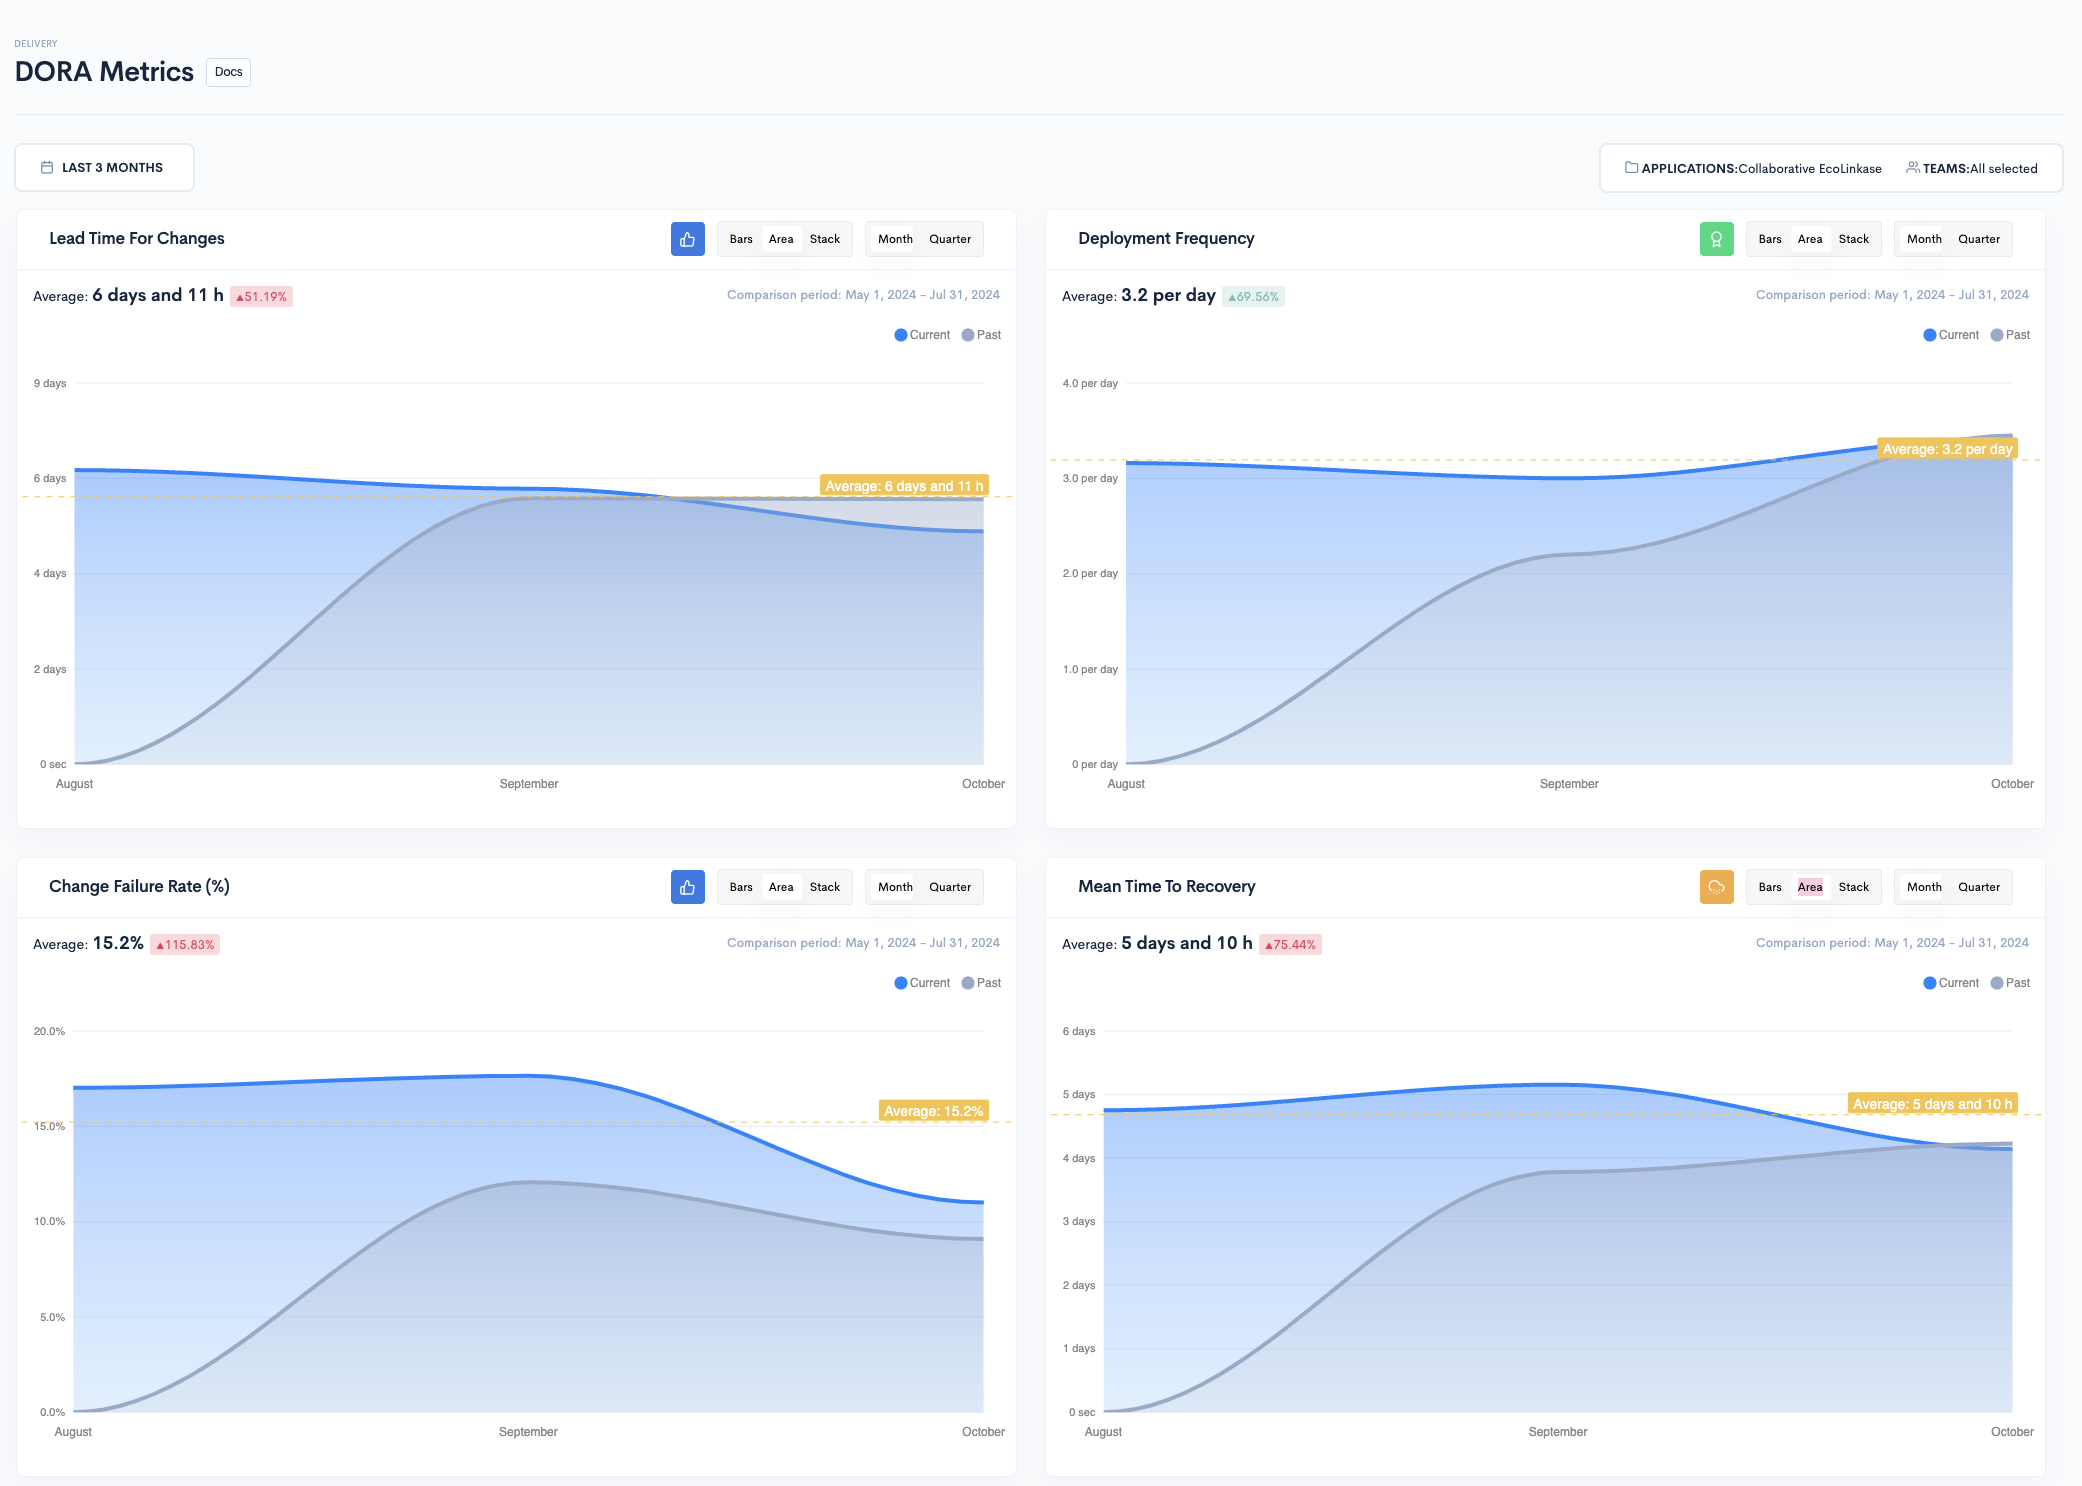
This article will define the four key DORA Metrics, where the concept originated, and how to apply these performance metrics for maximum benefits. Using Waydev’s DORA metrics dashboard, you can automatically pull these four key metrics in a single dashboard with no manual input, thanks to our CI/CD integrations, such as GitHub Actions, Jenkins, and CircleCI. Doing so will provide a clear overview of your team’s delivery performance over time, generate reports that will drive your decision-making skills, and identify areas of improvement.
DORA Metrics started with three researchers who wanted to define software delivery performance and develop a revolutionary model to help tech organizations improve it. Dr. Nicole Forsgren, Gene Kim, and Jez Humble co-founded DORA, a startup that would be the basis for redefining how the tech industry looks at performance.
DevOps Research and Assessment was founded to study and measure what it takes for development teams to become top performers. Taking this concept further, the ultimate goal of this endeavour was to identify” a valid and reliable way to measure software delivery performance,” as Jez Humble himself, one of the original researchers of DORA, puts it. The researchers also wanted to develop a model that would identify the specific capabilities teams could leverage to improve software delivery performance in an impactful way.
To this effect, DORA first conducted studies for three years, between 2014 and 2017, and then used data from tens of thousands of industry professionals to come up with predictions of performance outcomes (by 2021, this number was up to 32,000 respondents to the study). Dr. Nicole Forsgren, Gene Kim, and Jez Humble would then use the collected data to identify an algorithm that could predict performance outcomes and indicate which areas to focus on to get the most impact on improving DevOps performance. These conclusions were published in the annual State of DevOps Report. In time, the report became an industry benchmark for software delivery performance, and it gives tech organizations a measure of what they should strive for to have top-performance development teams and stay relevant in the very competitive market.
Even when you have all the data at hand, implementing change at an organizational performance level is no easy task, and the founders of DORA suggest that doing this dramatically and suddenly is the wrong way to go about it. Instead, they propose using an individualized approach based on an analysis of the particularities of each organization. In other words, no one-size-fits-all model can be applied to every organization with resounding success regarding software delivery performance. DORA Metric encourages using personalized improvement models based on exact data and the experience of industry practitioners. This concept perfectly illustrates why there was a need for specific software development performance metrics to identify exactly what DevOps team performance is made of – to improve something, you first need to define, identify, and measure it accurately.
After approximately two years of studies, the research program founded by DORA got its first customer with Capital One at the 2016 DevOps Enterprise Summit – this became one of the largest digital banks and has received many accolades for tech innovation following DevOps practices under the guidance of Dr. Tapabra Pal. This first collaboration was a resounding success due to its impact on identifying problem areas and improving performance by 20 times when applying the DORA proposed model.
From here on, the newly released DORA software development concept platform continued growing organically, with incredibly positive results in improving performance outcomes speaking for themselves, until finally being acquired by Google Cloud in 2018. This acquisition followed a previously successful partnership between the two entities in testing hypotheses in areas such as observability and reliability of the performance model and assessing the impact of applying cloud infrastructure in performance.
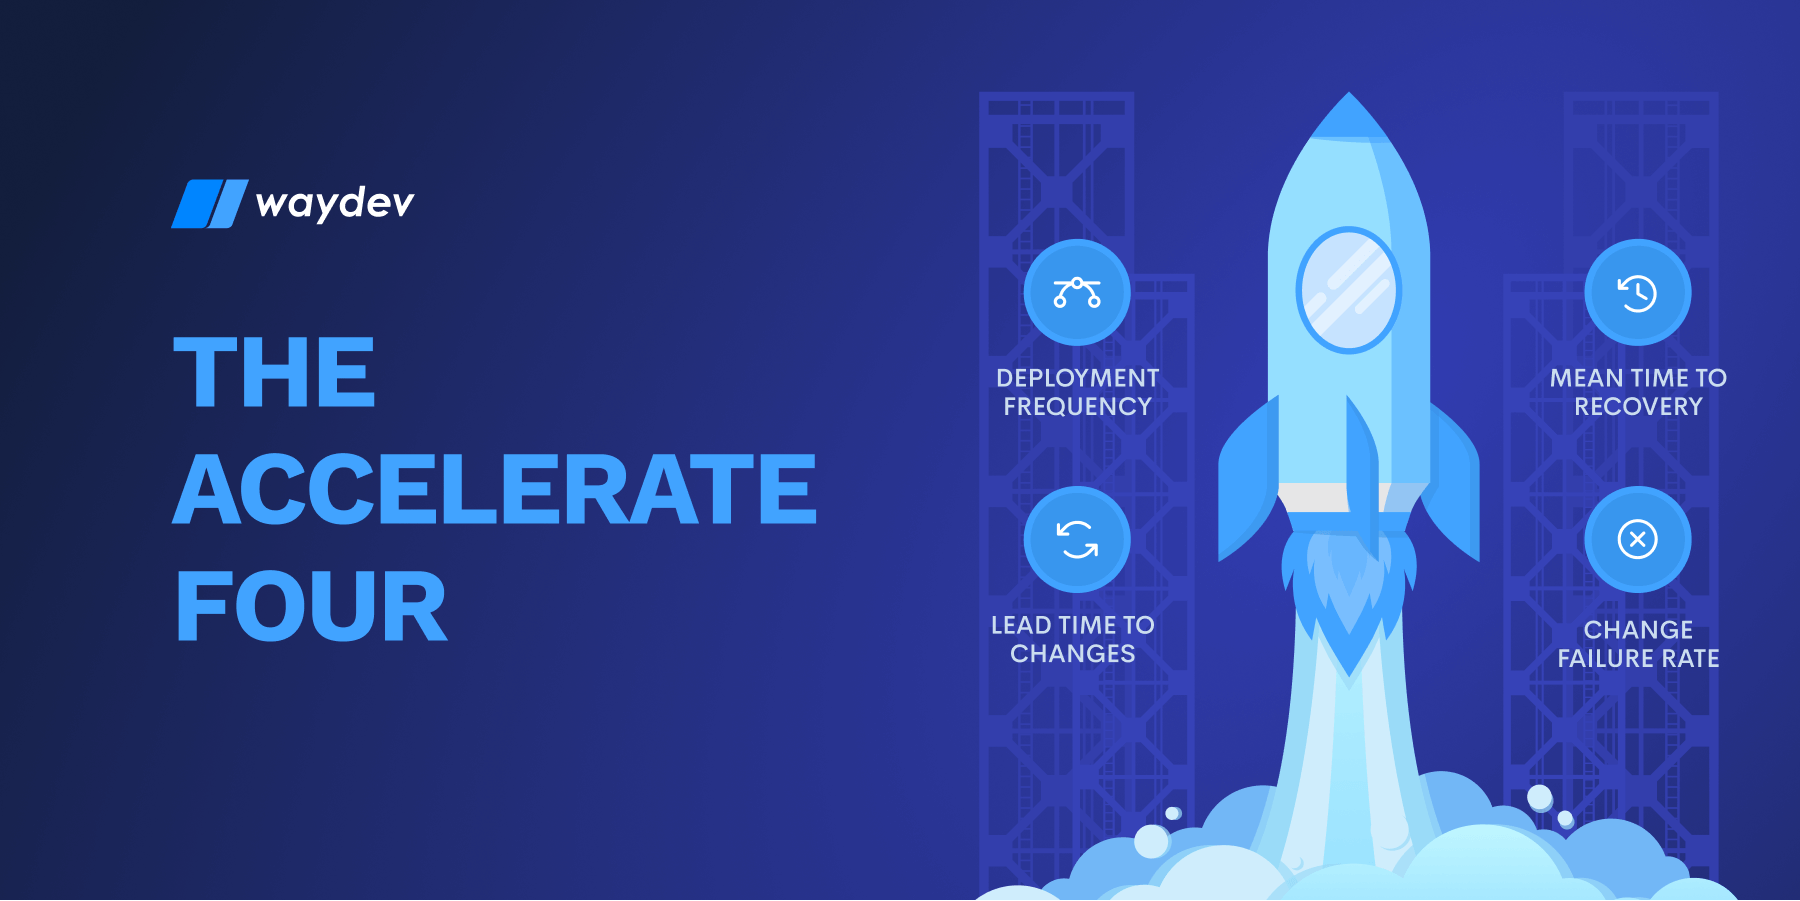
Accelerate is a book written by the co-founders of DORA, Dr. Nicole Forsgren, Gene Kim, and Jez Humble, who wanted to summarize their four years’ worth of research findings into one paper. The book was thus published in 2018, and it provides the data collected from their State of DevOps annual Reports starting from their early research in 2014 up to the moment of publication.
This paper is a reiteration of the conceptualization of the DORA Metrics and how they can be used to successfully identify the capabilities that influence DevOps team delivery performance within a tech organization. Its authors also show how you can use these findings, based on the four specific Accelerate Metrics, to track performance and find ways to improve it in each specific area. The book shows how these metrics are derived from Lean manufacturing principles and speaks about how work culture impacts performance and the general success of the organization. The paper also introduces terms like” deployment pain” – the anxiety that comes with pushing code into production and not being able to anticipate the outcome.
DORA Metrics is a concept developed to assess performance in software engineering development teamsthat helps categorize them from” low performers” to” elite performers” within the industry. The concept derives from Lean manufacturing principles and is best compatible with DevOps practices.
DORA is an acronym for DevOps Research and Assessment, the name of the startup founded by the original researchers Dr Nicole Forsgren, Gene Kim, and Jez Humble. This model uses four key metrics to measure software delivery performance: Deployment Frequency (DF), Change Failure Rate (CFR), Lead Time to Change (LTTC), and Mean Time to Recovery (MTTR).
DevOps DORA Metrics gives engineering leaders a means for assessing performance and provides a comprehensive guide for data-driven decisions to implement changes that will drive the organization’s success. The basis of this concept was a complex study initialized by three industry frontrunners that sought a reliable way to define what performance is made of within an organization and its impact on both financial and non-financial outcomes.
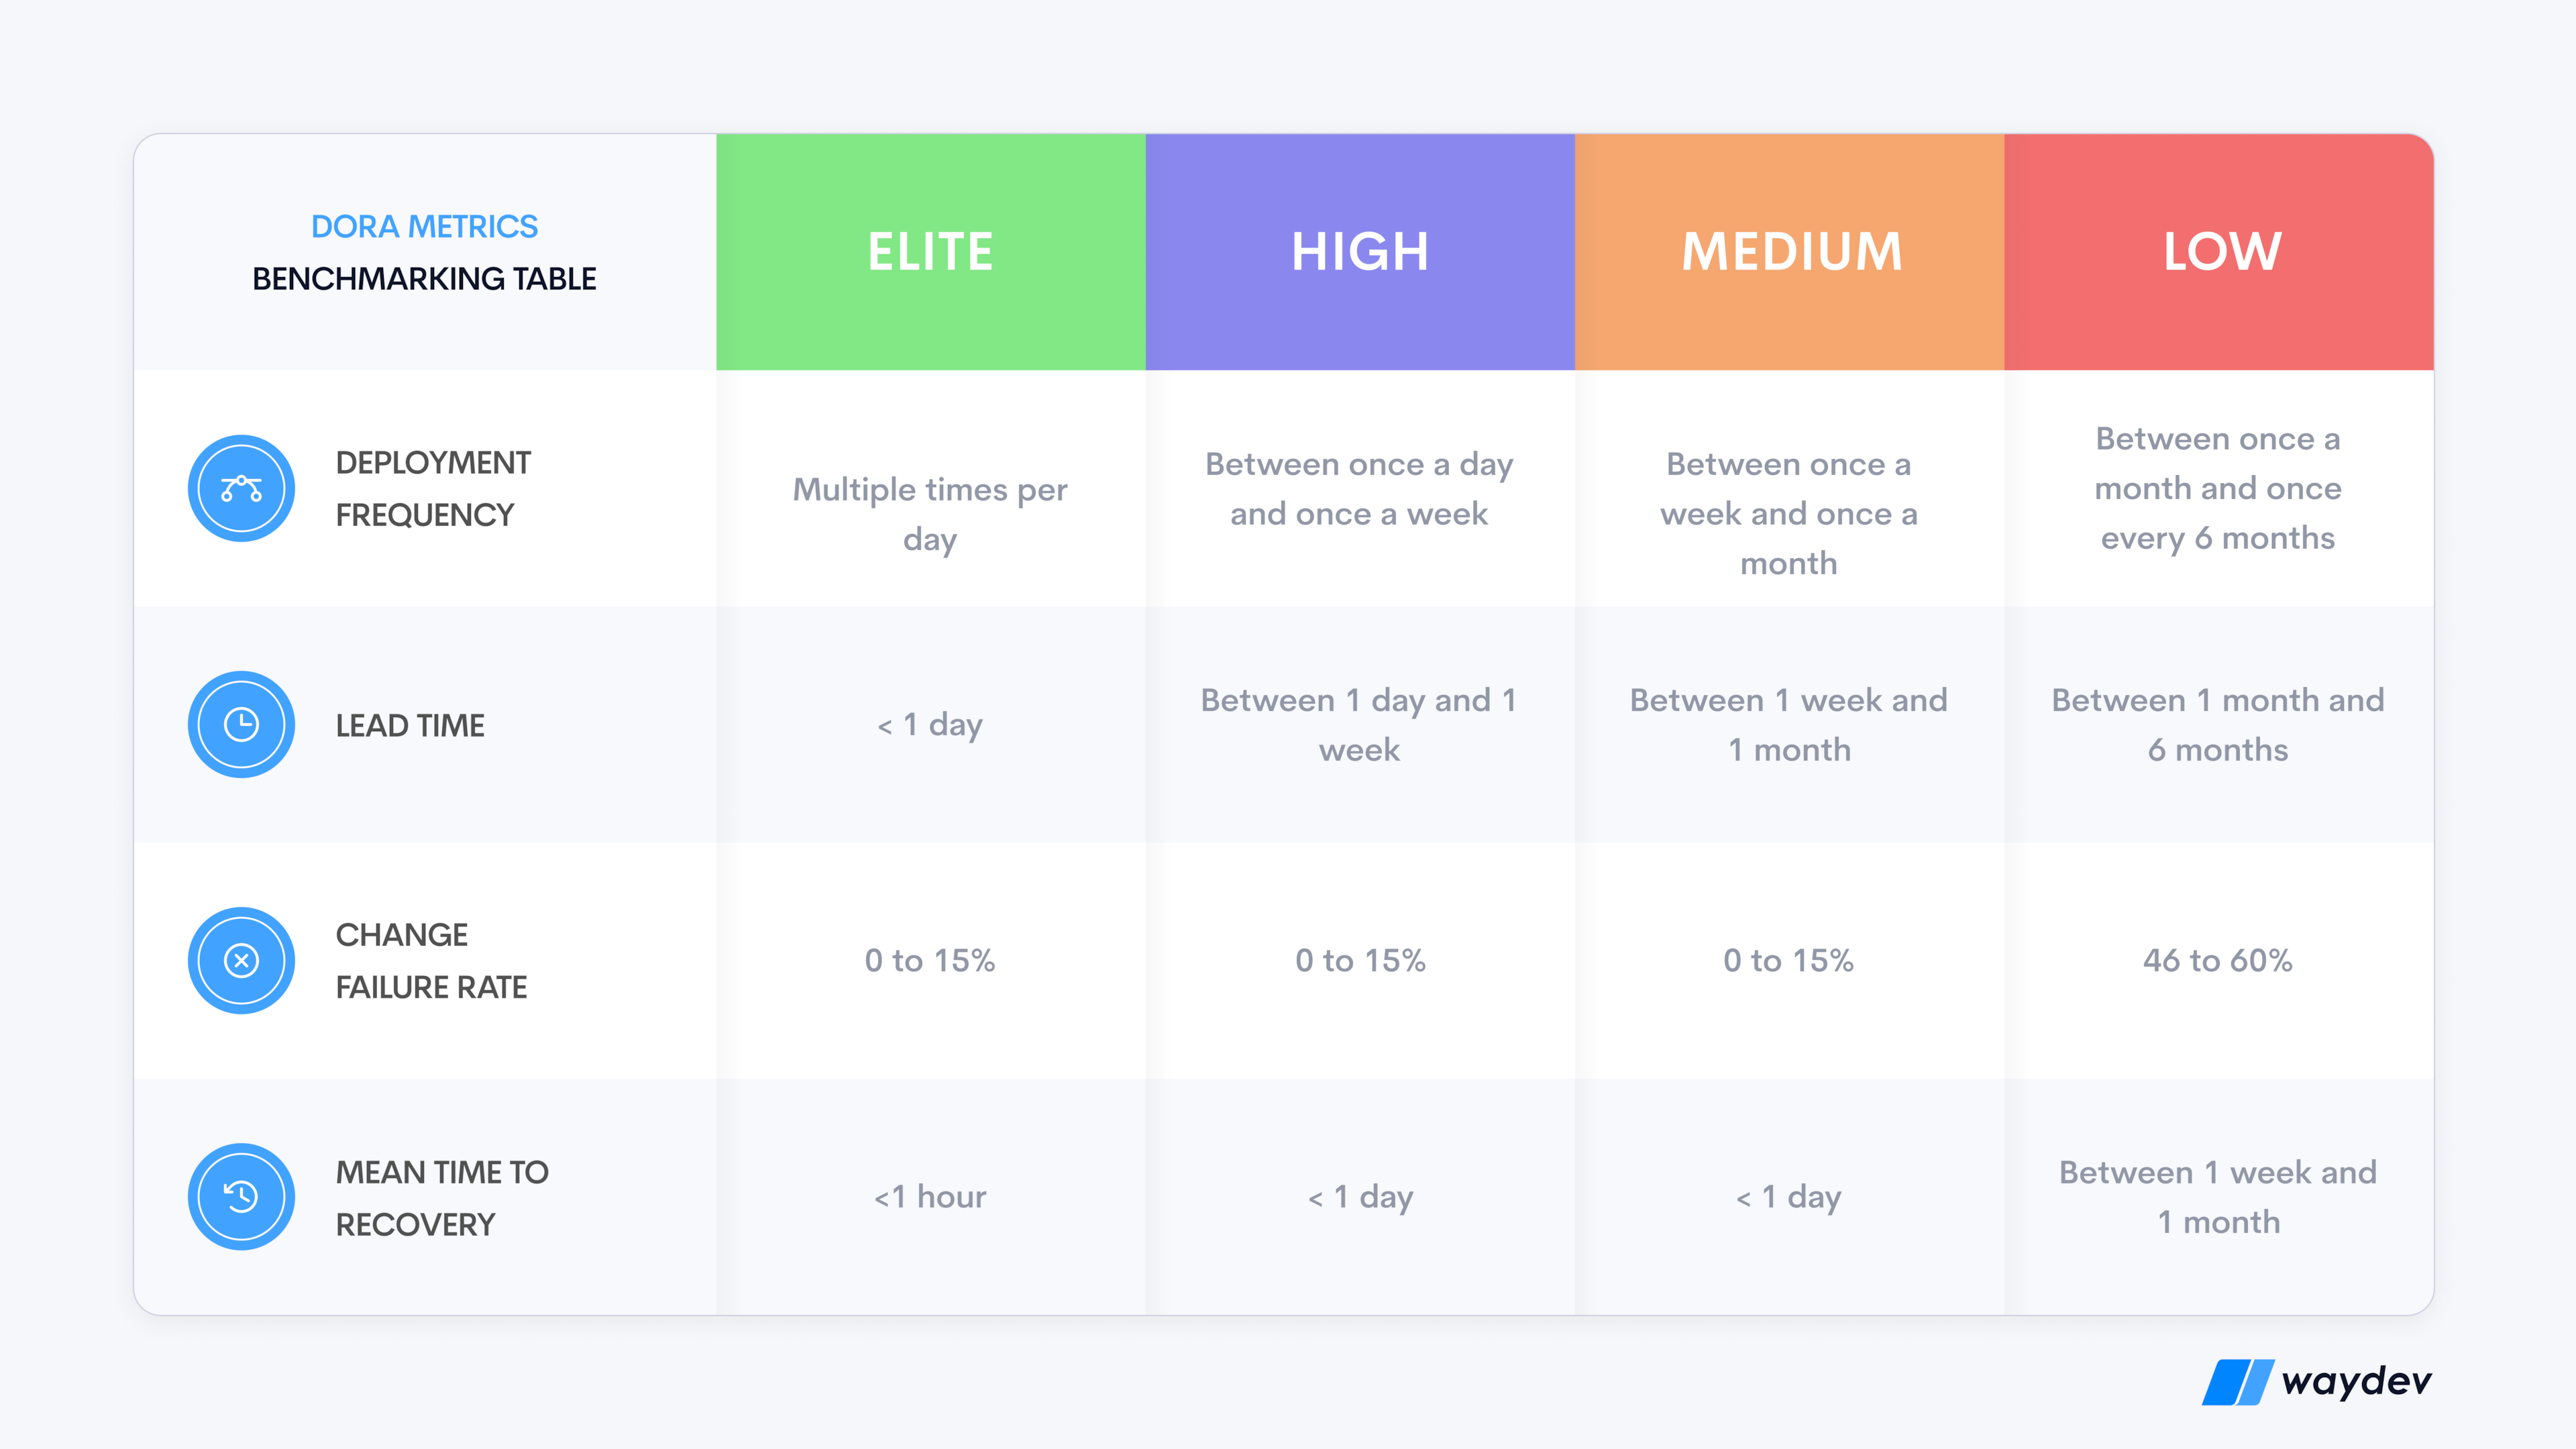
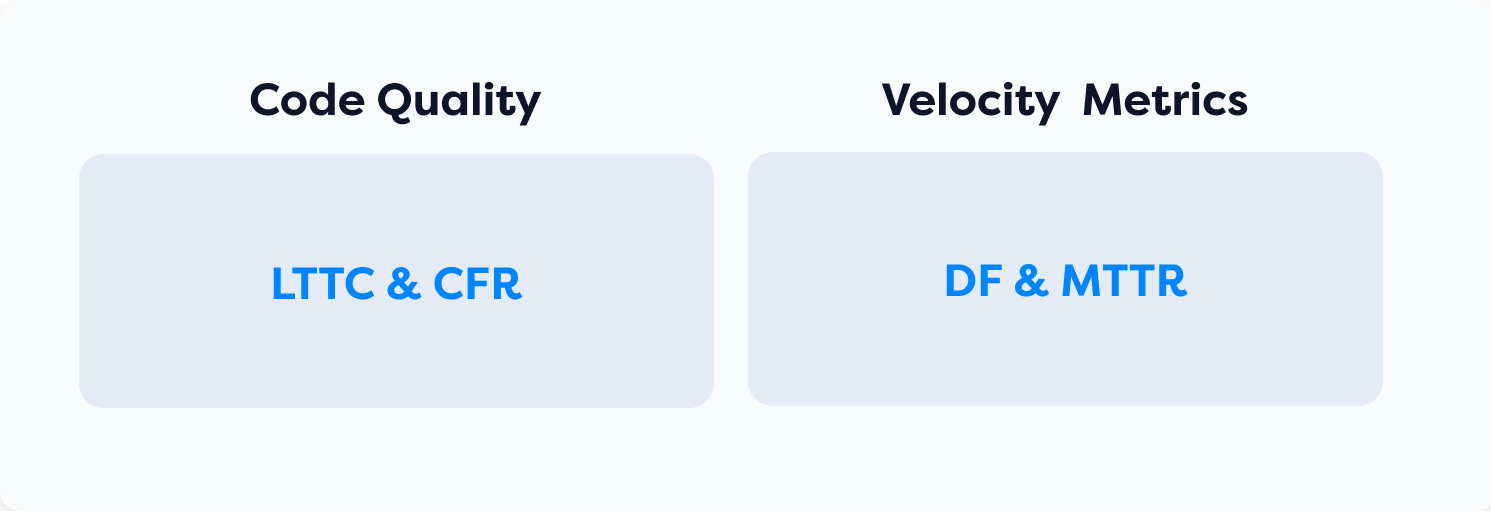
The four metrics that compose the DORA concept are the key to understanding how to measure and assess DevOps team performance. Here is our breakdown of these metrics, some industry values, and insight into best practices. DORA Metrics will help you better understand how to assess velocity (using Deployment Frequency or Mean Time to Recovery) and code quality (with the help of Change Failure Rate and Lead Time For Changes).
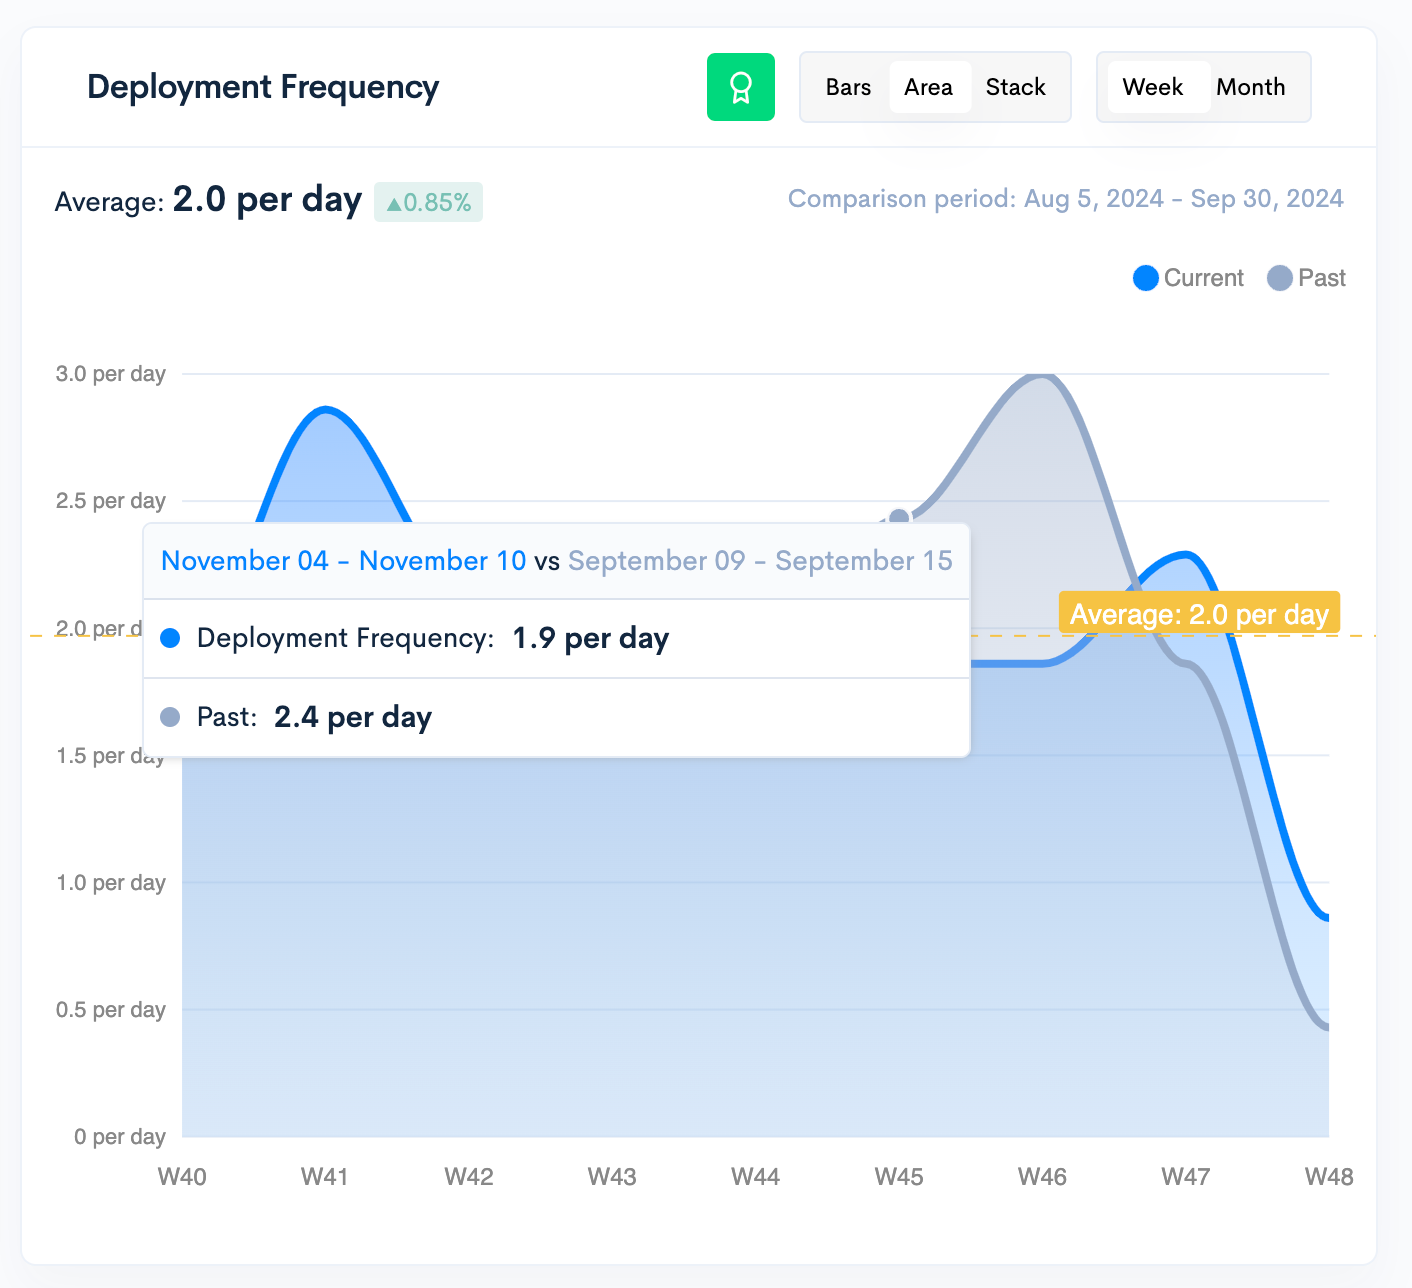
This metric measures how often a team releases successful code into the production environment. In other words, the DF metric assesses the rate of engineering teams deploying quality code to their customers, making this a very important means to measure DevOps teams’ performance.
The deployment frequency of releases depends on several factors, such as the tasks given or the deployment size. Teams that follow DORA DevOps metrics best practices usually work with tasks broken into smaller batch sizes to make the deployments more frequent. Depending on the task at hand, some teams may deliver once a week, while high-performing ones have deployments a few times a day.
Waydev tips and best practices to increase Deployment Frequency within your organization:
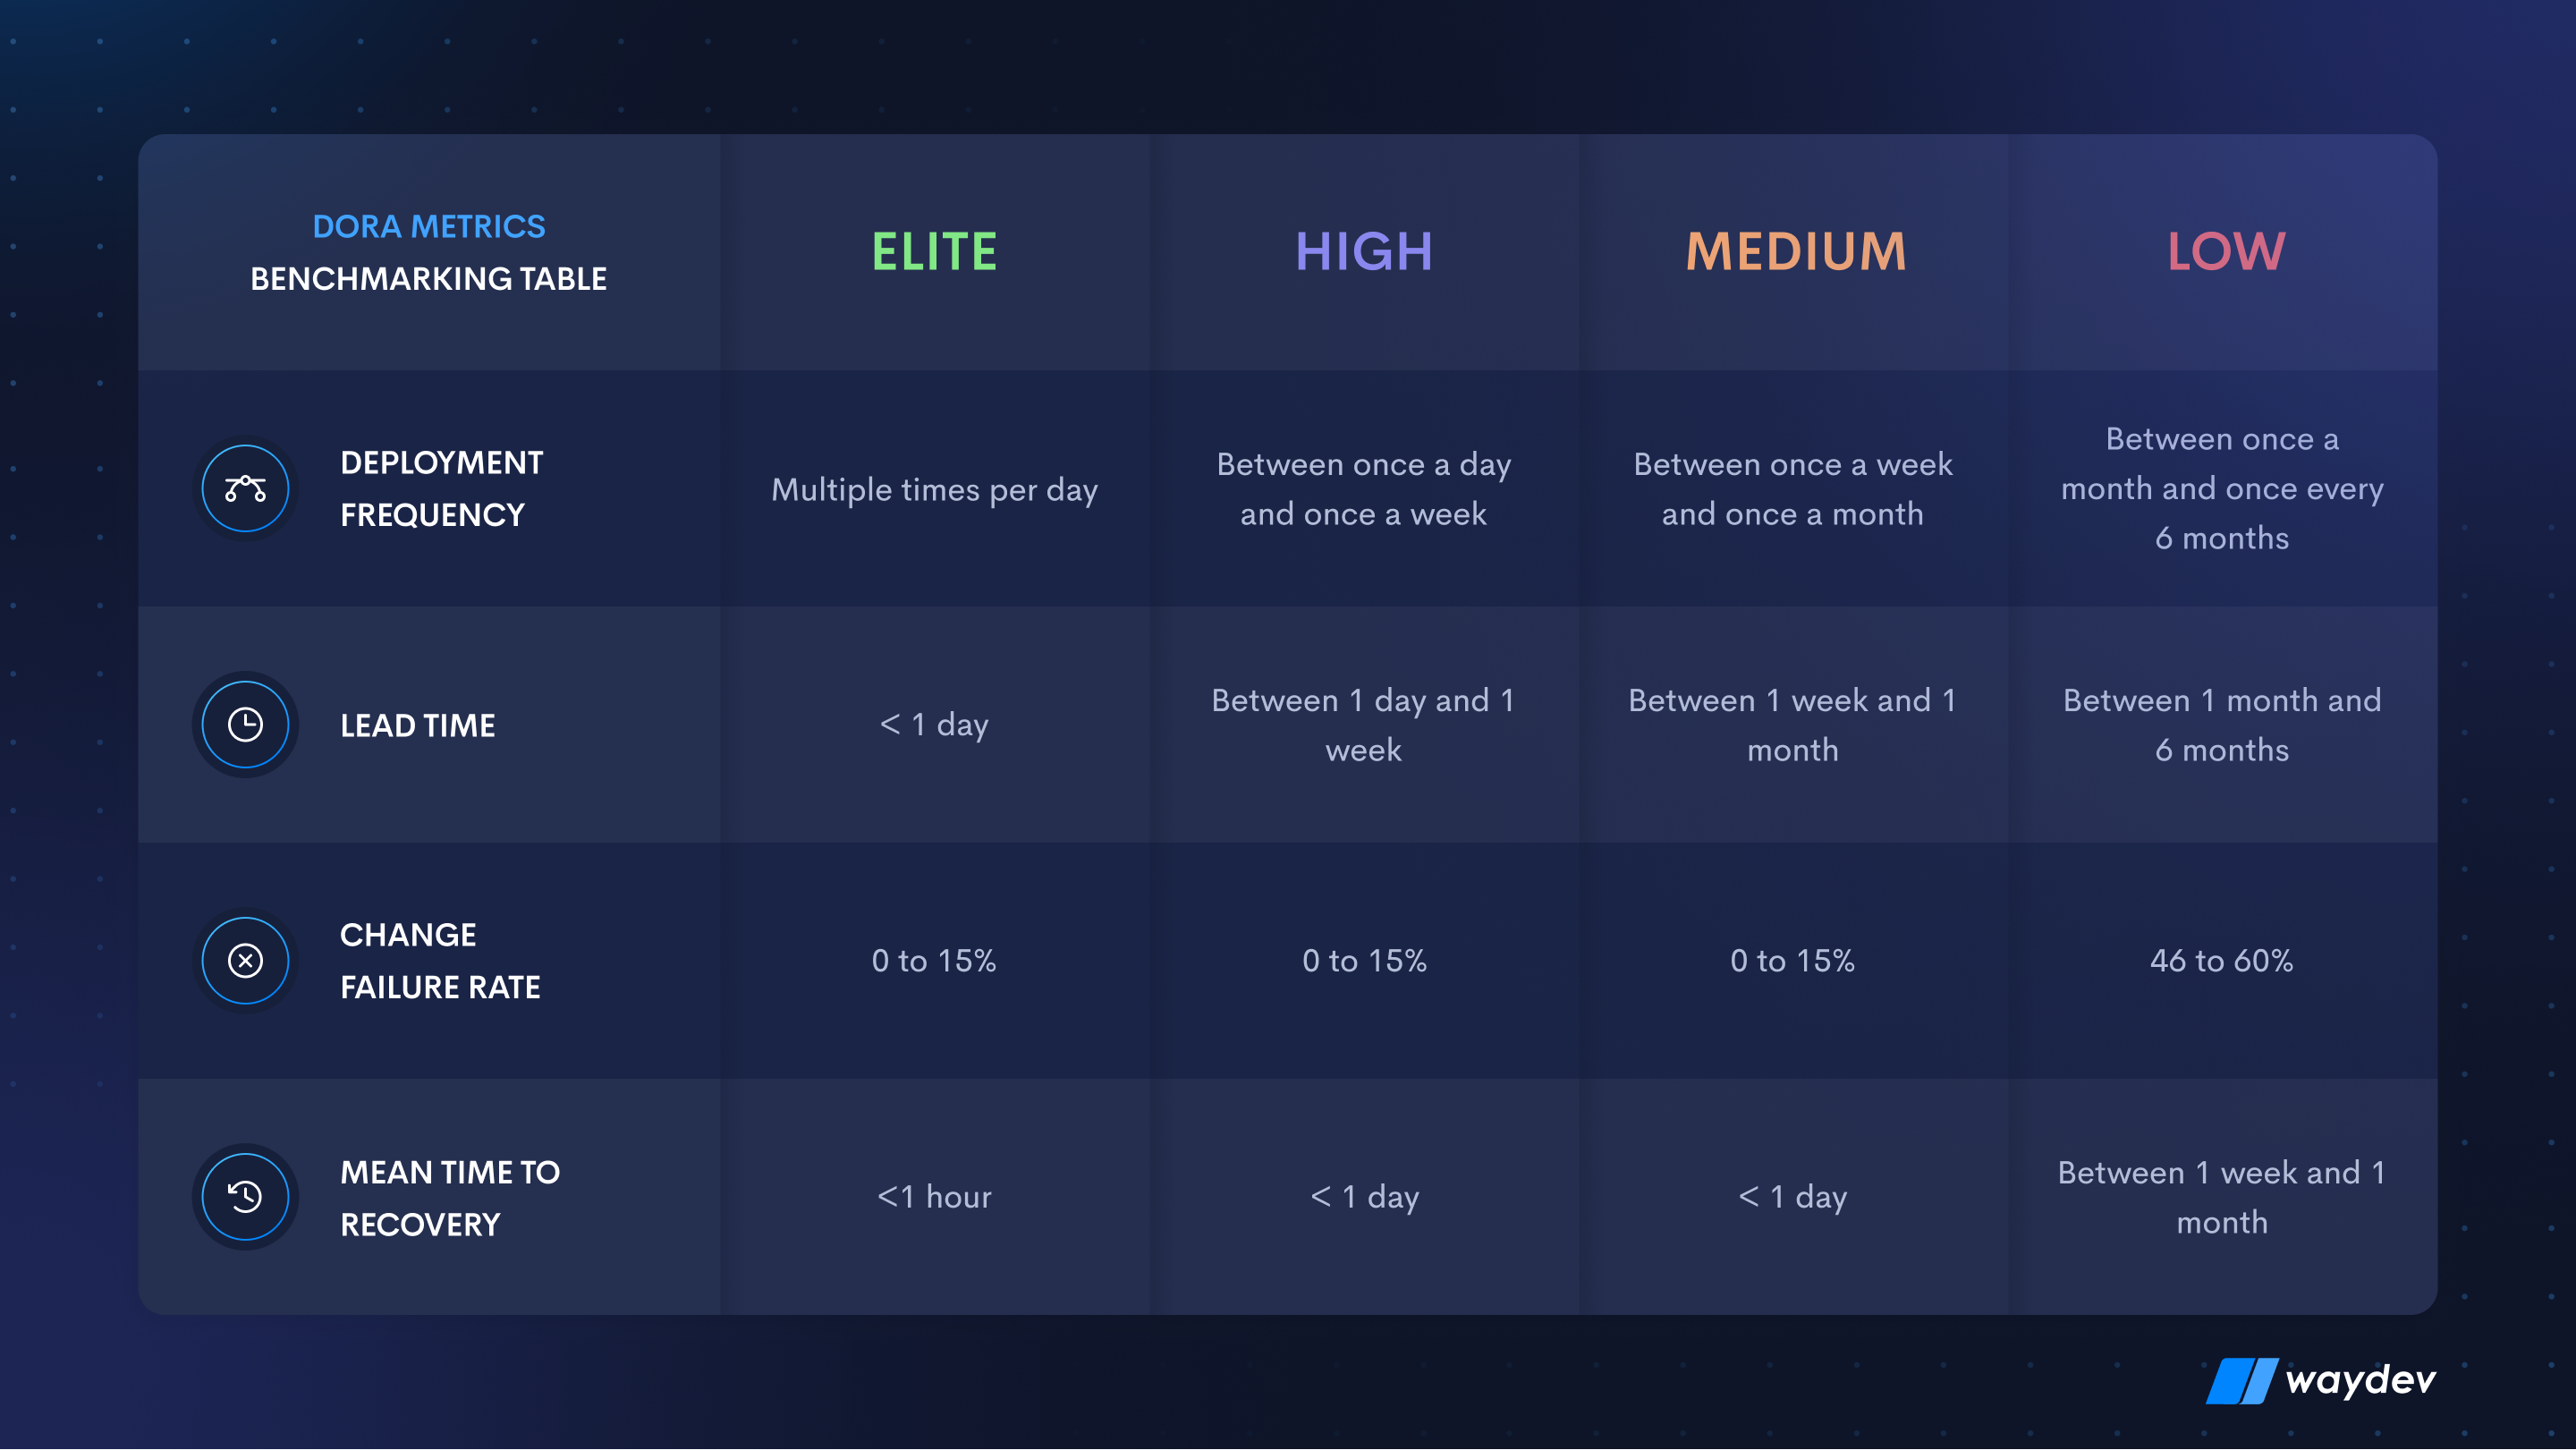
Industry values for Deployment Frequency:
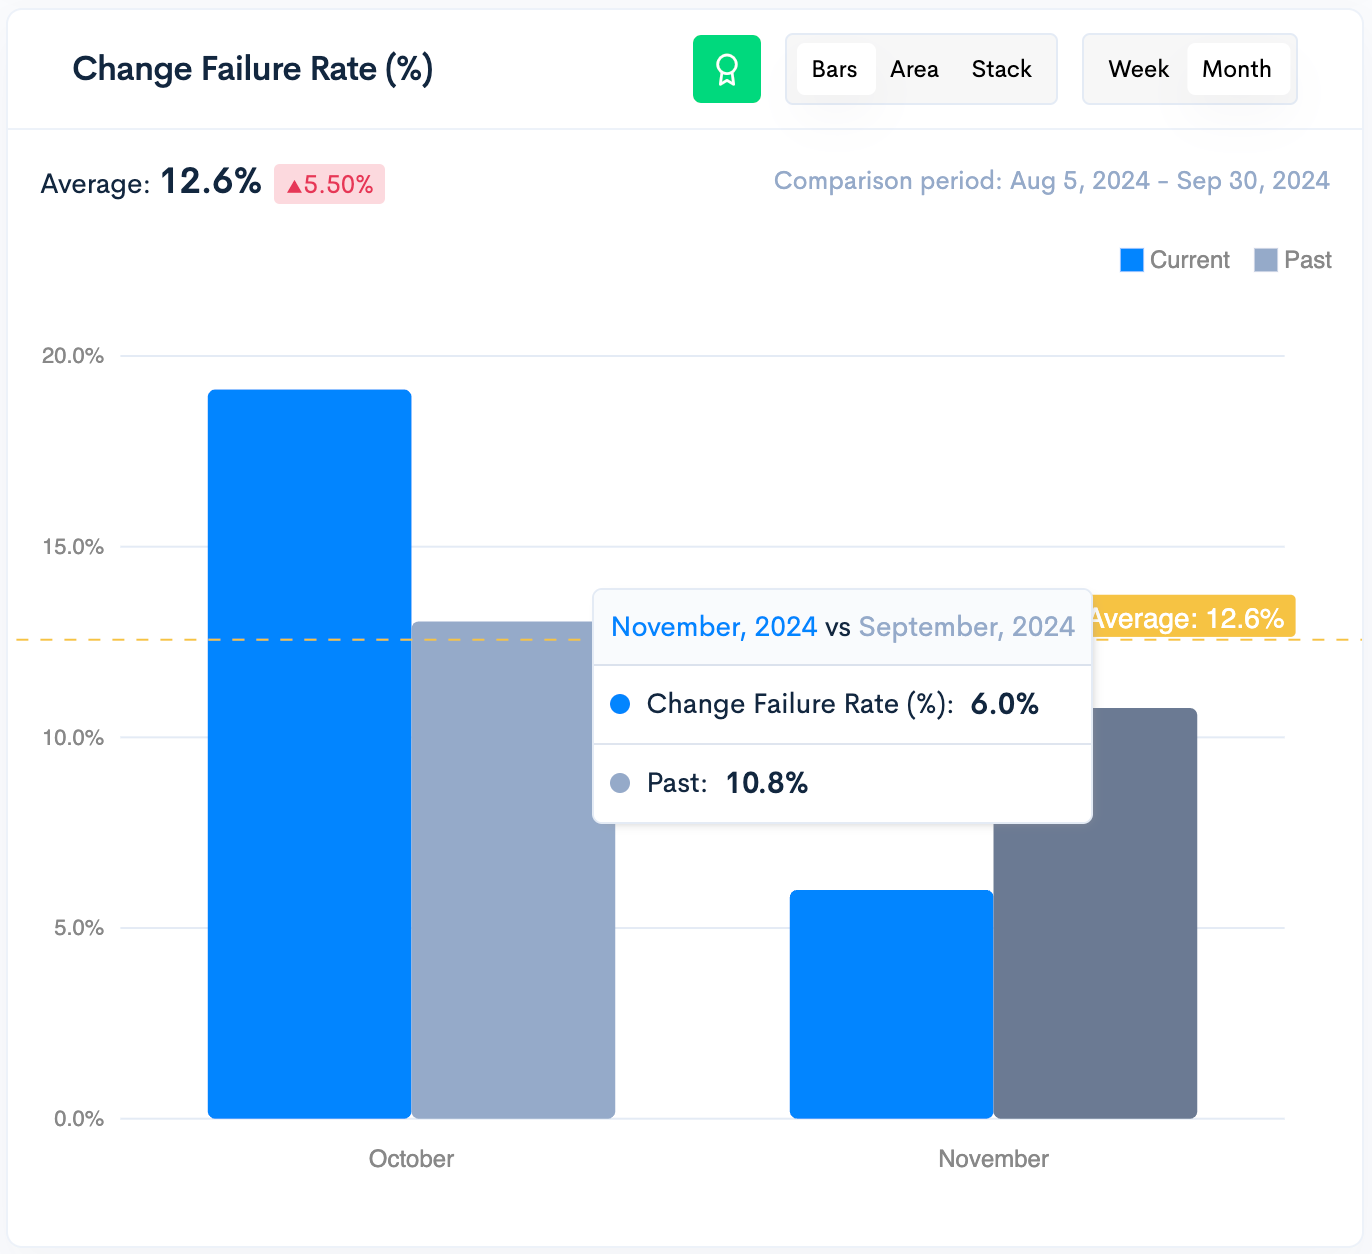
Change Failure Rate is a percentage metric that measures how many changes released to production result in failures defined as downtime or serious issues. This metric does not factor in changes that did not make it to production due to failing testing before release. As such, the outcome may be impacted if these changes are considered.
Measuring CFR will help you understand the potential pitfalls that result in wasting resources, such as engineers’ time to fix the issues. You can decrease the Change Failure Rate by setting automated testing that runs with a certain frequency and doesn’t skip steps that manual testing could. This way, potential issues can be identified and managed faster before they are released to production. Measuring Change Failure Rate means measuring code quality, which is a crucial point to cover regarding DevOps teams’ performance.
Industry values for Change Failure Rate:
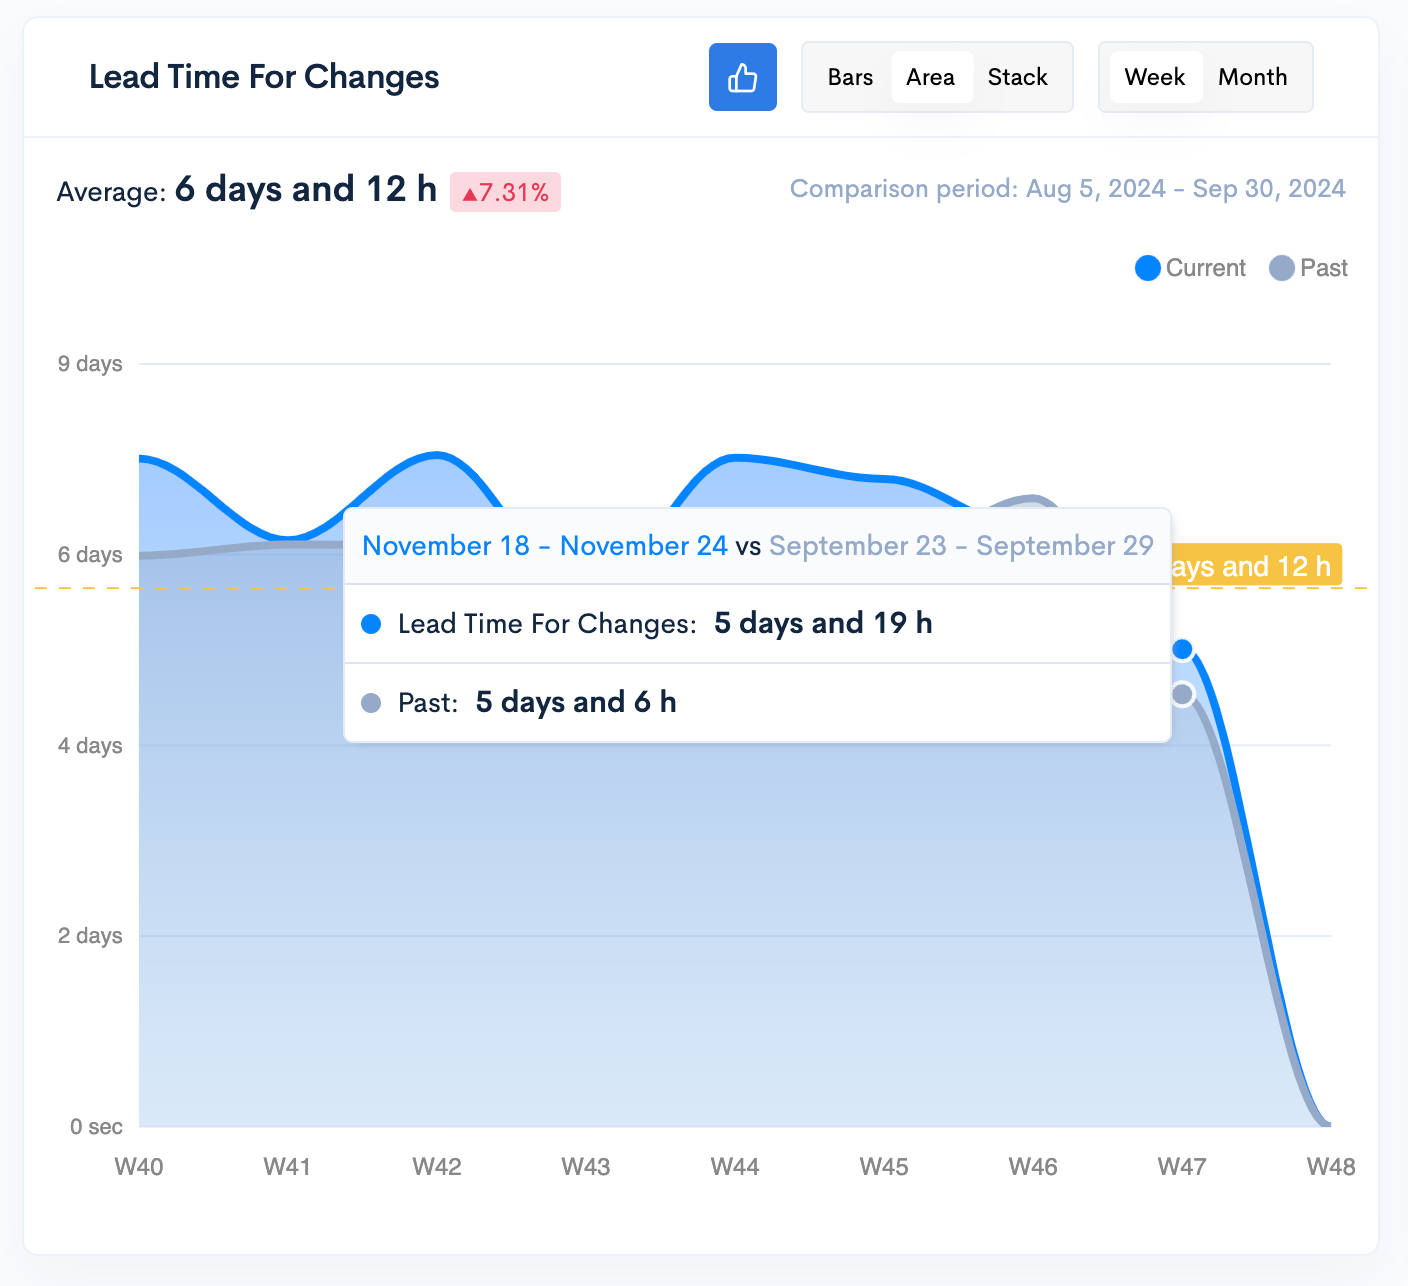
Lead Time for Changes is a velocity metric that shows how long a commit takes to reach production. Lead Time for Changes measures how much time passes from the first commit made until that change is released. It’s a great way of assessing the effectiveness of the deployment process and DevOps cycle time, which are important performance indicators.
The less the value of LTTC is, the higher the team’s performance responsible for implementing it. When the time between the first commit and release is too long, this can indicate certain issues, such as bottlenecks that delay deployment or an inefficient workflow. A long Lead Time for Changes can harm your organization, resulting in customer dissatisfaction and low competitiveness in the market.
Waydev insight into how to decrease Lead Time for Changes:
Industry values for Lead Time for Changes:
The goal here is to assess how efficient DevOps teams are in solving issues when they arise; identifying the problem fast and responding as quickly as possible are indicators of high-performing DevOps teams.
It is crucial to prioritize the velocity and quality of code commits and promptly address any issues. This can be achieved by implementing reliable real-time monitoring tools to detect issues. Developing a pre-established quick-response action plan can minimize downtime and is a best practice for high-performing DevOps teams.
While measuring organisational performance is no easy task, many metrics can provide data to inform an overview. One way of assessing performance in DevOps teams is using the four DORA Metrics that speak about both velocity and quality of delivery.
The Waydev platform aggregates data from CI/CD tools and presents DORA Metrics on a unified dashboard, eliminating the need for manual input. By measuring delivery velocity and throughput, you can have a better overview of how effective your team’s deployment process is. This will enable you to see potential weak areas affecting productivity and help you make data-driven executive decisions.
As previously stated, many have tried to define and identify what it takes to have high-performing development and operations teams. However, few have succeeded in identifying the capabilities that drive performance and the DORA group due to using real-life examples gathered from tens of thousands of professionals over the years. They have created a model for improving software delivery performance that can be personalized for each organization’s specific profile and needs. There are many benefits to applying the four DORA metrics to gather data as a basis on which to improve DevOps performance in your organization, and here are some of the main ones:
1/ DORA Metrics can be used to understand the current efficiency status in successful delivery regarding velocity, quality, and stability of released code. This will give executives a sense of where their teams’ performance is and help identify the areas where there are bottlenecks. Identifying an issue is the first step to addressing it, so you now have the necessary data to set goals for improvement and work on optimizing performance.
2/ Staying competitive – the tech industry is ever-growing, so it’s important to understand both industry trends and where you need to be in delivering value quickly to your customers. This is why you need to measure your DevOps teams’ performance and see how it compares to others in the industry. Is the current performance status helping you stay relevant in the market, or are problem areas holding you back?
3/ Optimizing performance will bring value to your business’s financial and non-financial areas. Better and faster delivery means added value for customers, less time and resources spent on fixing issues, and more visible progress on software products and reaching business goals.
4/ Having clear data on performance using DORA Metrics means having a solid basis for data-driven executive decisions. Taking action in a dynamic work environment can drive progress and scale your business.
5/ Constantly assessing DevOps teams’ performance can create a more motivating work environment by stimulating team members to strive for better results. This entails identifying work practices that create delays and finding ways of overcoming them.
While applying DORA Metrics to understand and improve DevOps team software delivery performance has many undeniable benefits, it also comes with its own challenges. Understanding how to identify data regarding performance and being able to put it in context and adapt it to your organization’s profile is key. Here are some of the pitfalls that can arise when using DORA Metrics:

Using DORA KPIs to evaluate DevOps performance comes with challenges and benefits. The right approach can revolutionize how we measure and predict delivery performance. Waydev simplifies the development process by aggregating data from your CI/CD tools, presenting it on a single dashboard, and eliminating the need for manual input.
This enables organizations to have a clear overview of their team’s delivery performance and identify areas for improvement. Utilizing Waydev’s DORA metrics dashboard will provide valuable insights to inform decision-making and drive continuous improvement in software delivery performance.
To learn more about how Waydev can assist your organization, contact us!

😍 You May Also Like: Agile Release Management Process 🔥
Ready to unlock your SDLC productivity?