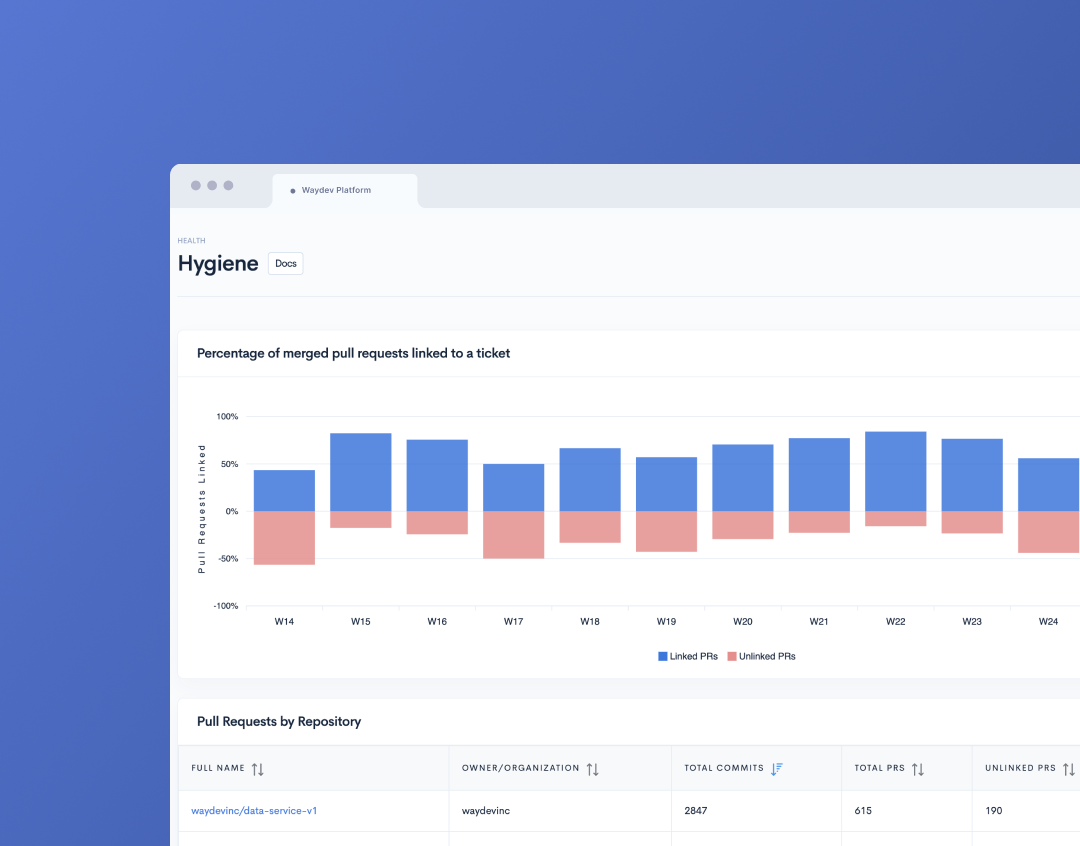
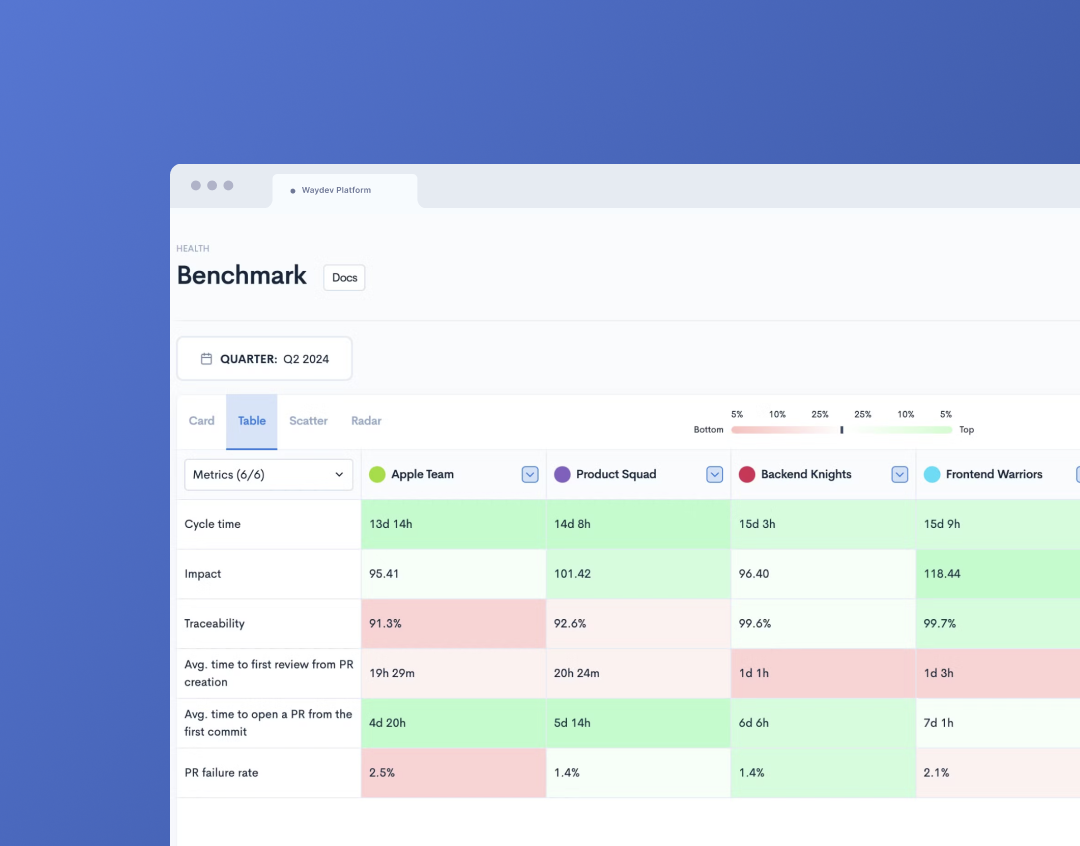
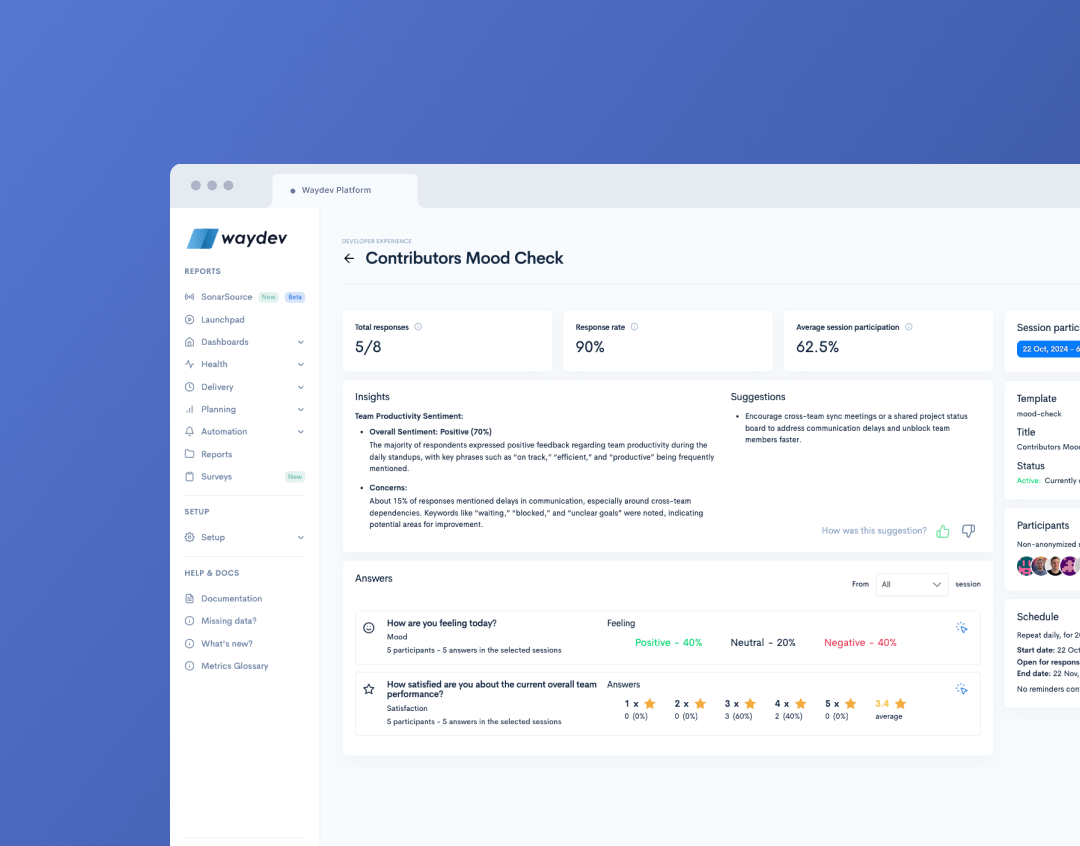
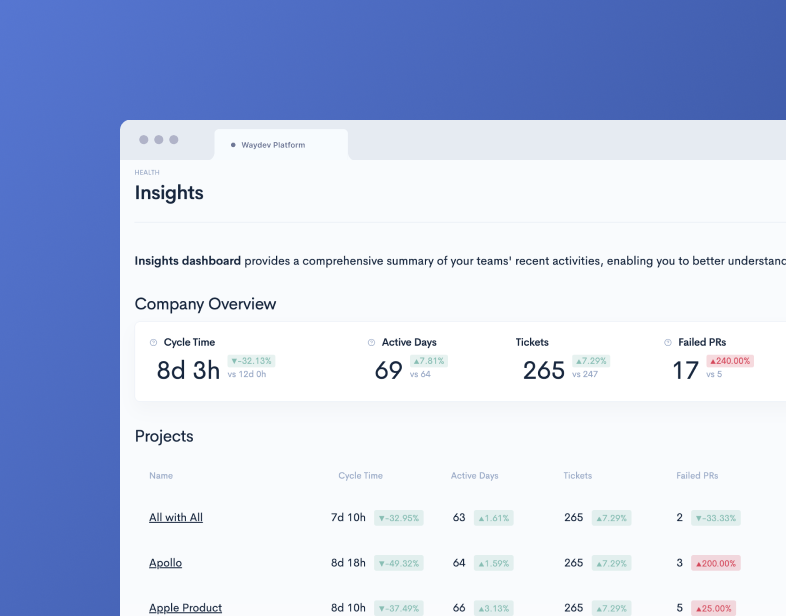
Features
Move from a feeling-driven to a data-driven measurement of your developer team’s work alignment with business goals.
Waydev gives you the right set of metrics and tools to automatically track, measure and optimize your engineers’ effectiveness and productivity, without their manual input.
Being productive is more than just getting more things done in less time. Even if measuring developers’ productivity is not exactly a walk in the park, it’s not impossible either. It can be measured, tracked and improved with a data-driven approach, just by using the right metrics and reports.
Reports:
Track the evolution of your team’s velocity sprint over sprint. Find out where yesterday’s work focus went and direct your efforts to accomplish your goals.
How to use the Daily Update
The Daily Update is a great way to communicate with the team as a source of transparency and also to prompt the manager or scrum master to realign expectations with key stakeholders. The Daily Update is most commonly used in daily standups and can quickly help your team surface discussion around blockers in the code they are working in.
The Daily Update report includes a breakdown of commit activity across our four work types:
It’ll help you identify opportunities for coaching, cross-training, and praise, so you can consistently grow a healthy and high performing engineering team. It can also help you schedule a block of time on your calendar before each standup, so you can get in the habit of reviewing these reports before the meeting and having them open on your device and ready for discussion.
Quickly spot and eliminate blockers that are holding your team down and gain a better understanding of work patterns, progress over time before entering a one-on-one.
How to use the Developer Summary
The Developer Summary report shows a condensed view of an individual’s core metrics and output, which is particularly useful to help you understand the shape of an engineer’s week or month across all work types. You can see engineers’ core code metrics, a breakdown of their commit risk, work focus, a timeline of their commits, along with the risk and work focus assigned to the commits.
One of the toughest and most important responsibilities in engineering management is asking great questions and communicating the actionable answers. With the Developer Summary, it’s now possible to have a better understanding of what’s going on before you enter a one-on-one, so you can spend less time talking about what’s going on and more time talking about the why, which might shine a light on opportunities where you could help and when you’re advocating for a specific individual on your team.
Developer Summary metrics:
Some of the questions we ask when looking at risk are: ‘How big is this commit? Are the changes tightly grouped or spread throughout the code-base? How serious are the edits being made — are they trivial edits or deeper, more severe changes to existing code?’
View a heatmap of engineers’ activity and schedule meetings according to data, to enable a nondisruptive engineering flow.
How to use the Activity Heatmap:
You don’t need another study to confirm that engineers are most productive when they work in big blocks of time – this is why Visualize engineering activity through a heat map to find out what is their golden hour in terms of productivity.
The Activity Heatmap report includes metrics such as:
Achieve a continuous delivery workflow and make sure each of your engineers is involved in the development process.
How to use the Activity feature
Monitor the Activity report to spot any possible outliers, such as an engineer not committing code for more consecutive days, or an engineer who constantly works on the weekends. Use this data to start productive conversations and adjust workload accordingly.
The percentages on the top of the columns represent the ratio of inactive engineers to total engineers. For example, on Monday, 17 Feb, 22% of the Back-end team’s engineers did not commit any code.
The colors range as below:
Developer productivity might be considered hard to measure, but it is not impossible, and finally, measuring it improves efficiency, speeds up product development and drives up productivity considerably.
Ready to improve your teams' performance?