


Delivery
Pull Requests Insights
Gain complete visibility into all Pull Requests within any timeframe through a single, intuitive dashboard. Identify long-running PRs, unreviewed merges, and closed without merges to streamline your development process. Detect risky work and understand your team’s velocity at a glance.
Pull Requests Insights provides a holistic view of your team’s pull request activities, helping you identify areas to optimize collaboration and streamline workflows.
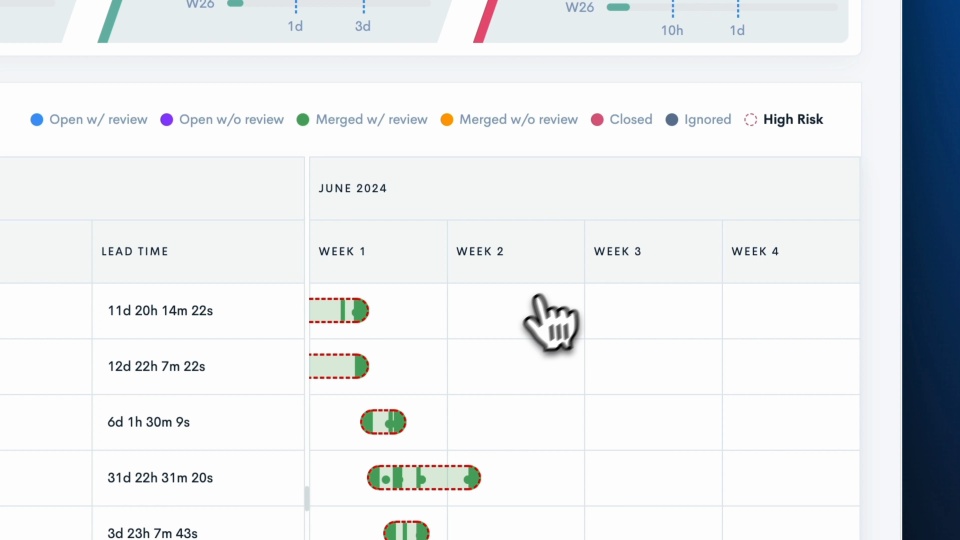
An overview of all your team’s PRs
- Get a clear view of your team’s Cycle Time, tracking progress from the first commit to deployment, so you can see how fast your team is moving.
- Easily track Pull Request activity within a chosen time frame, helping engineering leaders spot long-running PRs, unreviewed merged PRs, and any risky work.

Zoom into your team’s collaboration
- Get an overview of your team’s collaboration, offering insights into the submitter-reviewer ratio, the number of reviews, and key metrics for both submitters and reviewers, allowing you to understand how your team works together.
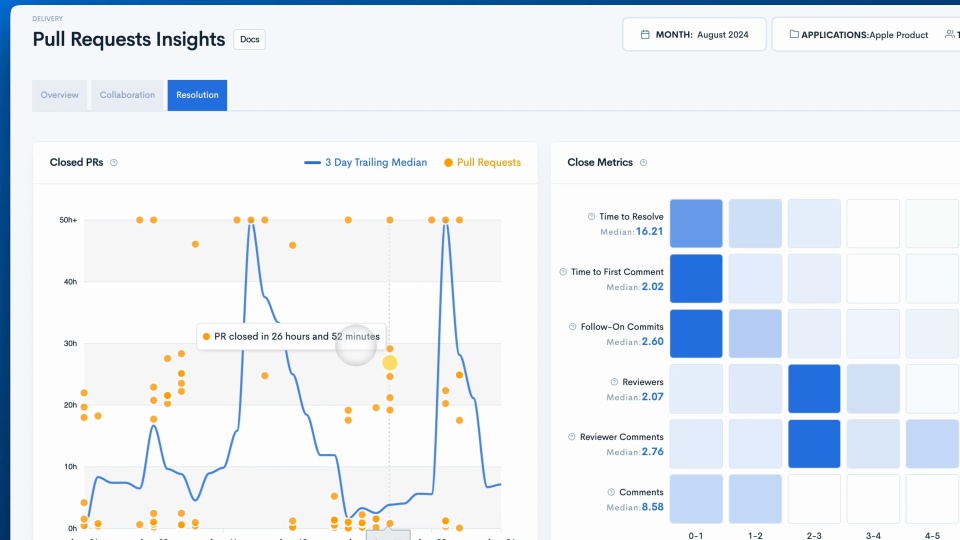
Spot bottlenecks in your team’s code review process
- The Resolution tab provides a map of all closed PRs and associated metrics, giving you insights into your team’s collaboration.
- By clicking on these metrics, you can open a detailed modal view of the pull request, allowing for easy visibility and access from anywhere within the platform.
Trusted by FORTUNE 500 enterprise companies


READY TO ADOPT A DEVELOPER PRODUCTIVITY INSIGHT PLATFORM?