Estimated reading time: 9 minutes
Developer Experience refers to how developers feel about the tools and platforms they use to build, test, and deliver software. Being able to measure DX is crucial to understanding how DX impacts productivity and efficiency, and it’s also vital to find ways to optimize it. While you can conduct surveys to understand the general Developer Experience perception within your organization, keep in mind that the results will be invariably subjective. Team members can tell you their take on their day-to-day processes and struggles, but these are ultimately opinions based on personal feelings or perceptions.
To get a complete view of DX holistically, you also need to add specific software engineering metrics that can provide reliable data into the mix. Applying them will show how the ease of using the right tools, platforms, and processes translates into developers’ productivity.
Waydev is an engineering management platform that can provide valuable metrics to assess Developer Experience within your organization and how it impacts development teams’ performance. With complex measurements of both quality and velocity of delivery, such as Deployment Frequency, Lead Time for Changes, Code Churn, or Velocity Report, our platform also provides a bird’s eye view on DX, helping you to make data-driven decisions on improving it and scaling your organization.
In order to properly manage software development projects, you need to set up the proper tools, processes, and necessary technologies for taking products from business ideas all the way to delivering value to customers. How the developers working on these projects interact with all these elements will make or break DX.
Providing your developers with the best tools on the market tailored to their needs and methodology will contribute to their experience and overall satisfaction of working within your organization. Setting the proper tools and workflows will contribute to the good planning of workpieces and resources for the success of your projects. In the big picture of the everyday processes involved in developing software, providing a great DX is also crucial for driving progress.
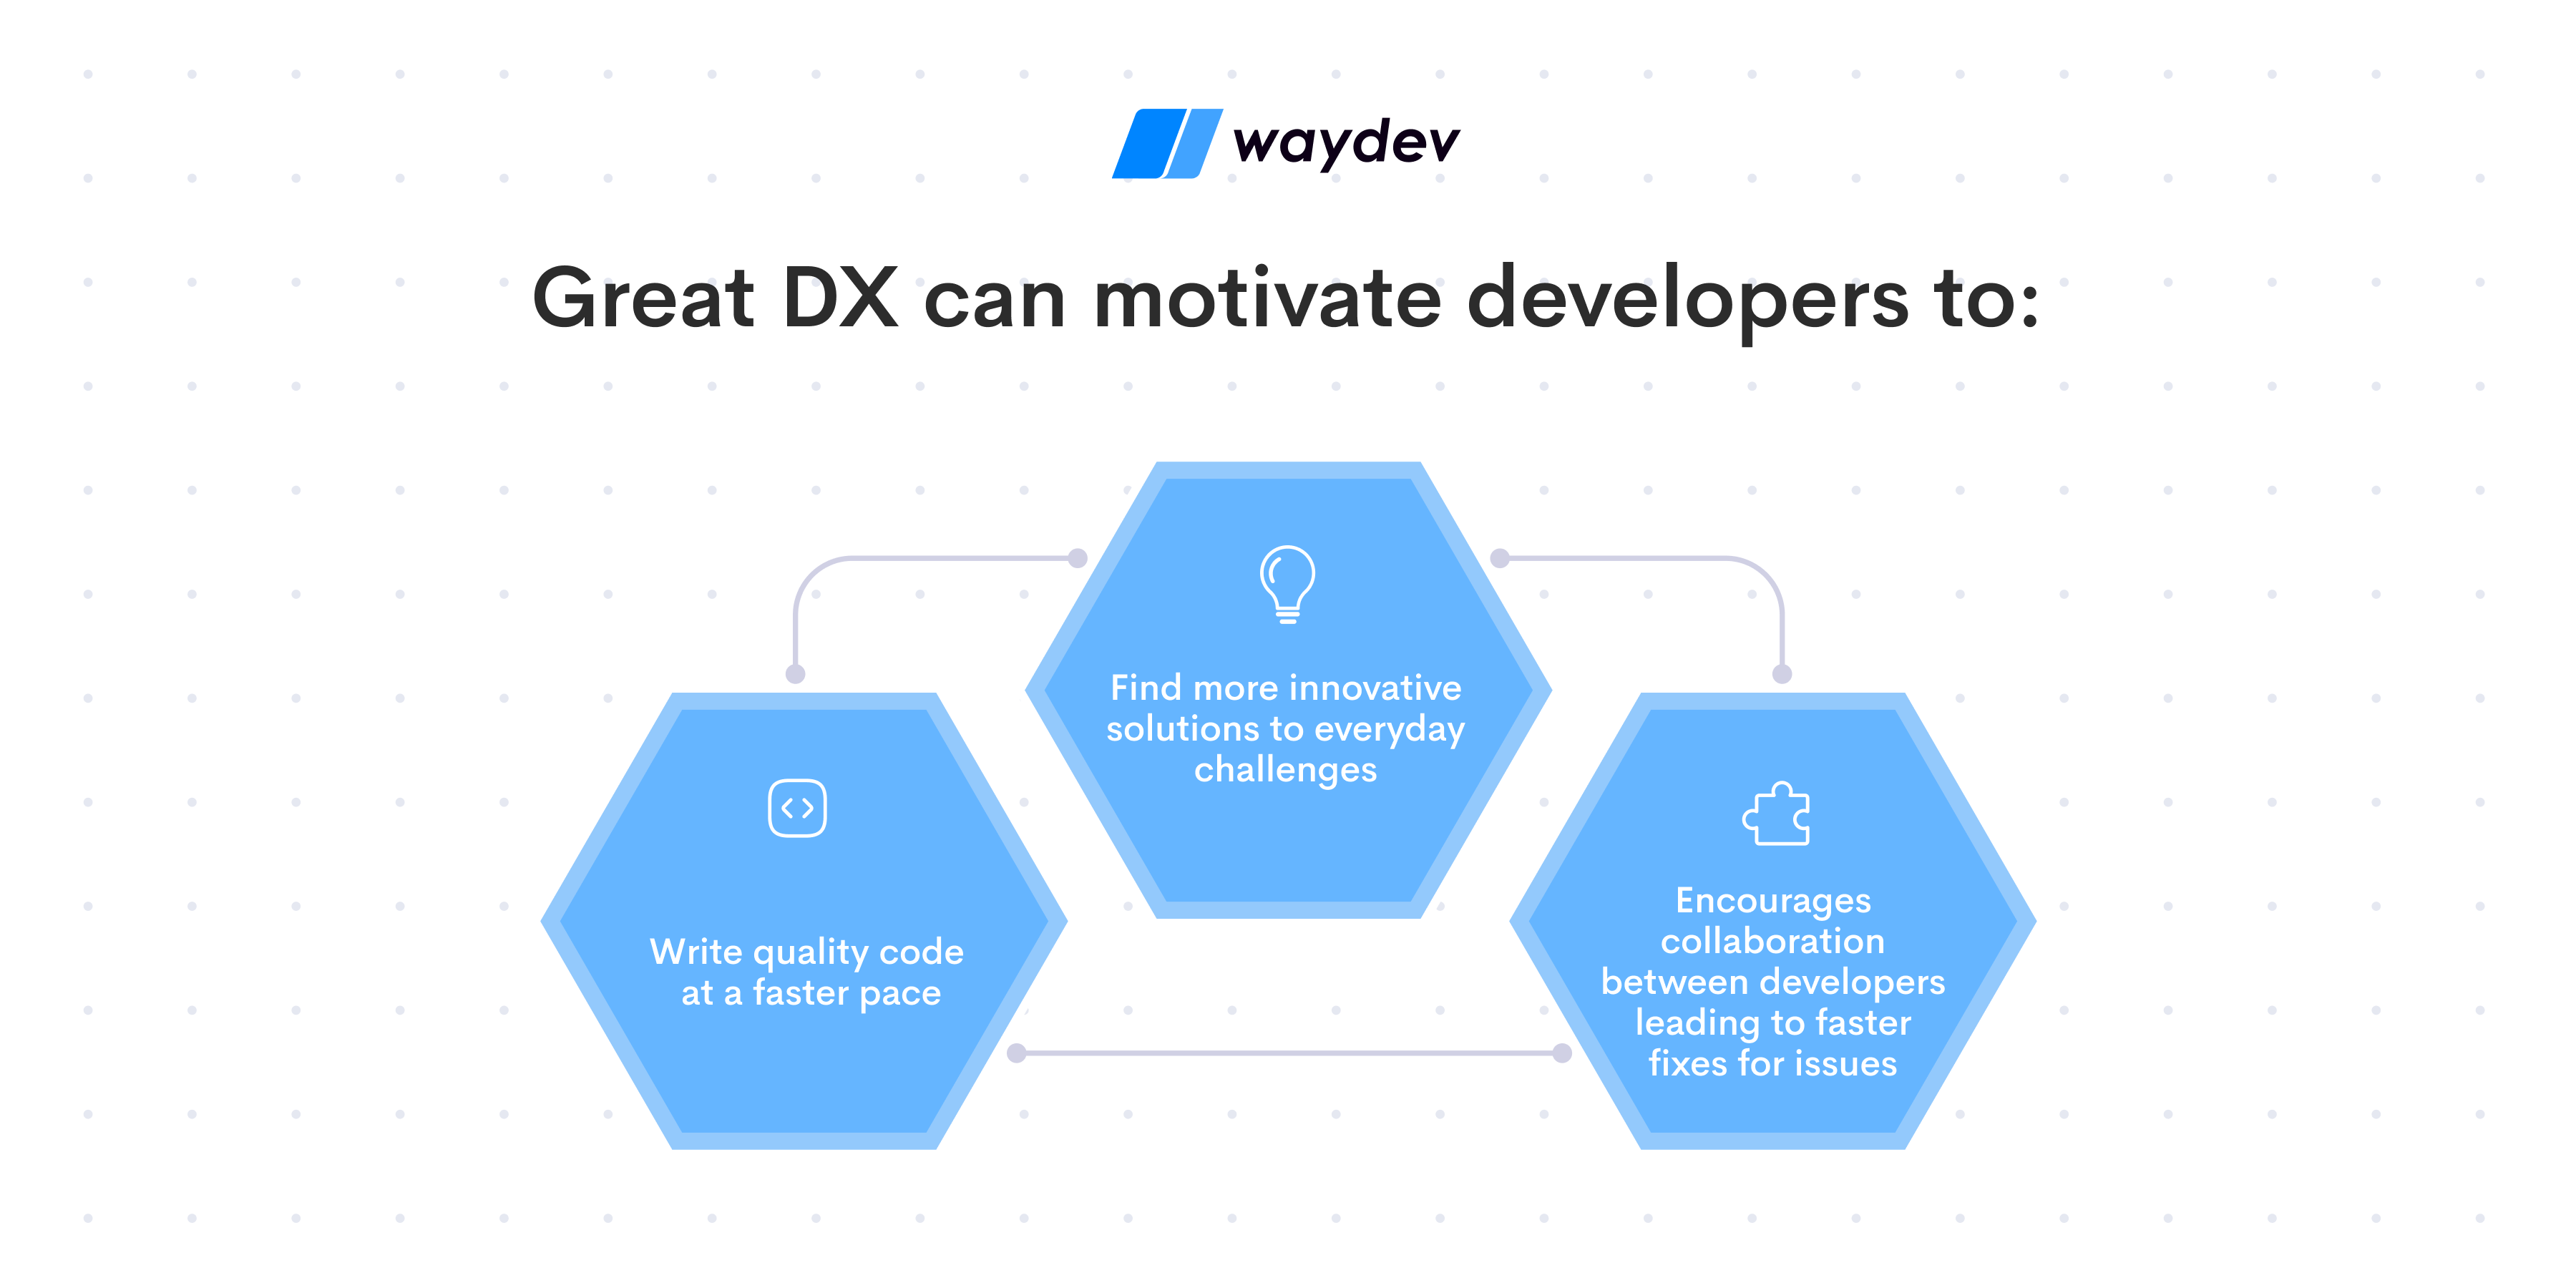
Great DX can motivate developers to:
Measuring DX is essential to understanding it and finding new ways to constantly improve it. Please keep in mind that one metric on its own can’t tell you the full story of Developer Experience and how it translates to productivity. Only when put in context, can these indicators provide an understanding of what it takes to keep developers happy, motivated, and efficient.
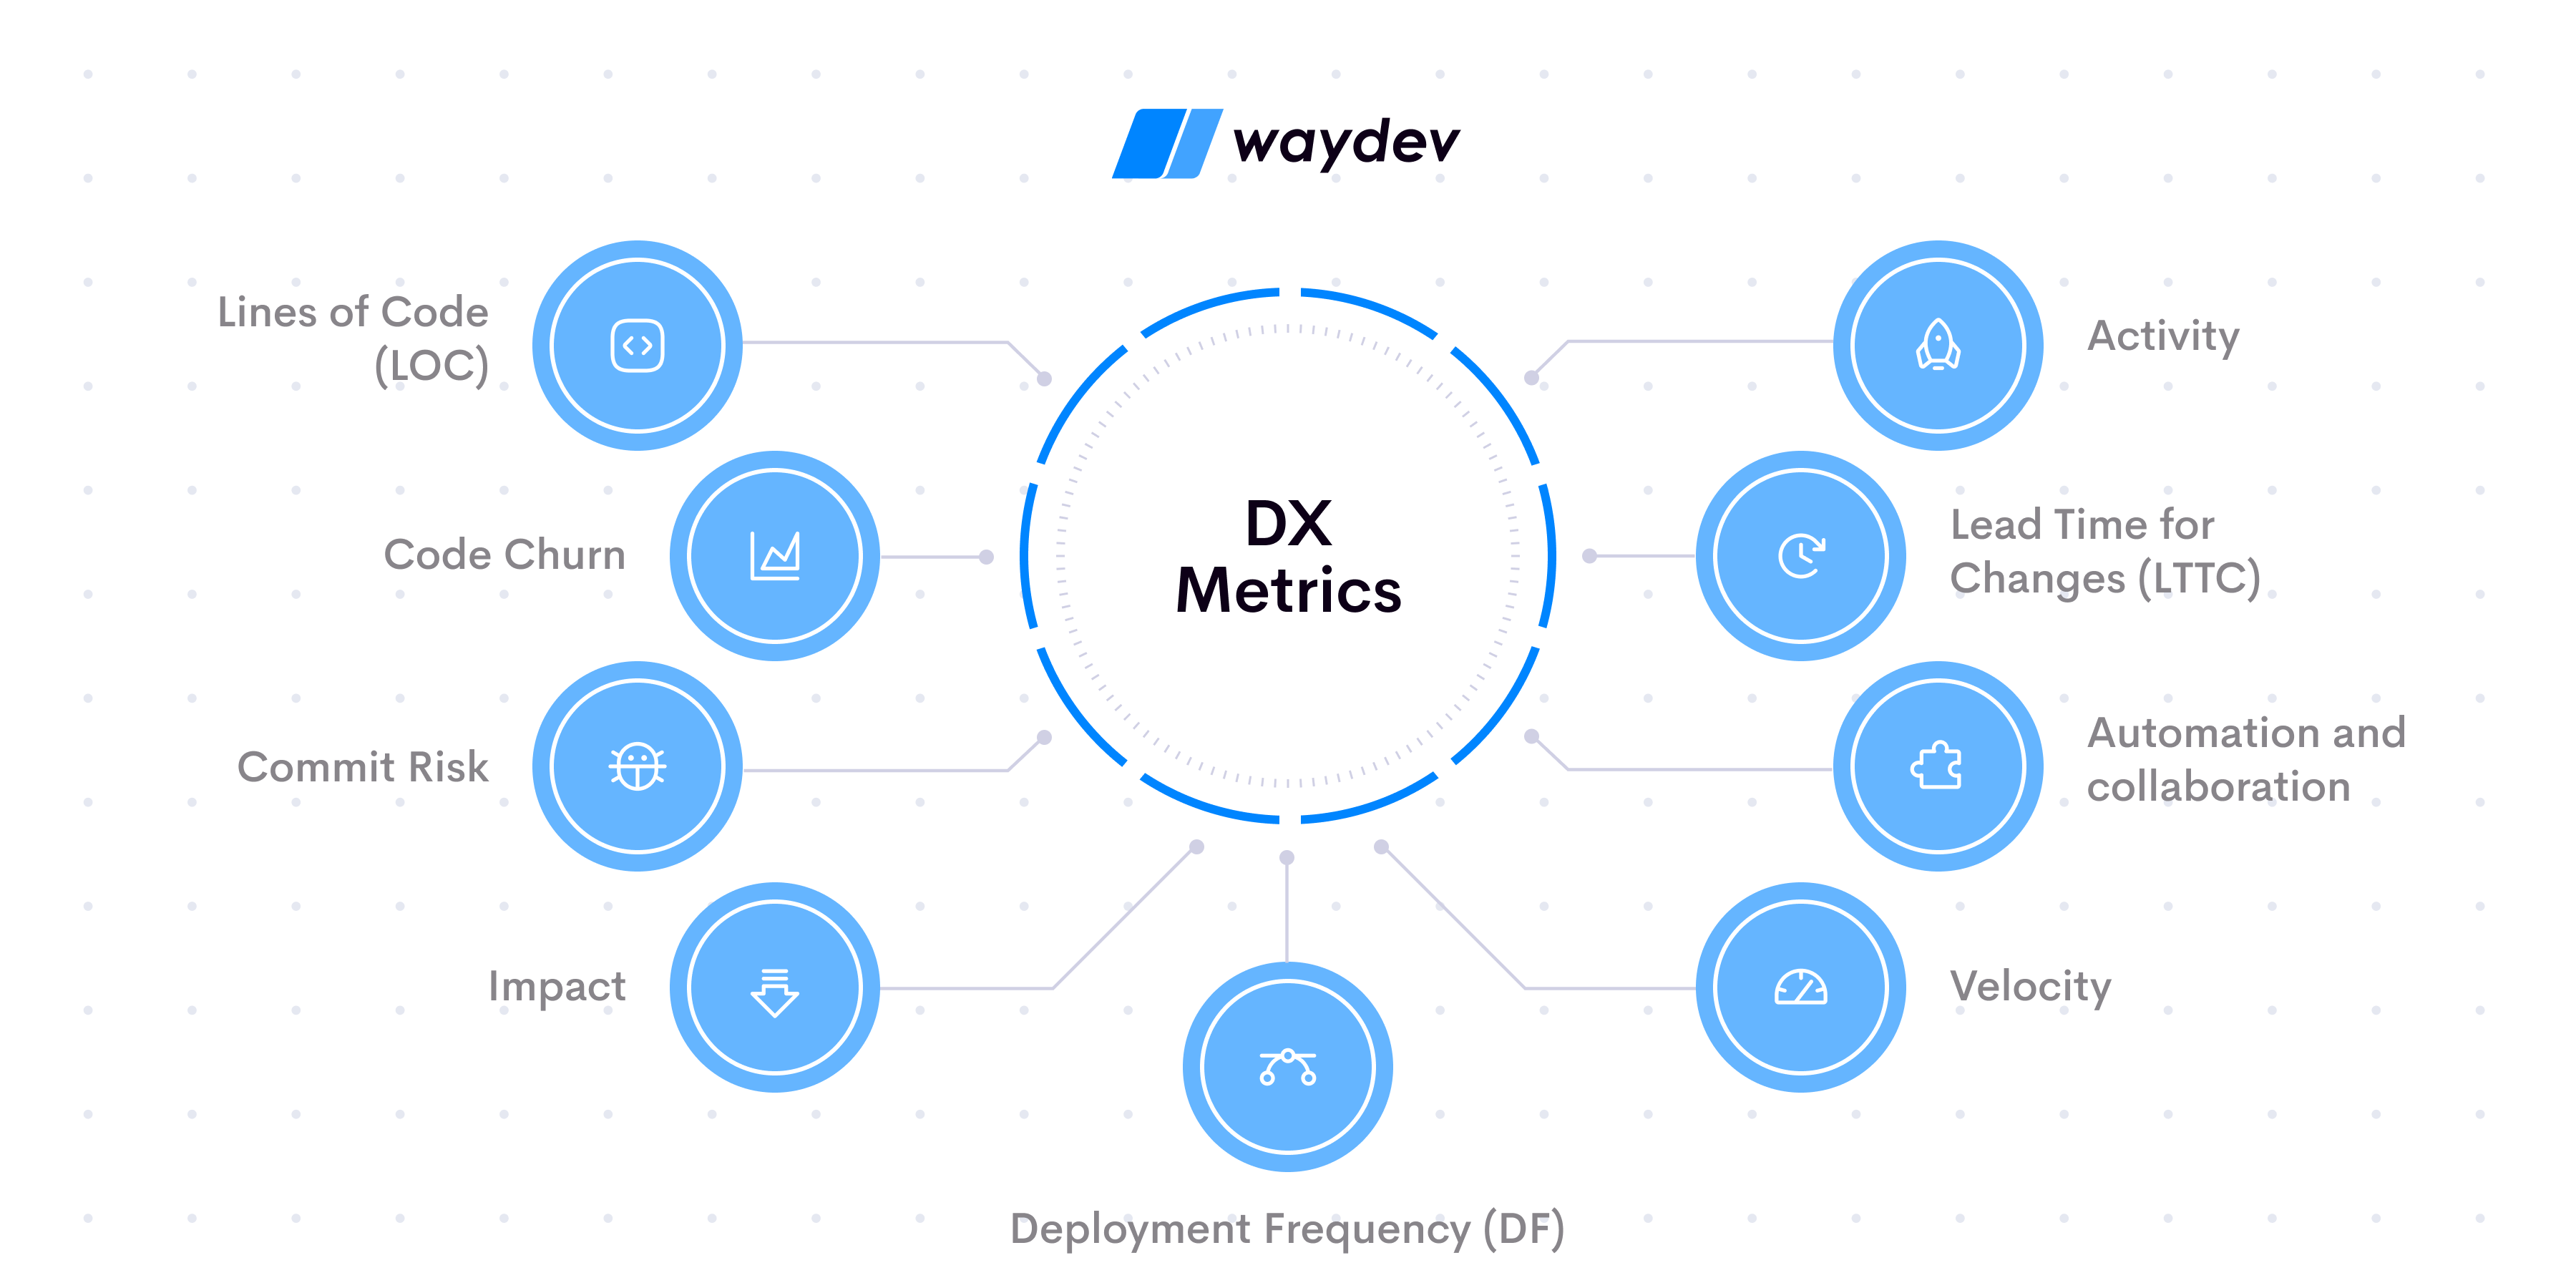
Here is a list of the nine main metrics you can use to understand Developer Experience in your organization or tech department:
Lines of Code is a quantitative metric that defines how many lines of code a developer writes. However, please note that this is not by any means a quality metric, as it also counts the comments on code or rewrites, not just the code itself.
While it has limitations in proving developers’ efficiency on its own, tracking LoC can highlight progress over time, and it has the advantage of promoting automation and cost efficiency. Correlated with other metrics, LoC can give you an idea of the quality of DX in your organization.
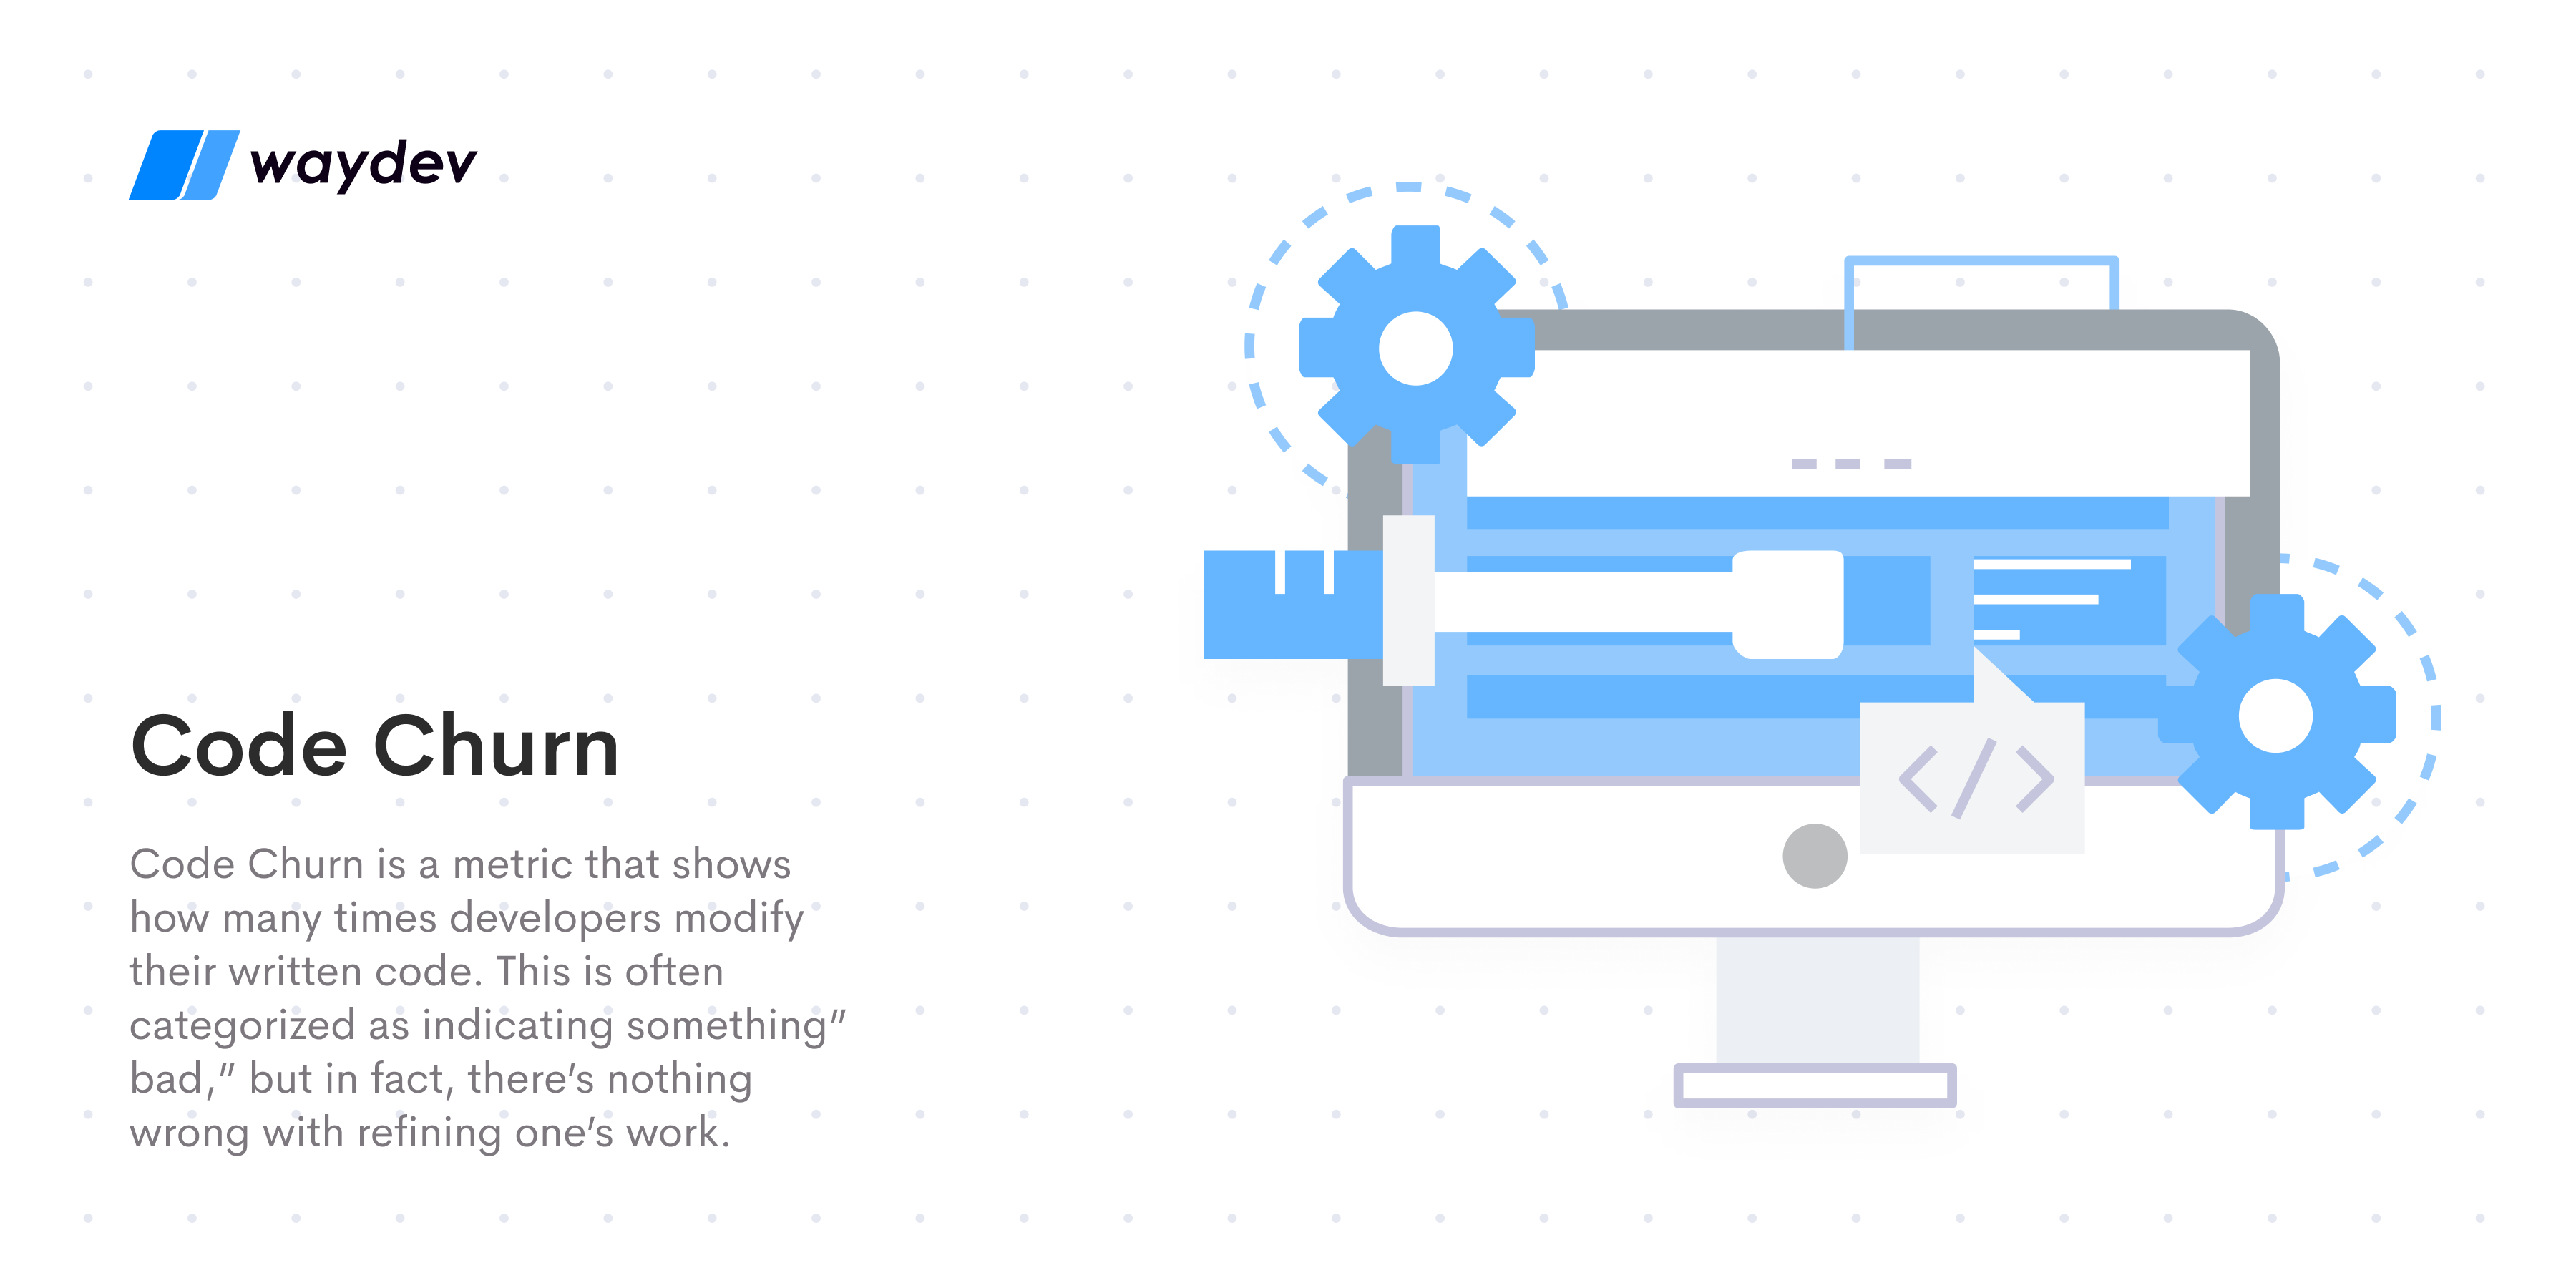
Code Churn is a metric that shows how many times developers modify their written code. This is often categorized as indicating something” bad,” but in fact, there’s nothing wrong with refining one’s work. Having a certain amount of Code Churn is normal throughout the progression of software products.
Code Churn only becomes a problem when the numbers are much higher than the expected amount during a project’s life cycle because it could indicate too much time and resources spent on redoing existing work instead of pushing new code into production. This can indicate low efficiency and productivity among the development teams. By using tools like Waydev that help you keep track of Code Churn, you can identify problem areas and make the necessary adjustments in due time.
Commit risk is a metric that tells you how likely it is for a commit to cause issues. It’s a prediction of bugs or other code problems, and it’s considered quality control over the submitted code. This measurement helps developers focus on potential problem areas and be more efficient in making improvements where they’re needed.
The impact is a measurement of the complexity of code changes in a way that far exceeds the LoC metric. It includes data such as the amount and severity of code changes, the number of files affected, and the surface area impacted. This metric speaks to the contribution that a developer makes to the progression of software. By keeping track of this metric over time using tools like Waydev, you can spot issues in productivity that also impact DX and address them.
Activity reports show you whether developers commit code each day or if a few days pass without any new activity. This metric can tell you a lot about a developer’s workflow and if they have roadblocks keeping them from being productive. Measuring this metric with complex reports also helps you ensure that time dedicated to things other than contributing code stays reasonable.
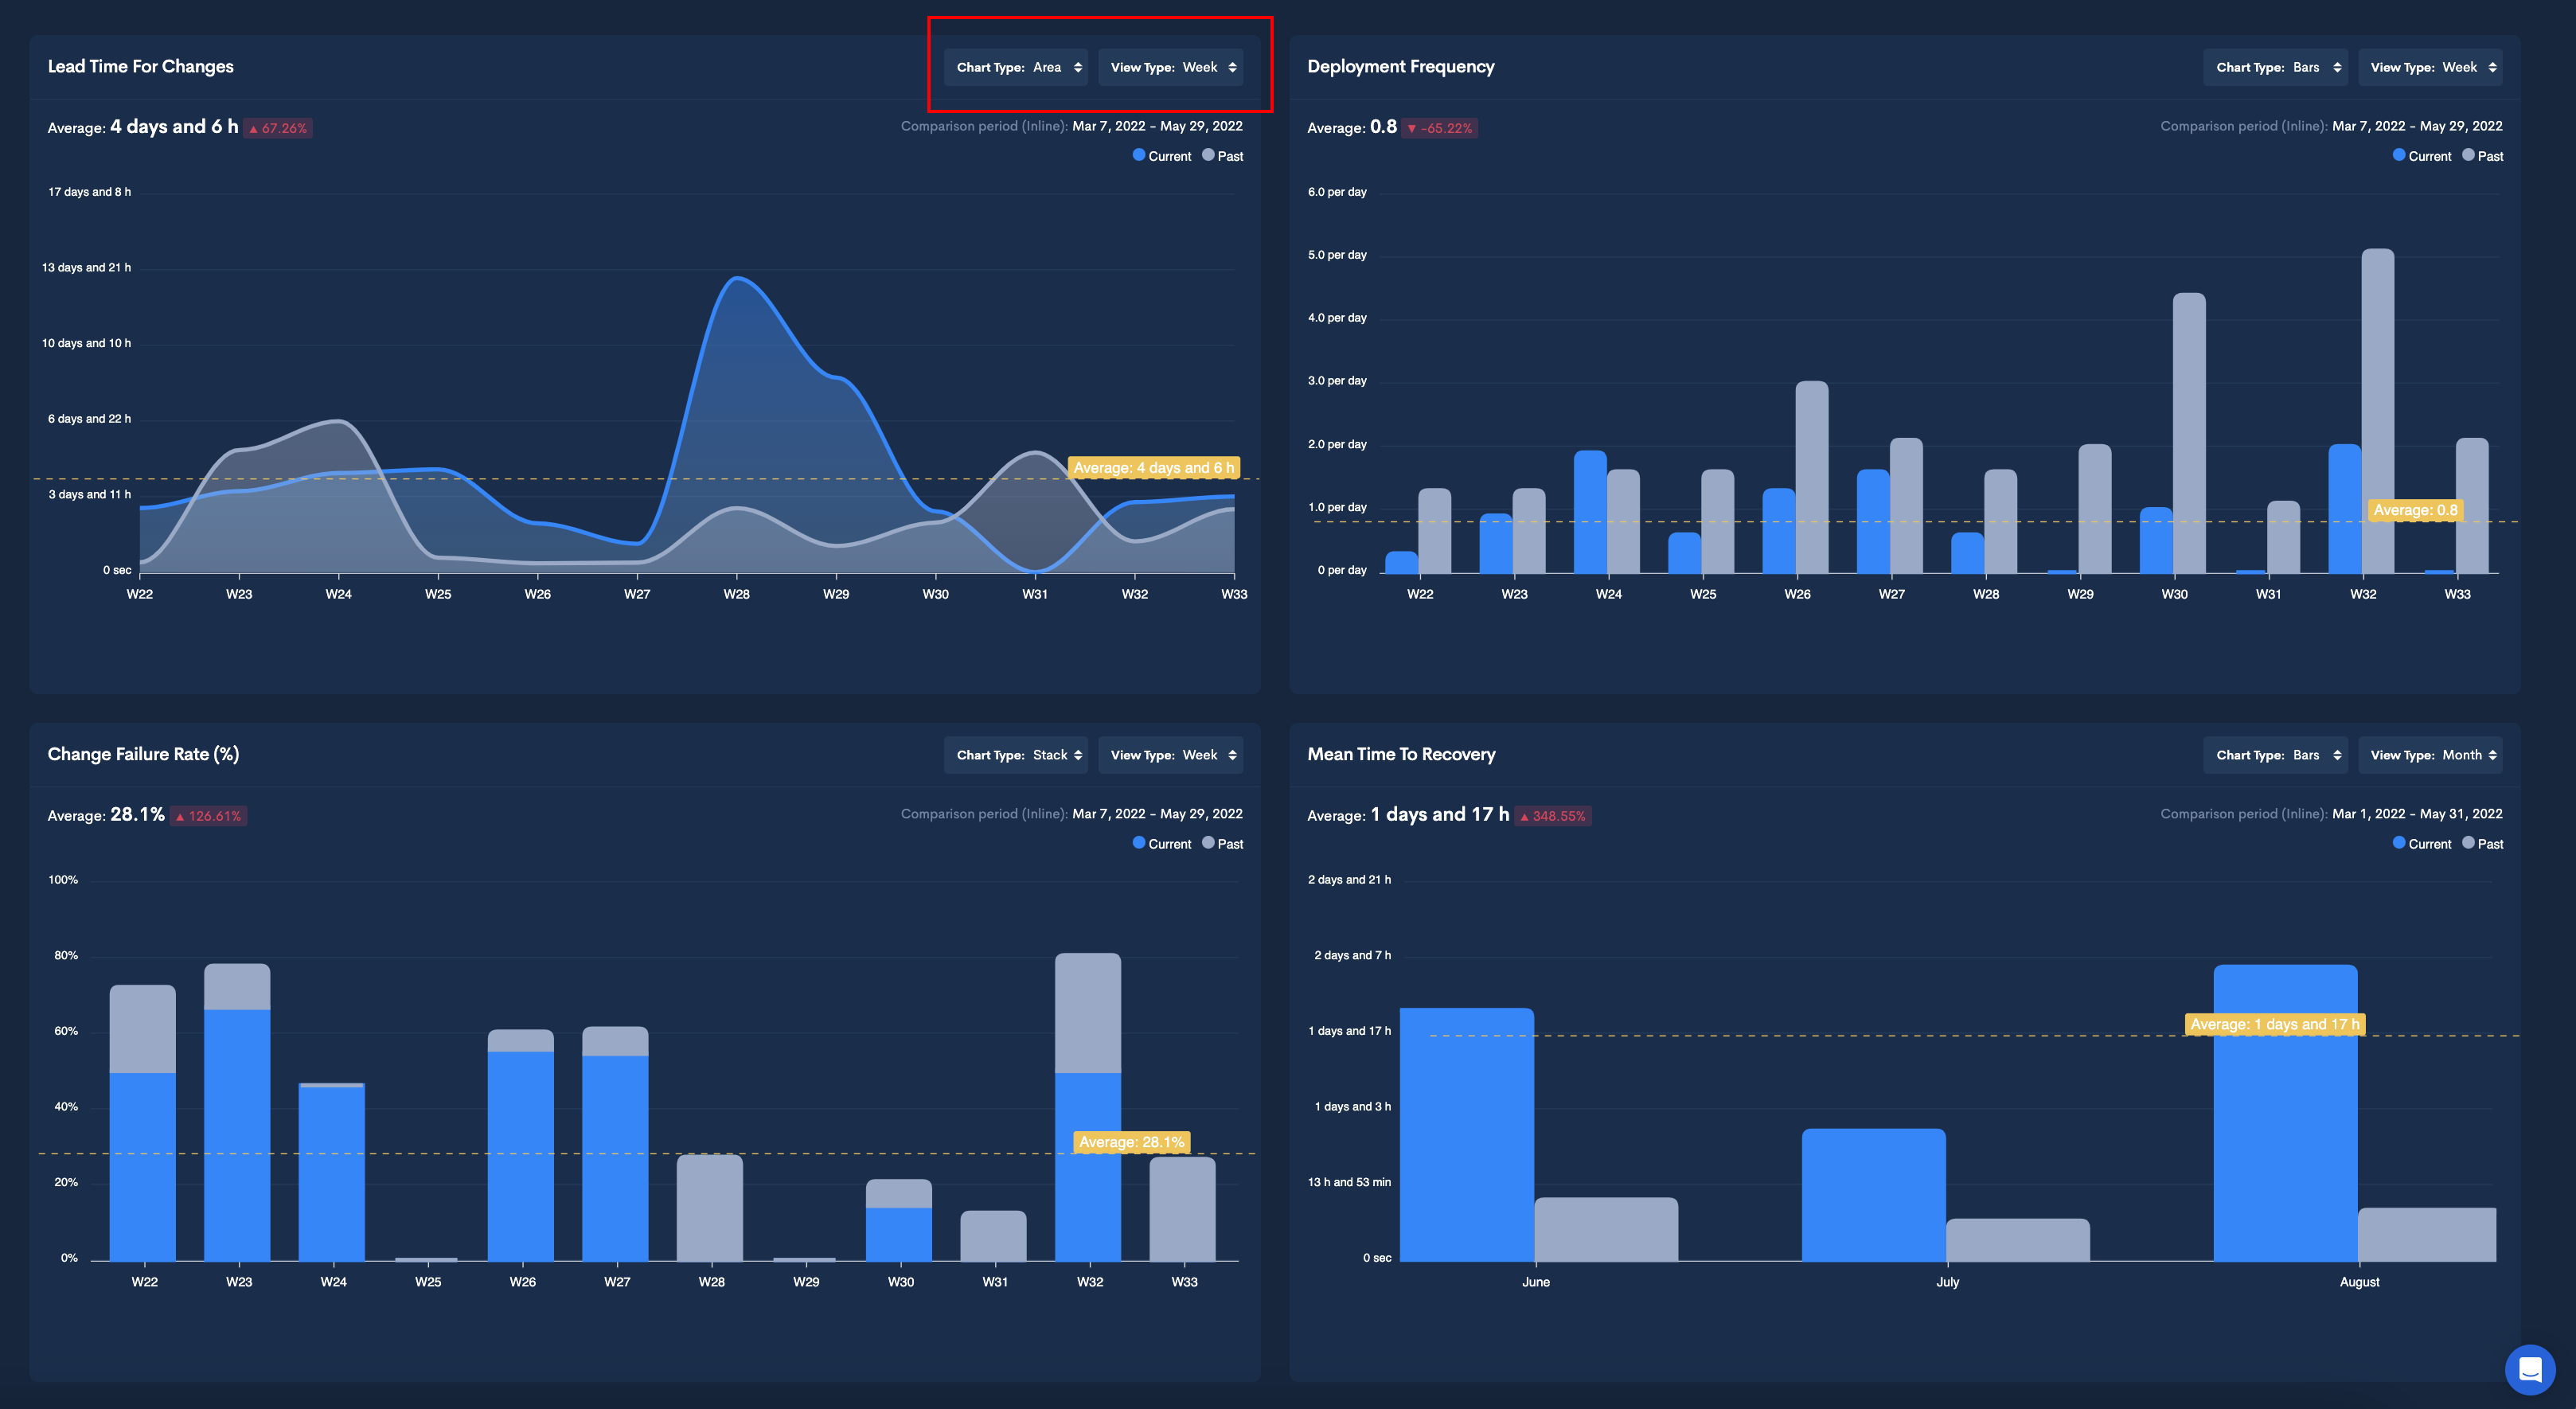
Lead Time for Changes is a velocity metric that derives from the DORA Metrics, a concept that defines and measures developers’ productivity. This particular metric is a velocity one that shows how much time it takes between committing code and sending it to production. If LTTC is too long, this may indicate bottlenecks or other issues that impact the efficiency of the deployment process.
Measuring this indicator over time and comparing it with previous results can also tell you if your development team is improving its performance over time after implementing some necessary changes. Some of the strategies to optimize LTTC is to implement automation in CI/CD pipelines and testing and to break down workpieces into smaller batches that developers can go through faster. These practices will increase efficiency and DX incrementally.
Automation is a great way to reduce the burden of manual input on developers and thus freeing their time for more important tasks, such as finding innovative solutions to progress work pieces to production. You can use automation for different stages of the deployment process, such as testing or CI/CD pipelines, and try to see whether there are areas where you could implement this practice further.
An environment that encourages collaboration between developers and as many automated processes as possible promotes efficiency and flow. By measuring these metrics within your organization and seeking to optimize these areas, you will also improve the overall perception of Developer Experience.
Velocity reports can show you how many story points your development teams have completed in a sprint and can also predict what to expect from future sprints. This metric has to be considered in combination with other indicators because it can’t provide an accurate picture of all the roadblocks encountered or the after-hours spent to compensate.
By using Waydev’s complex velocity reports, you can identify areas for improvement that will help speed up the deployment process and reduce frustration, leading to a better DX.
Deployment Frequency is a DORA Metric that speaks about how often successful code is released to production. This metric shows the efficiency of your development teams in deploying quality code, and it’s an important indicator of the capabilities of said developers. According to industry research, elite development teams should release code multiple times per day, while medium to low performers will deploy once per month – once per six months.
A low DF can indicate a series of issues in terms of developers’ productivity, which may be due to a lack of skills, motivation, or a poor organization of workflow or workloads. By analyzing this metric using the Waydev tool, you can find areas of improvement that can take your teams from average to elite performers. More efficient and motivated developers will also have an overall improved DX.
Developer Experience is an important concept to cover for the fast-growing tech industry because it provides a context to nurture the creativity and innovation of the developers, who constitute the backbone of software development. Identifying the right tools, platforms, and practices that can create the best possible DX is something to keep in mind and strive for to scale your organization.
Some of the best practices to optimize Developer Experience are:
Keeping track of DX with concrete data is also important, and you can do so by using engineering management platforms such as Waydev that provide specific metrics. Our comprehensive velocity or sprint reports and other useful metrics can provide the context to understand DX through the perspective of the deployment process and how it reflects on the productivity and efficiency of the developers.
Schedule a demo with our team and see how we can help optimize your Developer Experience.
Ready to unlock your SDLC productivity?