


Delivery
Work-Log
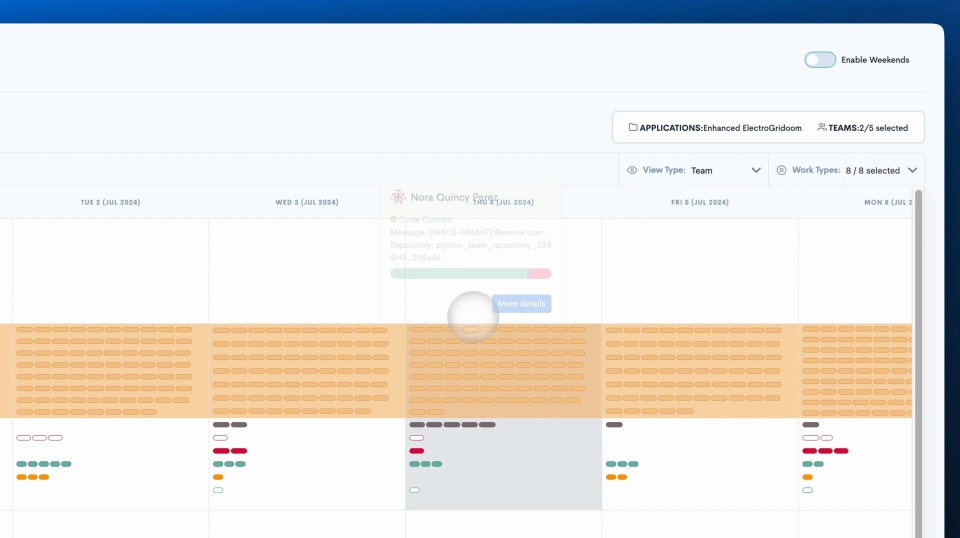
Gain a bird’s eye view of your team’s output and work habits. Zoom into your team’s activities to eliminate guesswork.
The Work-Log offers leaders a holistic view of their team’s activities and work habits, eliminating guesswork and providing actionable insights.
Gain Visibility into Team Activity
- Managing big teams is no walk in the park — you have to juggle several activities, join long meetings, lead unproductive stand-ups, and then hopefully, get some work done.
- The Work-Log let’s you inspect your team’s output and habits, and get automatic insights to eliminate guesswork.
Optimize Performance with Real-Time Insights
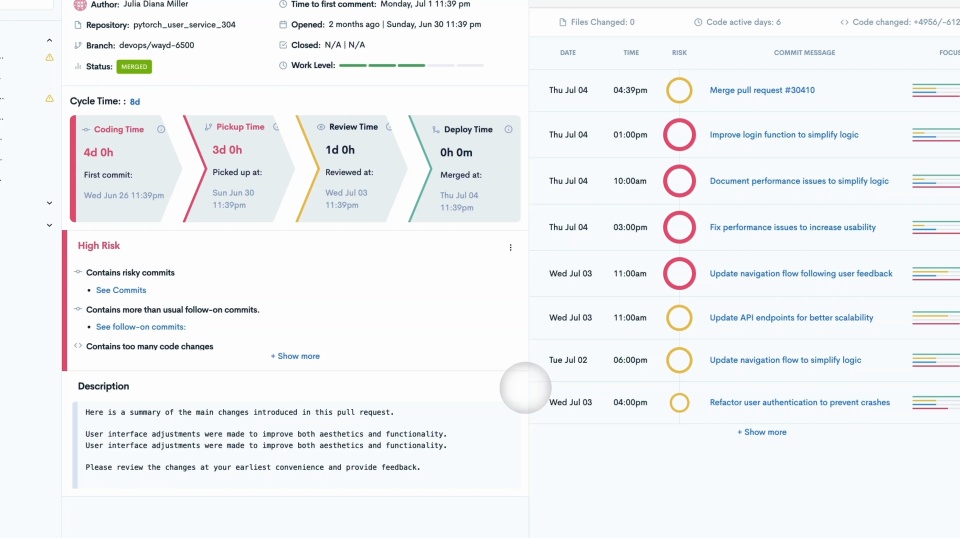
- The Work-Log empowers engineering managers to make data-driven decisions, proactively set expectations, and support team improvement over time.
- With the Work-Log you can gain visibility into onboarding, understand where your team focuses their efforts, and quickly spot any unexpected spikes in activity.
Trusted by FORTUNE 500 enterprise companies


READY TO ADOPT A DEVELOPER PRODUCTIVITY INSIGHT PLATFORM?