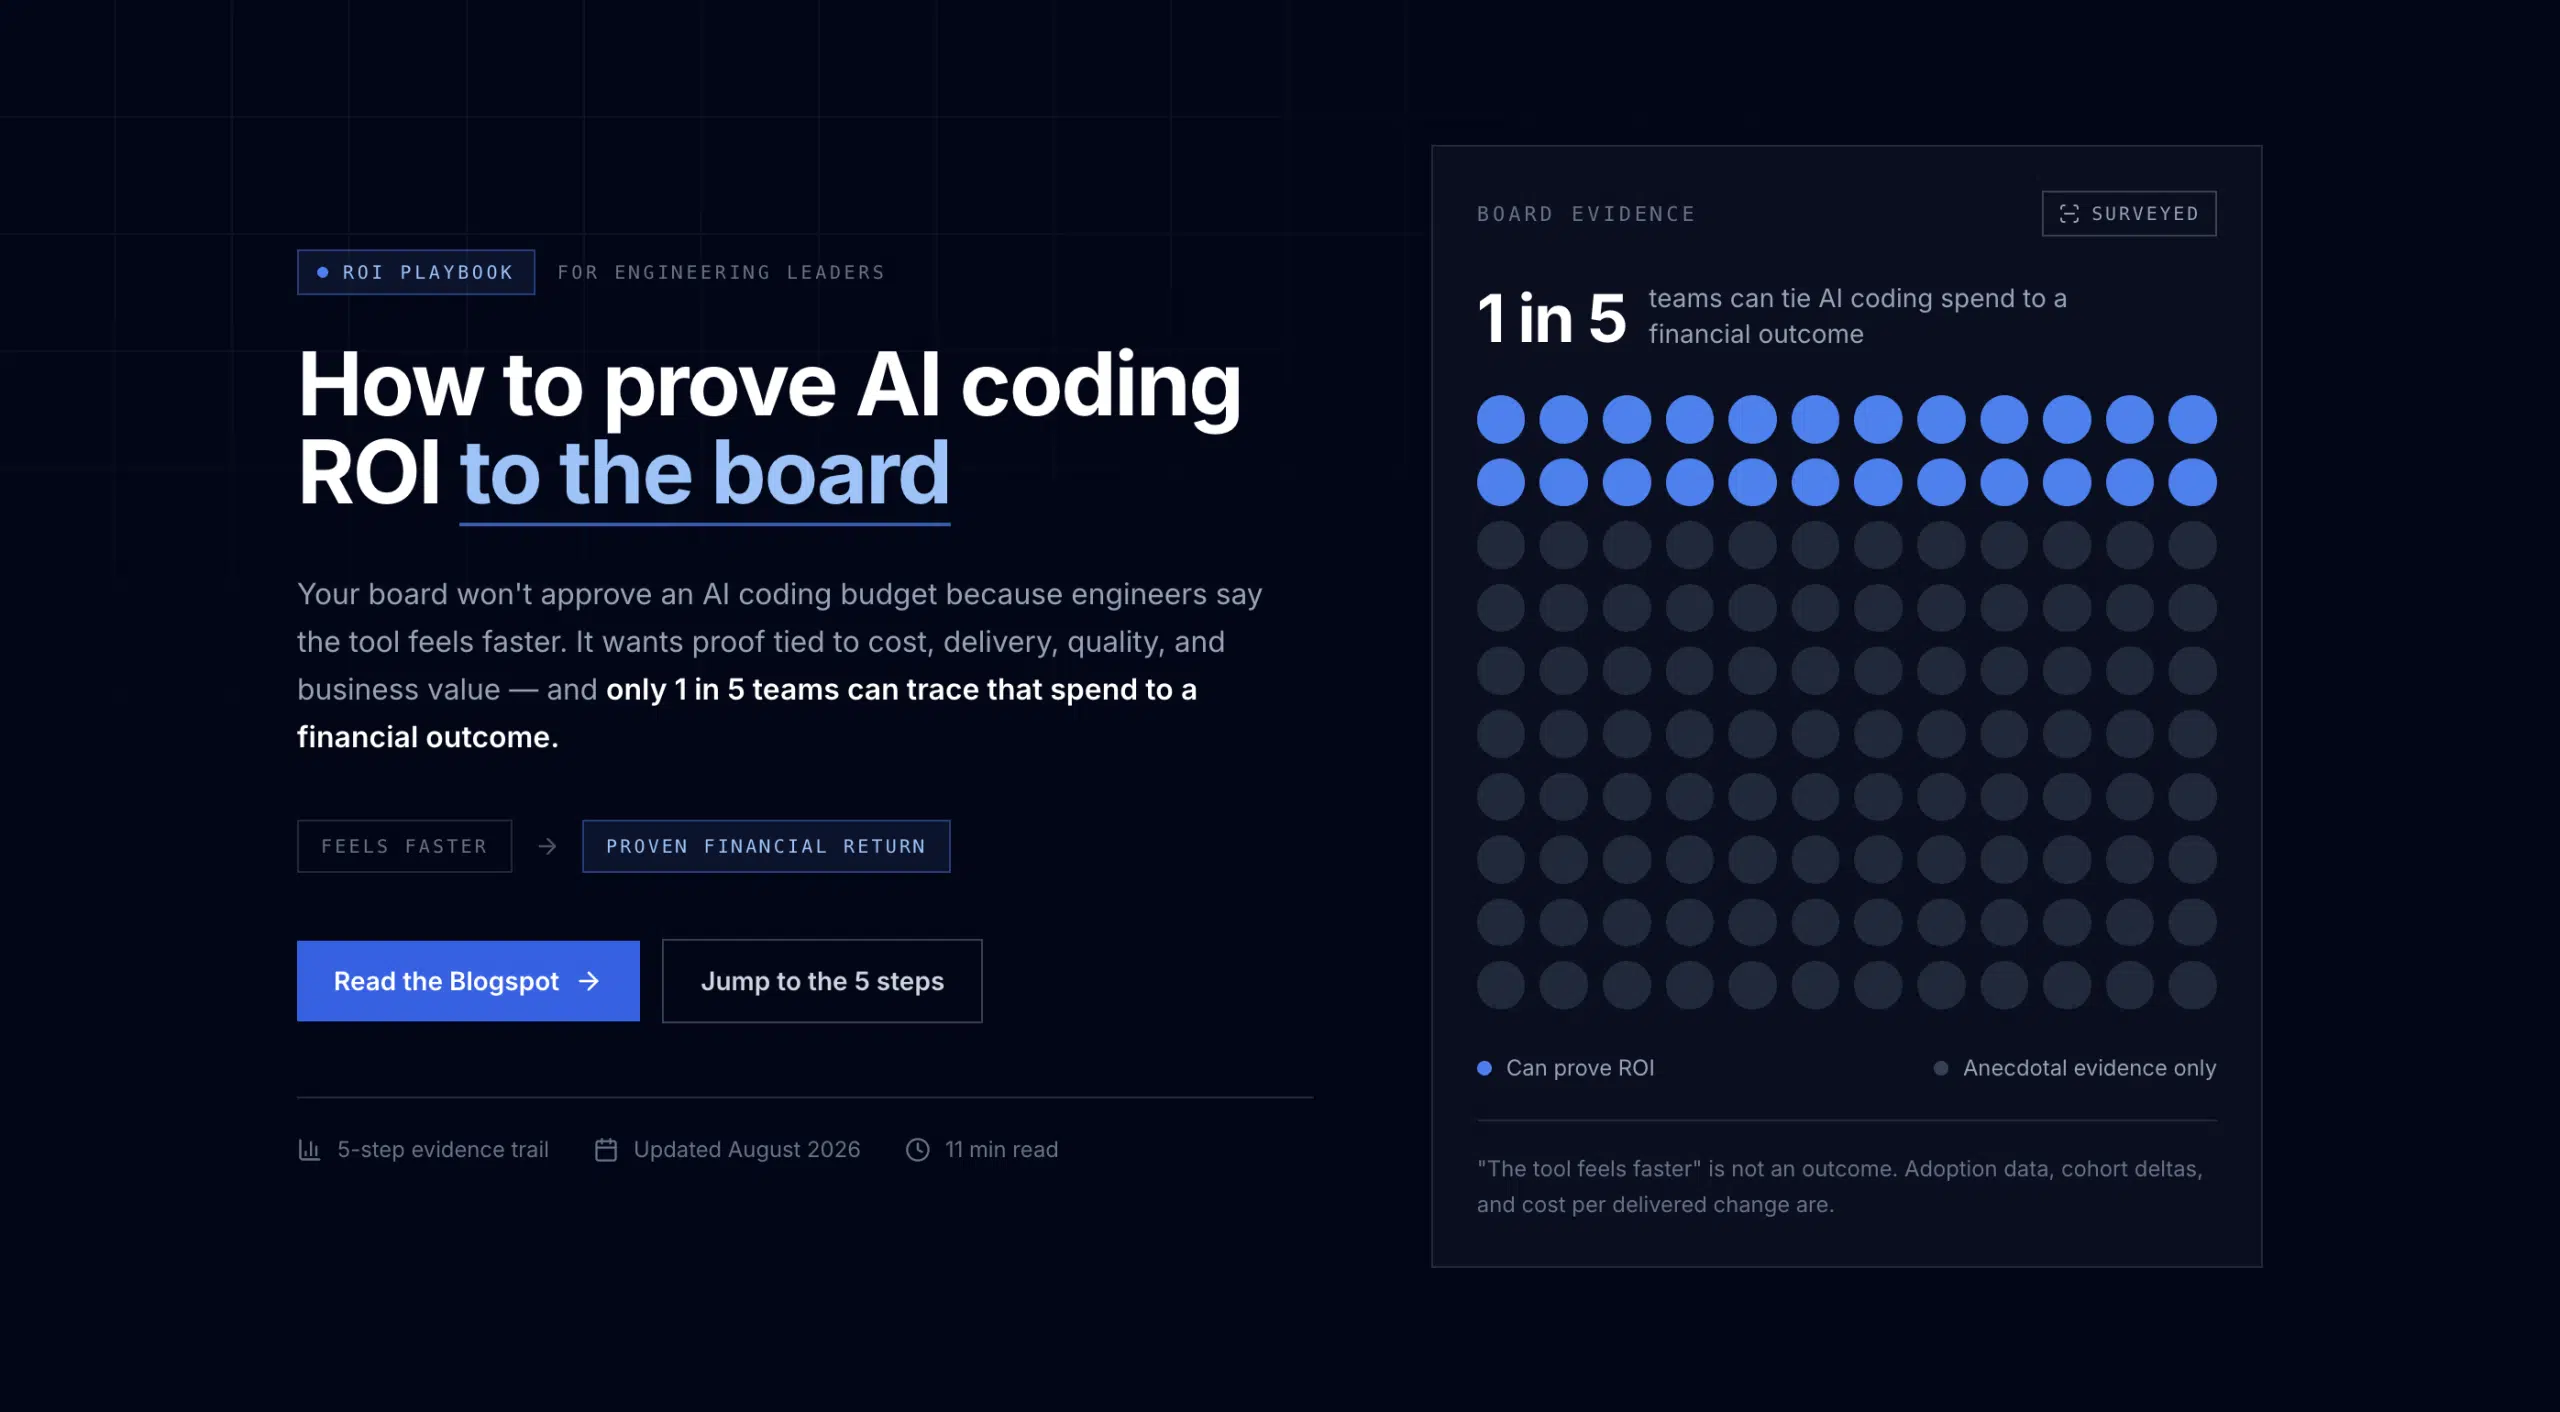
Your board won’t approve an AI coding budget because engineers say the tool feels faster. It wants proof tied to cost, delivery, quality, and business value. The safest path is to start with the cost of doing nothing, then build an evidence trail from adoption data to financial return.
This playbook shows how to prove ROI of AI coding tools to the board without relying on vague claims. It also fixes a common gap in simple ROI checklists: they name the metrics, but often skip data sources, risks, and the cost of measurement itself.
To prove ROI of AI coding tools to the board, start with the business problem, not the tool. Your first output should be a one-page case that names the pain, the owner, the baseline, and the target.
Write a specific problem statement. “Improve engineering productivity” is too broad. “Reduce median pull request cycle time for the payments group” gives finance and engineering a testable claim. You can also frame the issue as the cost of inaction. If review delays hold back a release, estimate what that delay costs in engineering capacity or time to market.
Pick two to four use cases. Keep each one tied to a workflow where AI assistance might change the result. Code generation is one use case. Test writing, code review, documentation, and incident work may need separate measures because each has a different path to value.
Now assign a baseline and target to each use case. Useful measures include:
Give every target an owner. The CTO may own the investment case, while a VP of Engineering owns delivery results and a finance partner validates the cost model. This split prevents a single team from marking its own homework.
Define the measurement window before rollout. A pilot may last 90 days, but your baseline should cover enough prior work to show normal variation. A single good sprint proves very little. Trends are stronger than snapshots.
Use a balanced definition of success. Faster code output means little if review time rises or production quality falls. The standard return on investment formula compares net gain with investment, so your business case must define both sides before anyone debates the result.
Adoption data tells you who uses an AI coding tool. ROI analysis asks a harder question: does that use change delivery or cost? Track both, and keep license activity separate from business impact.
Start with an inventory of every AI tool in the engineering stack. Record the teams covered, active seats, license terms, token or usage charges, and the workflow each tool supports. Include tools bought by teams outside the central procurement process. Shadow spend can weaken an otherwise sound board case.
Measure utilization at the team and organization level. Possible signals include active users, days used per month, AI-touched pull requests, accepted suggestions where available, and the share of repositories affected. Treat lines of code as a trend signal only. More code can mean more rework.
Then build total cost of ownership, or TCO. TCO is the full cost of keeping the program in place, not the invoice alone. Include:
Separate fixed costs from variable costs. A one-time integration may look small beside annual licenses, but it changes payback in the first year. A usage fee that grows with engineering volume can change the case when adoption expands.
Waydev can help bring these inputs into one view. Its AI ROI capabilities connect license spend with engineering output and let leaders examine results by tool, team, and seat. That gives finance a clearer path from purchase order to measured effect, while keeping the focus on groups and investments rather than individual rankings.
Keep an evidence log for every number. Note the system that supplied it, the date range, the person who checked it, and any exclusions. The research behind many simple ROI checklists has a major weakness: it names primary metrics but gives no data source. A finance committee can challenge an unsupported figure in seconds.
Use source labels such as procurement records, identity logs, Git data, issue tracking data, payroll cost models, and project budgets. If a metric comes from a survey, state the sample and method. If it comes from a platform, explain the calculation.
By now you should have an inventory, a utilization view, a full TCO model, and a source note for every input. Do not move to financial ROI until those four pieces agree.
Cohort analysis gives you a better way to prove ROI of AI coding tools than a simple before-and-after chart. It compares similar teams or work groups across the same period, which helps separate tool impact from seasonal demand or a major project change.
Choose a treatment cohort that uses the AI tool and a comparison cohort that does not use it yet. Match them as closely as you can by product area, work type, team size, repository age, and delivery process. You don’t need a perfect experiment. You do need to explain why the groups are comparable.
Capture a baseline for both cohorts. Look at several weeks of prior data, then measure the rollout period. Use the same definitions throughout. If cycle time starts when a pull request opens in one group but when coding starts in another, the comparison is not valid.
Measure the inner loop first. This covers the work close to code creation, such as coding time, time to first commit, and review wait time. Then measure the outer loop, which covers the path from approved work to customer delivery. Cycle time, deployment frequency, and change failure rate help show whether faster coding reaches production safely.
Quality must sit beside speed. Track rework on AI-touched changes, defects linked to affected code areas, rollback events, and incident frequency. A tool that cuts coding time but raises downstream repair work may have negative ROI.
Waydev’s engineering intelligence approach supports before-and-after analysis across engineering data. Leaders can use signals such as coding time, cycle time, review time, and delivery frequency to find where AI assistance changes the flow. The point is attribution at the team and organization level, not surveillance of individual contributors.
Watch for bottleneck movement. AI may help an engineer draft code faster while review, security checks, or release approval become the new constraint. A faster inner loop does not guarantee a faster customer outcome.
Use a difference-in-differences view when your data supports it. First, calculate the change in the treatment cohort. Then calculate the change in the comparison cohort. Subtract the second change from the first. This does not prove causation by itself, but it gives the board a more careful estimate than claiming every improvement came from AI.
Also collect a short feedback signal from teams. Ask where the tool saves time and where it creates repair work. Qualitative feedback cannot replace delivery data, but it can explain why one team benefits while another sees little change.
By now you should have a cohort result that shows speed, quality, adoption, and any new bottleneck. If the result is mixed, report that. A mixed result is more useful than a perfect claim that nobody trusts.
Financial conversion is where engineering outcomes become board language. To prove ROI of AI coding tools, translate measured time savings into capacity value, then keep revenue upside in a separate case.
Start with direct savings or reclaimed capacity. A simple model is:
Annual capacity value = verified hours saved per week × loaded hourly cost × working weeks × realization rate.
The realization rate matters. If a team saves ten hours, the company may not cut payroll. It may use those hours for a new feature, security work, or faster customer support. Call that reclaimed capacity unless you have a plan that turns it into a cash reduction.
Next calculate net ROI:
ROI = (measured gain – total AI program cost) ÷ total AI program cost.
Use the full TCO from Step 2. Include integration, training, and ongoing review. For payback, divide total program cost by the expected monthly gain. Show the conservative case first. Then add a base case and an upside case with clear assumptions.
| Outcome | Financial treatment | Evidence to show | Main risk |
|---|---|---|---|
| Fewer engineering hours spent on repeat work | Reclaimed capacity or direct labor savings | Time data, cohort change, loaded cost | Counting hours twice |
| Shorter delivery cycle | Earlier release value or reduced delay cost | Cycle-time trend and release plan | Assigning revenue without proof |
| Stable or better quality | Avoided rework and incident cost | Defect, rework, and incident records | Ignoring delayed defects |
| Higher adoption across approved workflows | Better use of existing spend | Usage records and seat costs | Confusing activity with value |
| R&D cost visibility | Improved project cost attribution | Effort records and project budgets | Mixing accounting treatment with ROI |
Revenue uplift needs extra care. If faster delivery moves a product launch forward, work with finance and product leaders to estimate the value of that timing. Do not count the full forecast as AI benefit unless the business can show that AI caused the change and the release would otherwise have missed the date.
The same rule applies to strategic value. Better onboarding, more room for innovation, or improved employee experience may matter. Put those items in a separate section instead of blending them into hard savings.
If software work also connects to capitalization or project accounting, keep that discussion distinct from operating ROI. Waydev’s guide to software engineering returns and R&D cost capitalization can help your finance and engineering teams discuss effort records without treating accounting treatment as proof that an AI tool paid for itself.
Build the model in a sheet that a finance partner can audit. Every formula should point to a source, an owner, and a date range. This is where many cases fail. They count gross hours saved while ignoring integration cost, training time, or extra review work.
A board-ready case for AI coding tools needs a repeatable scorecard. ROI is not a one-time calculation because usage, tool cost, delivery demand, and quality can change after rollout.
Set a monthly operating review and a quarterly board view. The operating review can include detailed team signals. The board view should stay focused on investment, measured outcome, risk, and the next decision.
Use four scorecard groups:
Set guardrails before you scale. Define approved tools and workflows. Record data residency needs. Review access controls and retention. Make clear that the scorecard measures team outcomes and investment performance, not individual worth.
Use a simple three-slide story:
Lead with the cost of inaction. Explain the workflow that currently consumes capacity or delays value. Then show what changed after adoption. Finish with what you will do next if the result holds, and what would cause you to stop or change course.
Waydev supports this kind of narrative through custom dashboards, AI Checkpoints, Signals, Predict & Improve, and MCP integration. Used well, these capabilities give leaders granular visibility into adoption and delivery without turning the board report into a wall of charts. The useful question is always the same: which investment changed which outcome?
Keep an assumptions page behind the presentation. Include definitions, cohort rules, excluded work, cost sources, and known limits. If the board asks why the number changed, you should be able to answer without rebuilding the model.
Review the case after each quarter. If the tool has high adoption but no delivery effect, investigate the bottleneck. If delivery improves while quality declines, pause expansion and fix the workflow. If value is real but concentrated in a few teams, adjust the rollout instead of spreading spend evenly.
The best way is to connect a measured change to a financial input. Start with a baseline, compare similar cohorts, include full TCO, and show quality beside speed. Then convert verified hours or delivery gains into capacity value, savings, or carefully supported revenue timing. A board will trust a modest result with clear sources more than a large claim with weak evidence.
Executives should use adoption, delivery, quality, and finance metrics together. Track AI-touched work and active use, then compare cycle time, deployment frequency, rework, defects, and incidents. Add loaded engineering cost, total program cost, reclaimed capacity, and payback. Lines of code can provide context, but they should not be the main proof of value.
Calculate total cost by adding licenses and usage charges to integration, training, security review, change support, administration, and ongoing evaluation. Separate one-time costs from recurring costs. Use procurement records for spend and named owners for estimates. A low license price can still produce poor ROI if adoption work or integration effort is left out.
AI coding ROI can include revenue growth, but only as a separate, supported scenario. First prove the delivery change, such as an earlier release or faster experiment. Then work with finance and product leaders to estimate the business value of that timing. Don’t count a full revenue forecast as AI benefit when other factors could have caused the result.
Review operating metrics monthly and report the board view at least quarterly. Monthly reviews catch falling adoption, rising rework, or new bottlenecks before they affect the annual case. Quarterly reporting gives enough time for delivery trends to form. Keep the definitions and cohort rules stable so each report can be compared with the last one.
Build the case around measured change, not AI enthusiasm. Start with a baseline and full TCO, validate impact with cohorts, then show conservative financial return beside quality and governance. For a working measurement model, review Waydev’s guide to evaluating ROI of engineering teams, and use its structure to prepare your next finance review.
Ready to unlock your SDLC productivity?