Estimated reading time: 6 minutes
If you’re leading an engineering team, you’ve probably felt it: that nagging uncertainty when trying to understand how your team is really doing. Are we moving fast enough? Are we building the right things? Are we working well together?
And let’s be honest: staring at velocity charts or line-of-code graphs doesn’t really answer those questions.
“Traditional metrics can feel like they’re telling you something, but too often, they just add noise,” says Alex Circei, CEO of Waydev. “You need data that actually reflects how your team works, not just what they produce.”
This article breaks down the essential software engineering metrics that help you understand your team’s performance in a meaningful way. We’ll also show you how platforms like Waydev make it easier to gather and act on these takeaways, without turning your workflow into a data-entry exercise.
Metrics, when used right, are tools, not scorecards. The goal isn’t to track people. It’s to help them.
Modern development is fast, cross-functional, and ever-changing. You need a way to spot roadblocks early, understand team health, and know whether your engineering efforts align with company goals.
“We work with hundreds of software teams. And it’s clear: leaders don’t just want more data. They want clarity. They want to know what’s working and what’s holding the team back.” Circei explains.
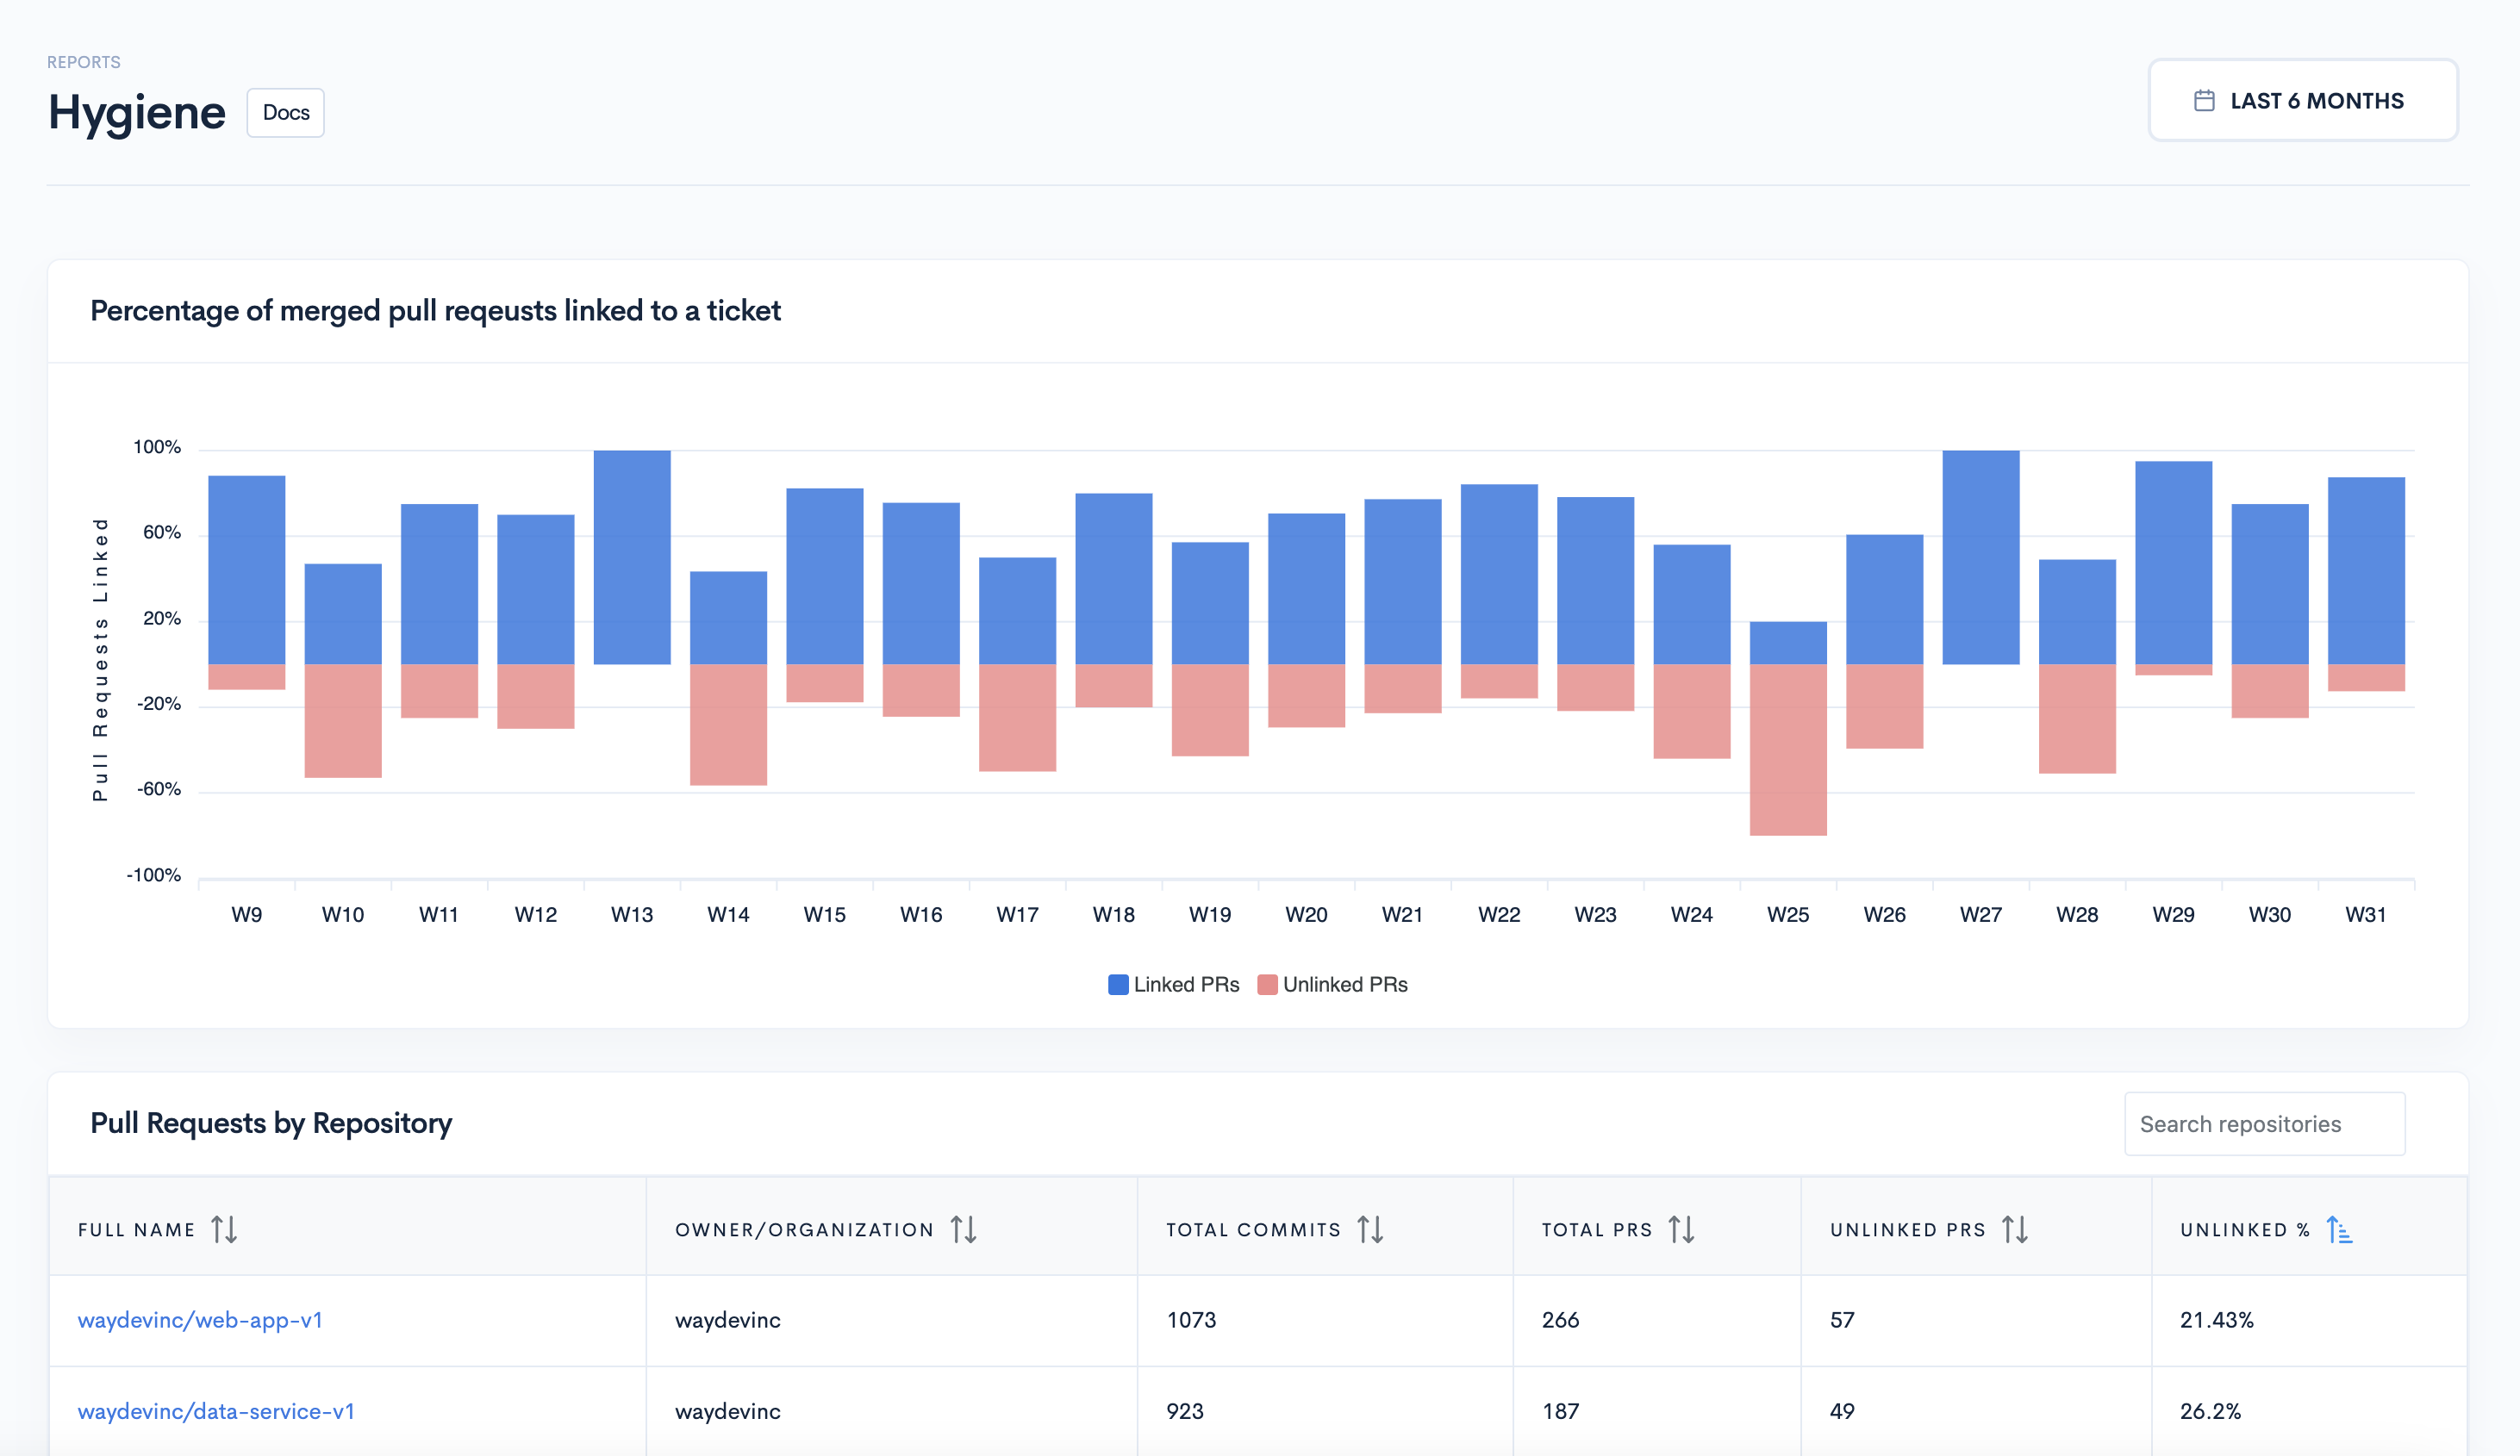
That’s where Software Engineering Intelligence Platforms (SEIPs) like Waydev come in. Instead of relying on manual spreadsheets or gut instinct, SEIPs connect to tools like GitHub, Jira, and Slack, and surface real-time takeaways that actually help you lead better.
To keep things simple, we’re breaking it down into three categories: delivery, process, and collaboration. These categories work together to give you a 360° view of your team’s effectiveness.
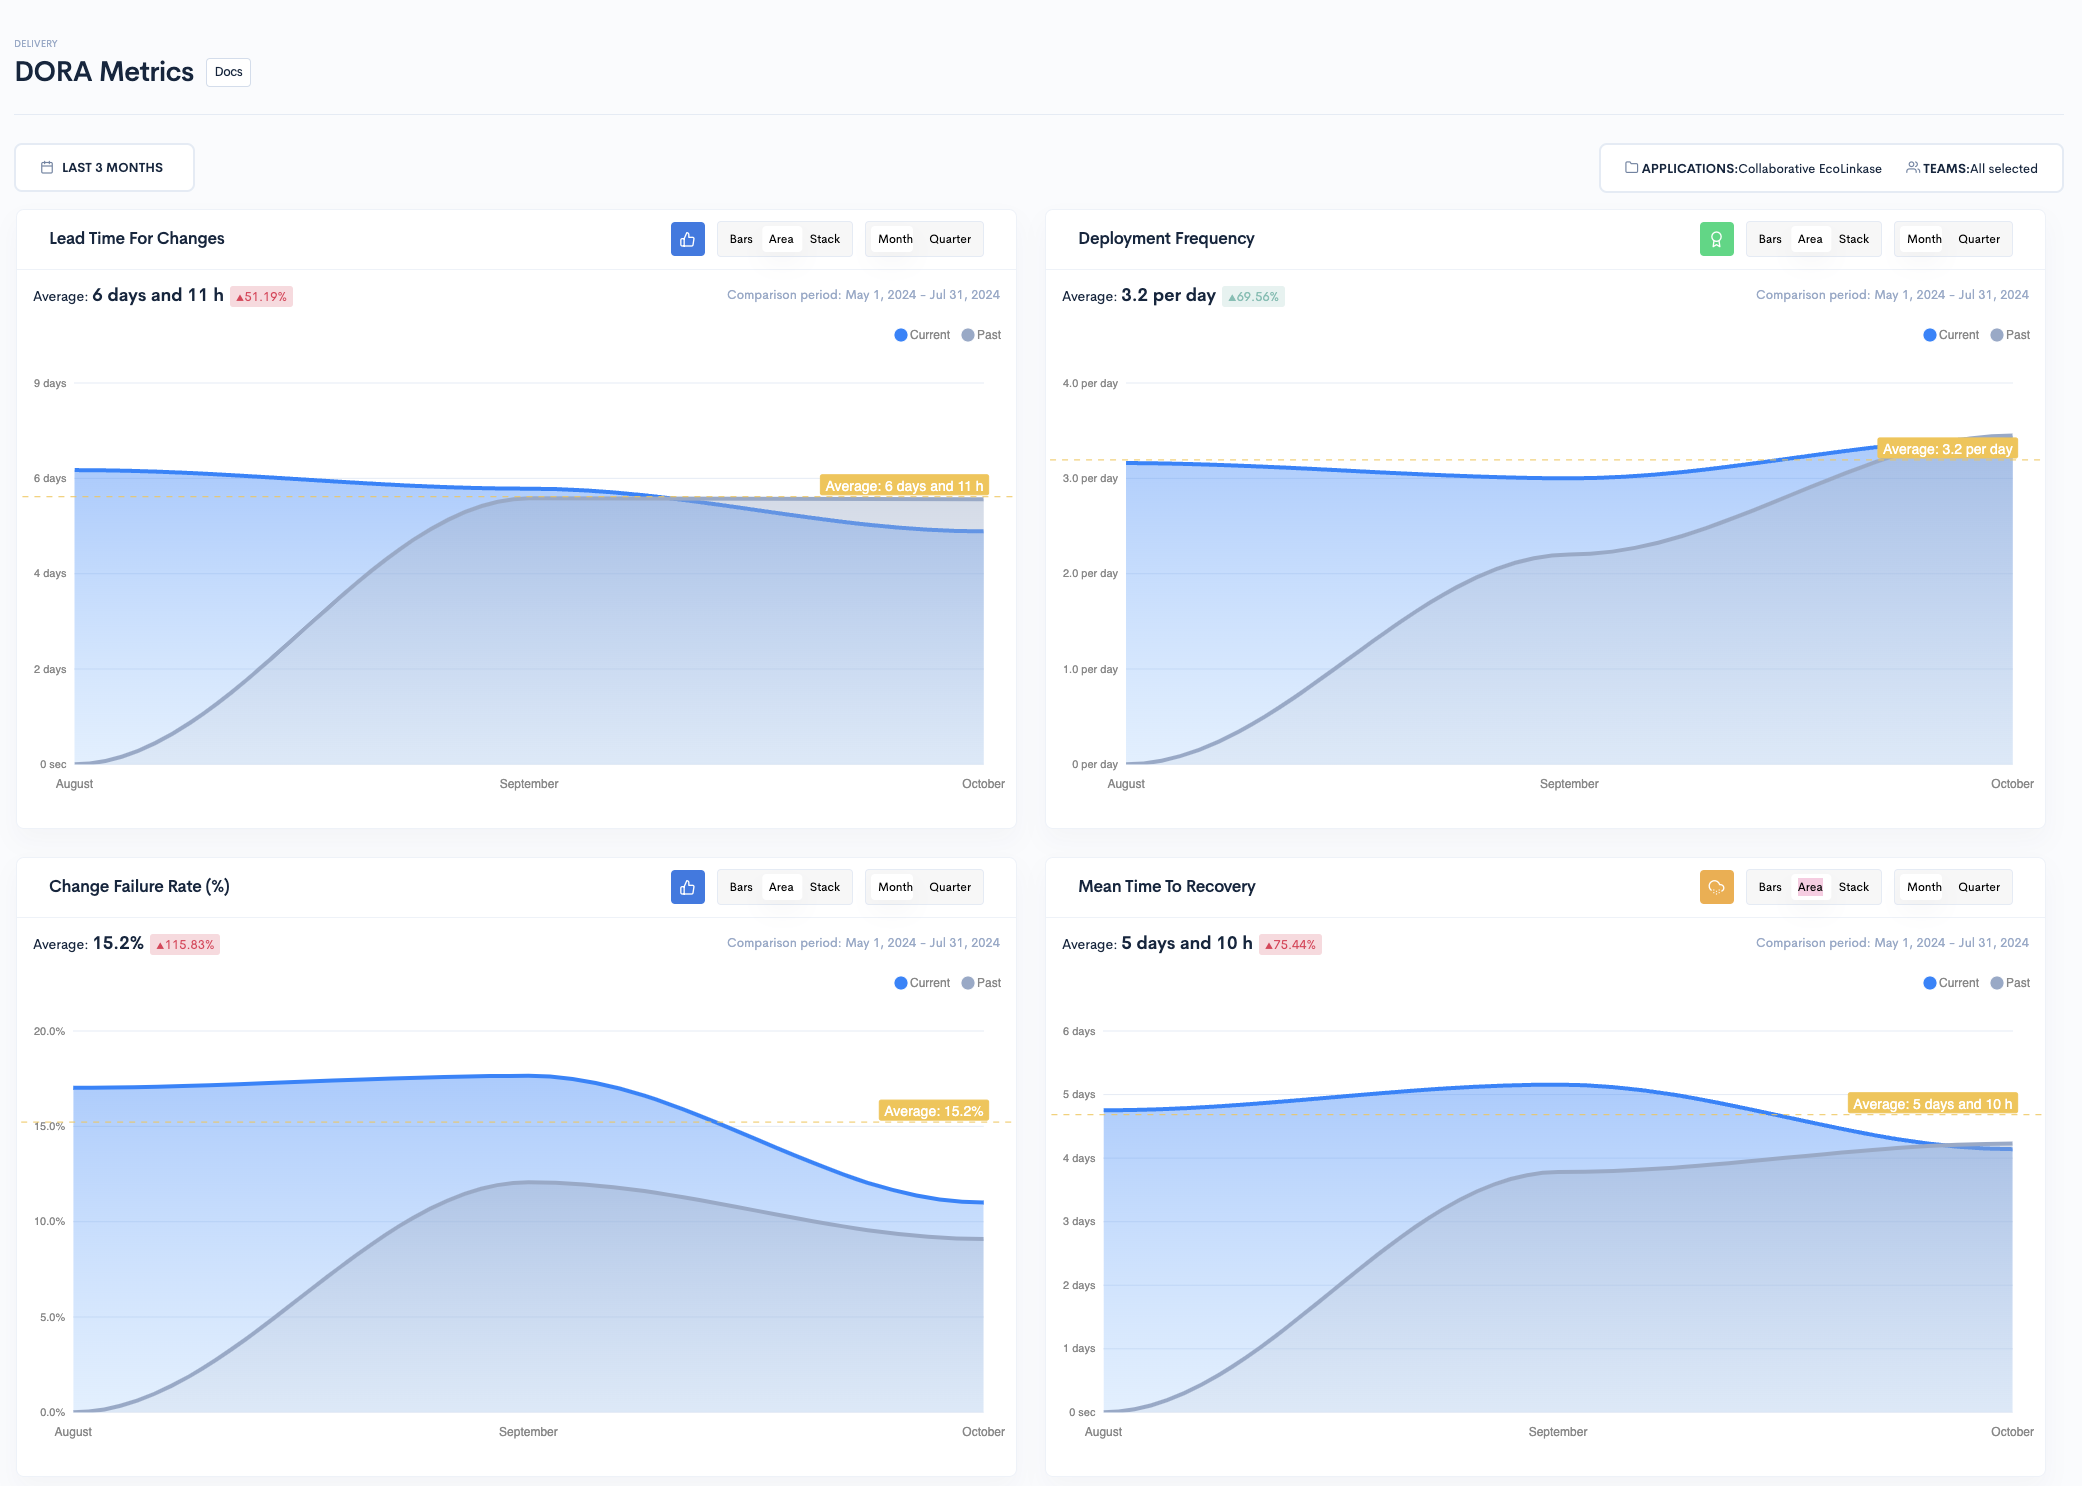
These are the four key DevOps metrics (originally developed by Google’s DORA team) that every engineering org should track:
1. Deployment Frequency – How often are you deploying code to production? The more often you deploy, the smaller the changes—and the easier they are to test, roll back, or improve.
2. Lead Time for Changes – How long does it take from writing code to seeing it live? Shorter lead times generally point to faster, more efficient development cycles.
3. Mean Time to Recovery (MTTR) – When something breaks, how long until it’s fixed? Low MTTR reflects solid incident response practices and strong reliability.
4. Change Failure Rate – How many deployments cause bugs or outages? This helps you balance speed with stability, because faster isn’t better if quality suffers.
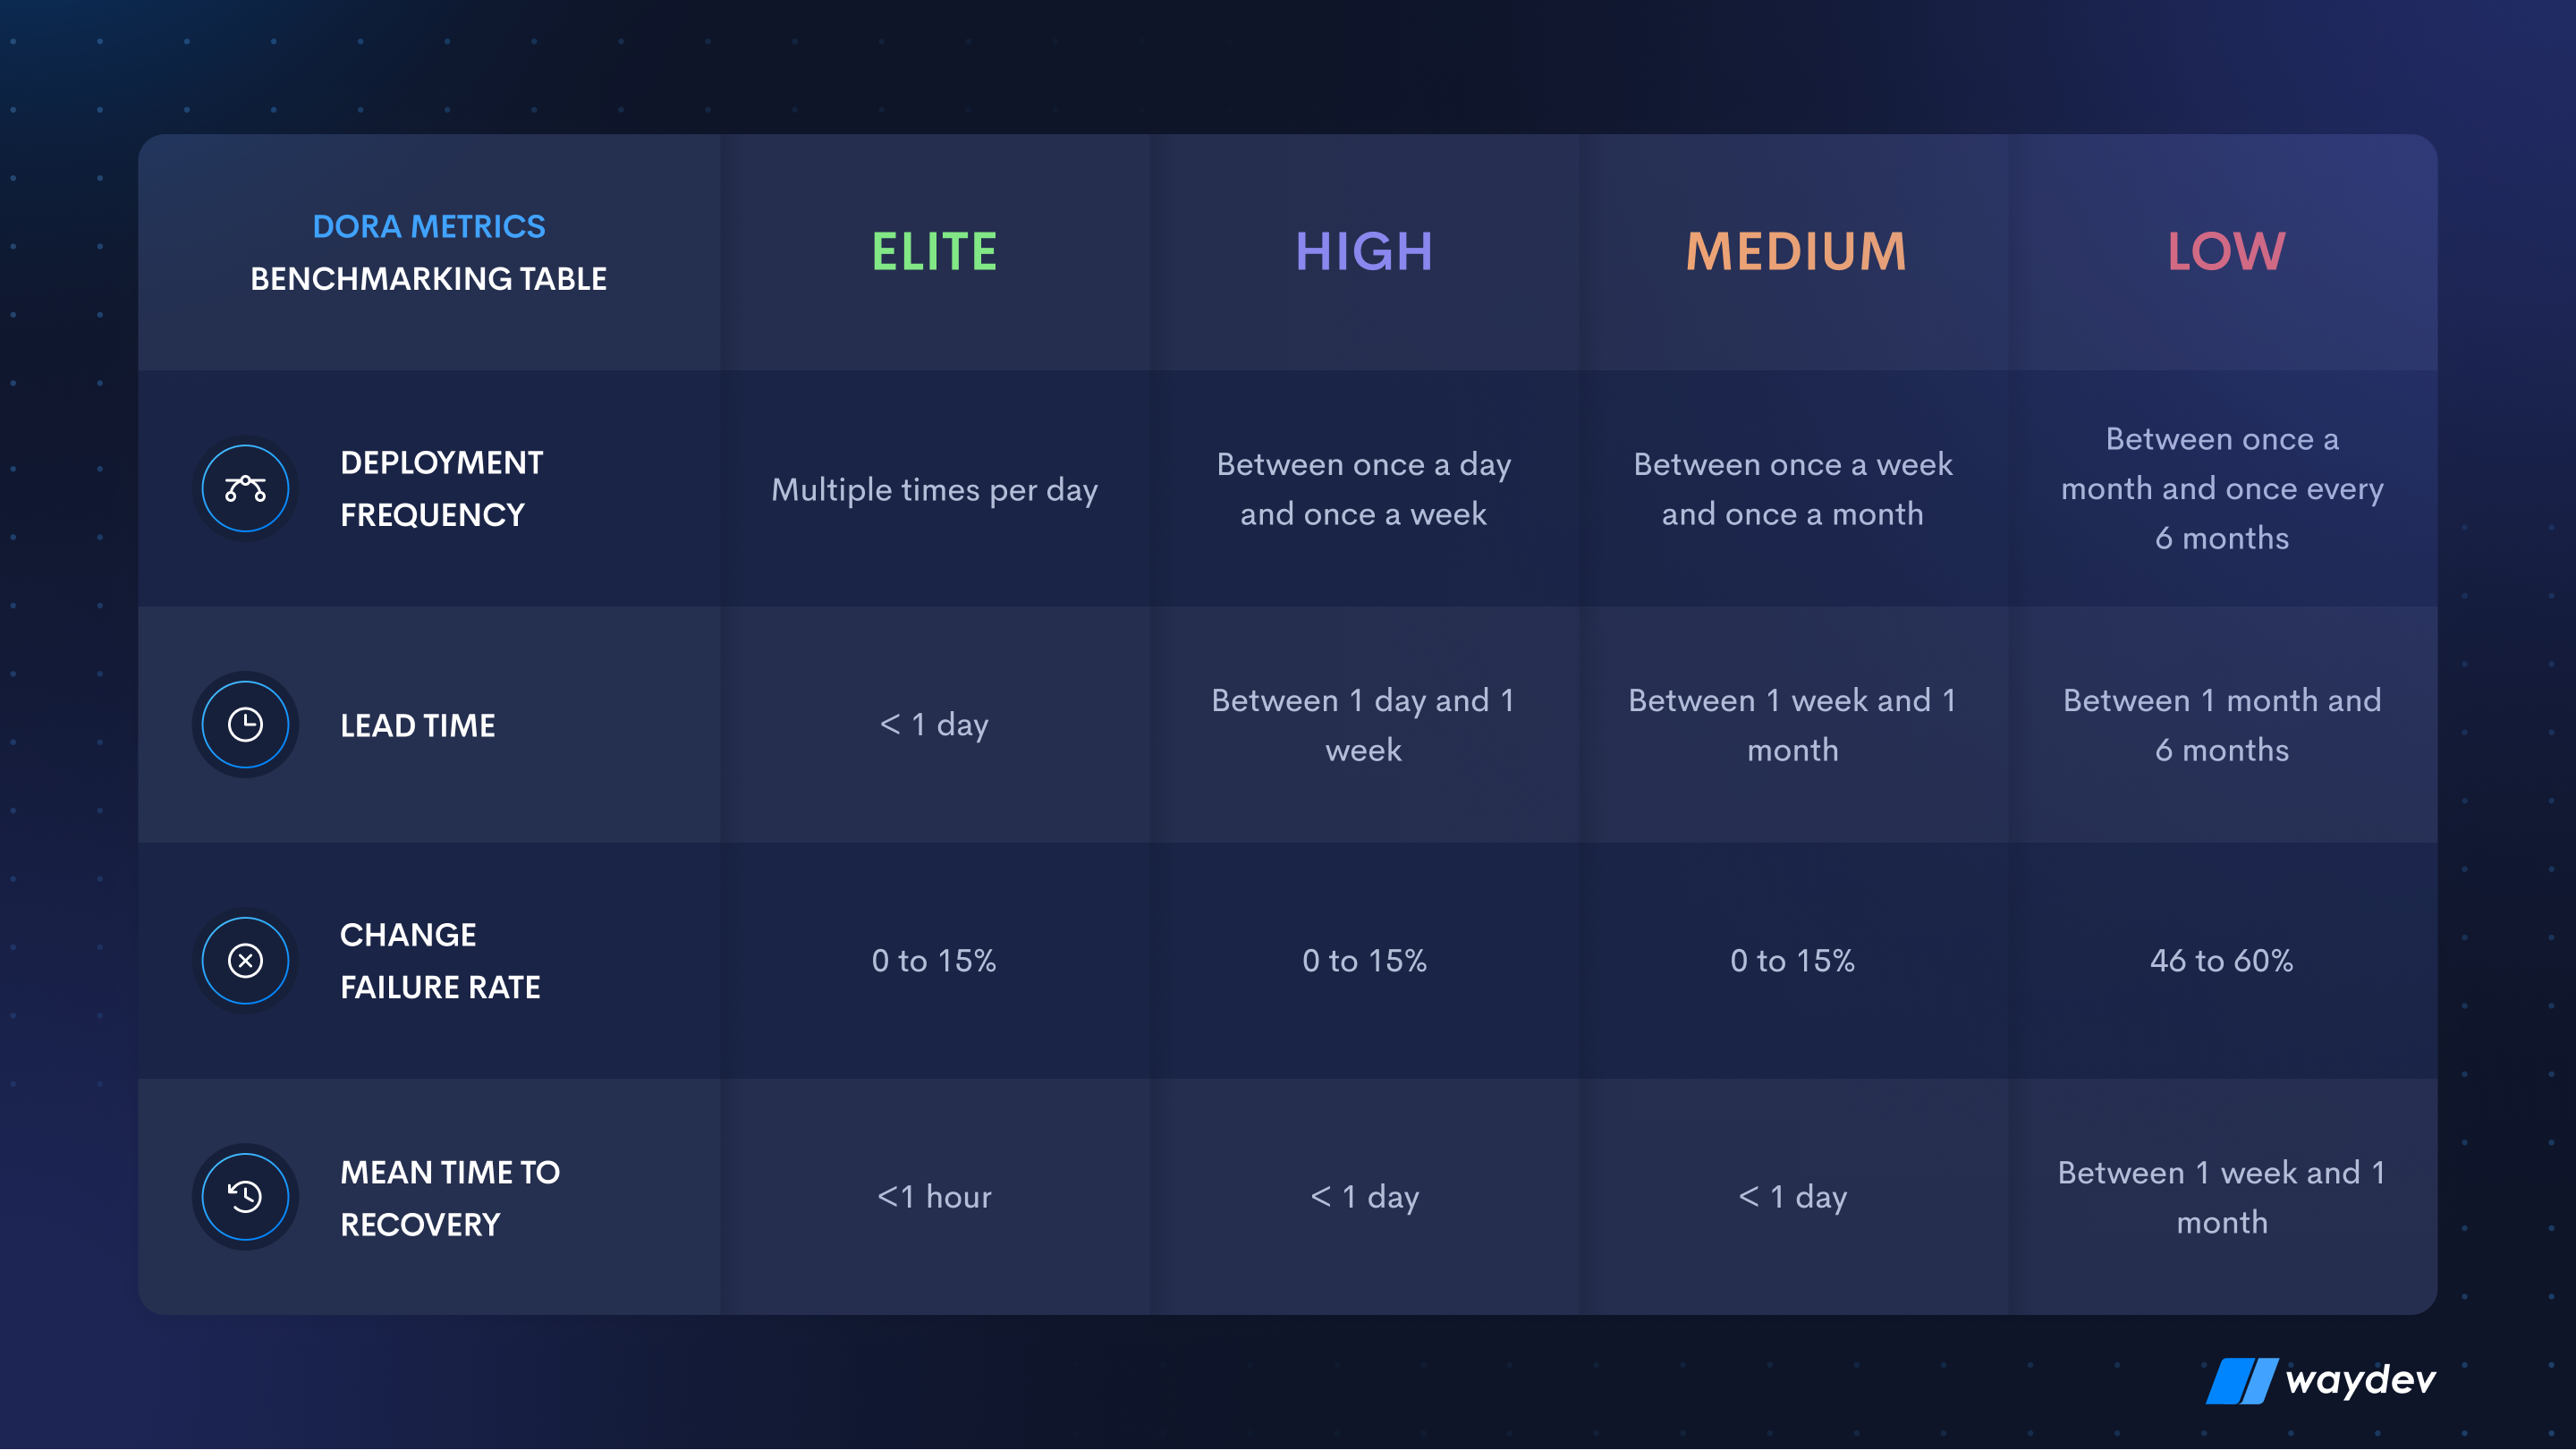
“DORA metrics give you real insight into your delivery engine. Are we fast? Are we stable? Are we improving? It’s hard to get those answers without this data.” says Circei.
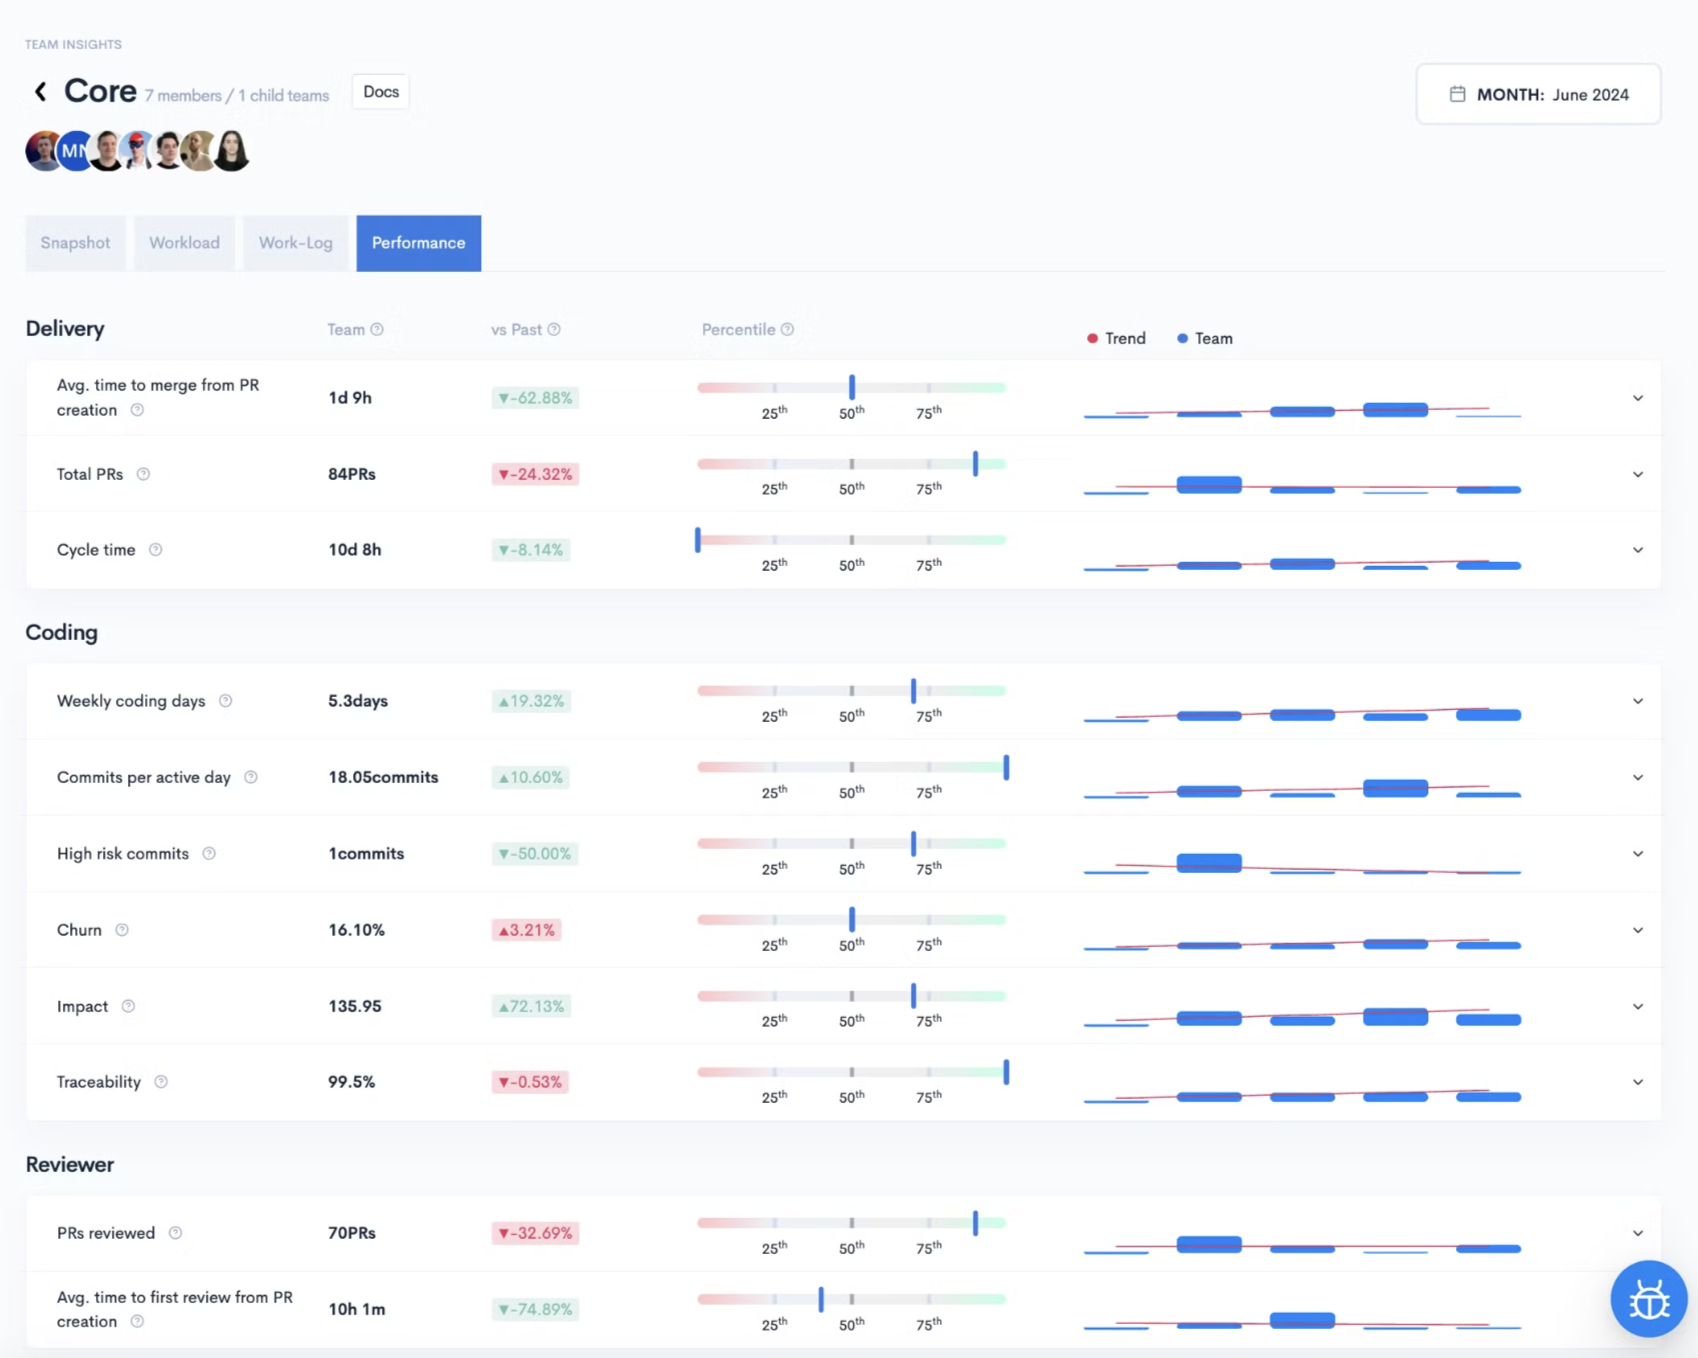
Beyond delivery, you want to understand how work flows through your team.
5. Cycle Time – How long does it take for a task to go from ‘in progress’ to ‘done’? This shows where delays are happening in your pipeline.

6. Time to First Comment – When a dev opens a pull request, how quickly does someone review it? Short wait times keep momentum up and reduce context-switching.
Even the most productive team can struggle if collaboration breaks down. These metrics help reveal how well people work together.
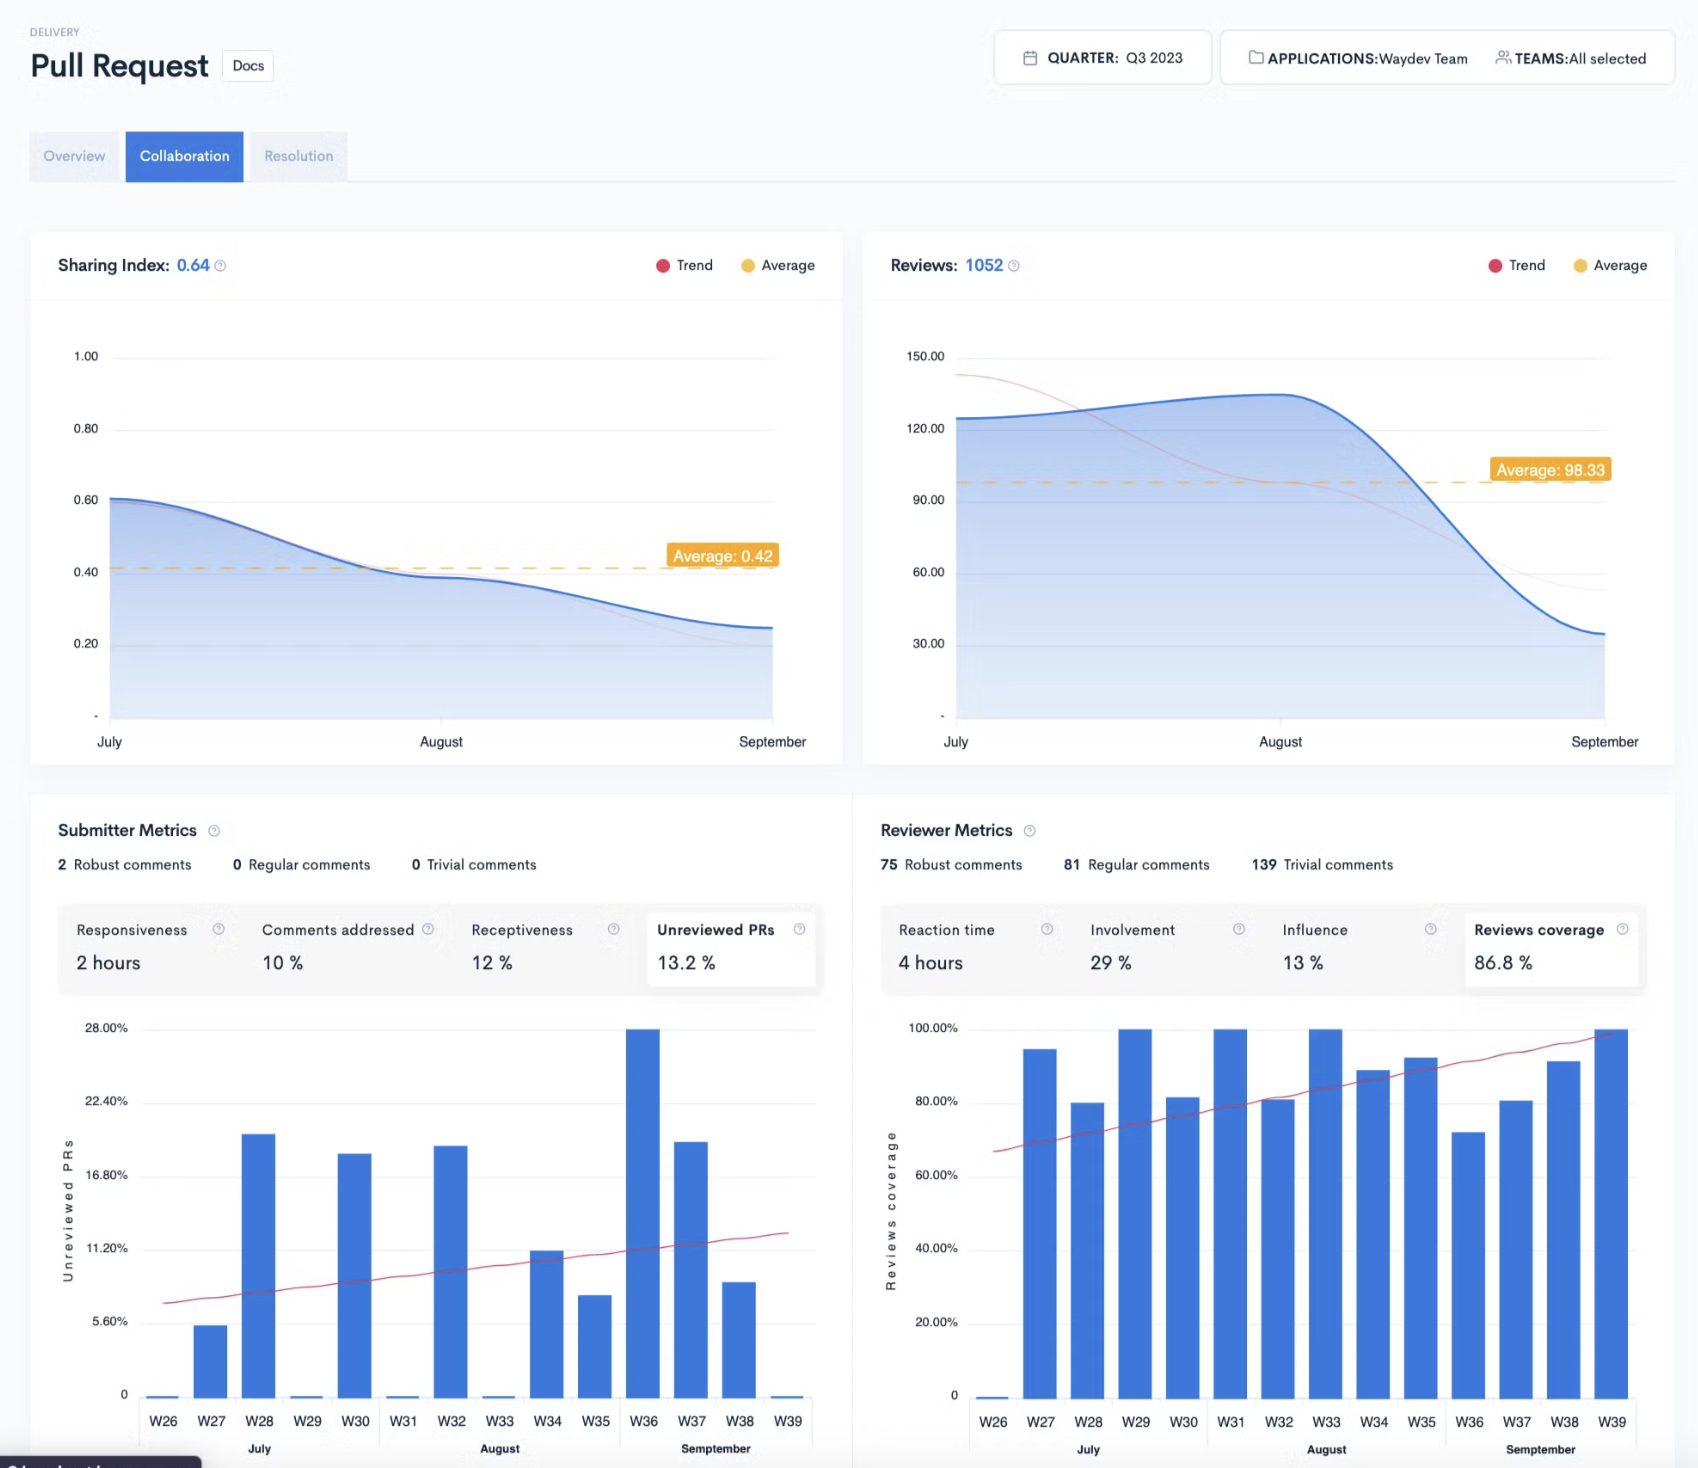
7. Pull Request Review Time – Are code reviews happening fast enough, or are they getting stuck? Long delays might signal overloaded reviewers or unclear standards.
8. Unreviewed Pull Requests – Are there pull requests sitting around without any feedback? When PRs go unnoticed, it can be a sign that people are overloaded, disconnected, or that there’s a breakdown in the review process.
9. Team Responsiveness – When someone comments or requests changes, how fast does the team respond? Responsiveness fosters a healthy feedback loop and happier devs.
“We’ve found that responsiveness isn’t just a workflow metric, it’s a culture signal.” adds Circei. “It shows whether teammates support each other, and that has a direct effect on retention and morale.”
Here’s the truth: metrics can easily backfire if they’re rolled out poorly. They should help your team, not stress them out.

Step 1: Take Stock
Look at your current tools and workflows. Where are the gaps? Where do people already feel frustrated?
Step 2: Pick a Few Key Metrics
Don’t track everything. Start with 3 or 4 metrics that matter most to your goals, maybe lead time, PR review time, and change failure rate.
Step 3: Bake Metrics Into Your Rhythm
Don’t just check dashboards monthly. Bring metrics into retros, stand-ups, and weekly check-ins.
Step 4: Use a Platform That Works With You
Waydev connects with GitHub, Jira, and Slack to surface metrics automatically, no extra work, no context loss.

“We didn’t build Waydev to be a tracking tool. We built it to be a clarity tool,” says Circei. “We want to give engineering leaders the confidence to make smart decisions without slowing the team down.”
mean burnout, not laziness.
Waydev is built specifically for modern engineering teams. It pulls data from your existing stack and visualizes the metrics that matter – no spreadsheets, no guessing.
“If you’re serious about improving developer experience and delivery, you need better signals. That’s exactly what Waydev delivers,” Circei adds.
Measuring developer performance shouldn’t be a guessing game or a micromanagement nightmare. When you focus on meaningful metrics, and give your team context around them, you unlock real improvement.
“Great engineering teams don’t fear data, they use it to get better. The key is giving them the right metrics and the right mindset.” says Circei.
Ready to turn metrics into momentum? Start tracking what matters with Waydev.
Ready to unlock your SDLC productivity?