It’s been two weeks since we took action and made working from home mandatory for all the team members. Our top priority remains the health and safety of our team members. We have a responsibility to support our communities through the health crisis caused by COVID-19.
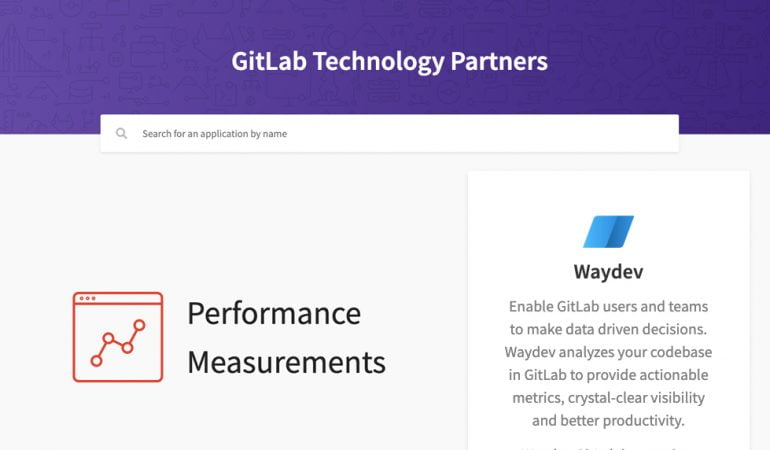
Moving to a 100% work-from-home policy in such a short time frame is not easy, but there are companies that thrive in a remote environment. The best example is GitLab. GitLab is the world’s largest all-remote workforce, with over 1,200 employees spread across 67 countries. We are one of the few GitLab partners in the Performance Measurements field.
GitLab has been able to grow continuously because they have a process put in place. One of the key elements of focusing on the process is measuring the process. Git Analytics tools, such as Waydev, help engineering leaders manage remote teams effectively by providing actionable metrics and features that translate into visibility, velocity, and productivity enhancement.
Waydev’s features help engineering leaders to run nondisruptive daily stand-ups, effective one-on-ones and enable a healthy code review workflow.
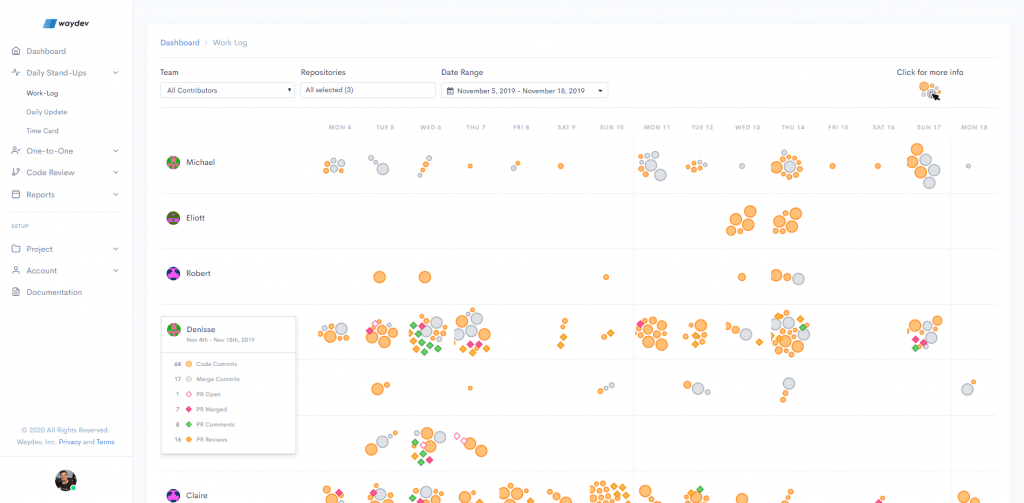
For Daily stand-ups, the Work Log provides a high-level view of your engineering team’s activity, such as commits and pull requests, so both engineering managers and engineers don’t need to waste time on questioning and reporting.
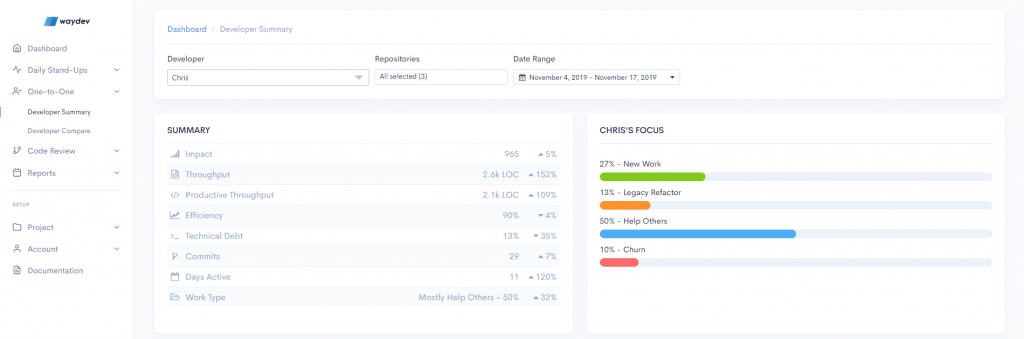
For One-on-ones, the Developer Summary offers a low-level view of the activity of each engineer, so engineering managers can see what are their engineers working on, spot and eliminate any blocker that might be holding down their team.
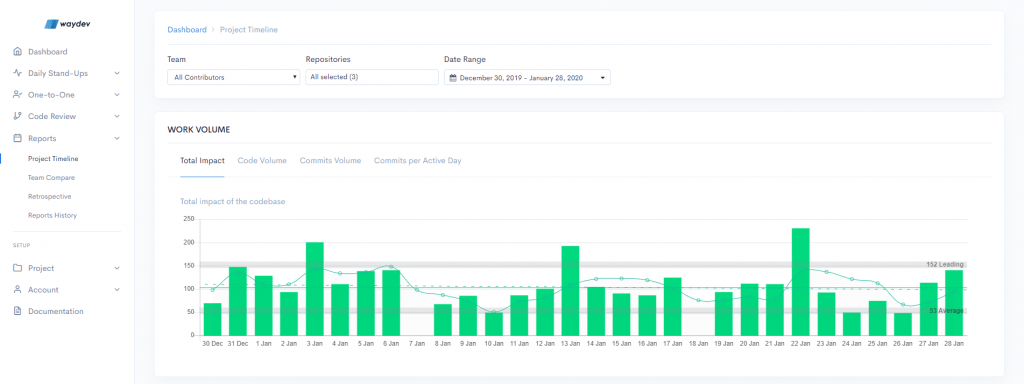
For Project Health Checking, the Project Timeline helps engineering leaders to see how work focus and volume shift over time. You can see whether your engineers focus on creating new code, refactoring old code or on helping others. You are able to view and correlate how events impacted your team’s velocity and performance, and direct your data-driven decisions.
We divide our metrics into:
The code-level metrics provide engineering leaders with insights regarding their engineers’ efficiency and productivity.
Impact is a way to measure the amplitude of code changes that happen, in a more complex manner than measuring raw lines of code. The algorithm behind the Impact is similar to Google’s Page Ranking algorithm. It comprises multiple data points that translate engineers’ output into both business value and cognitive load.
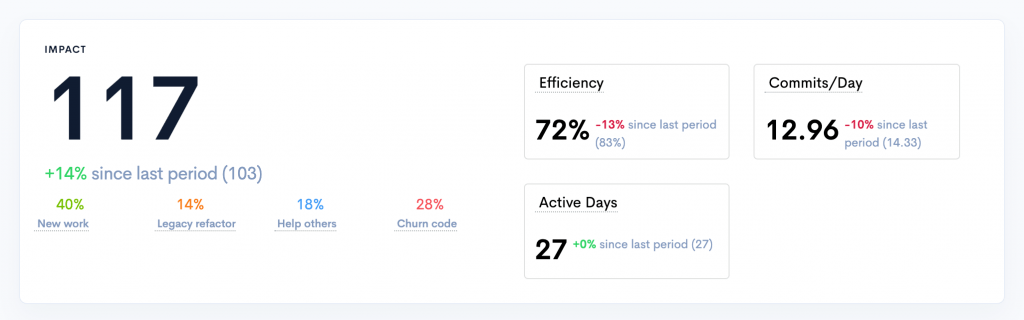
Churn represents the percentage of code that has been rewritten or deleted shortly after being written. Of course, nothing works perfectly from the first try, but if this percentage experiences spikes, you might want to analyze that. It might have only been a change in specifications, but it could also mean that an engineer got the requirements wrong, or that a manager wasn’t clear enough. This can help you diagnose issues early and fix them in a timely manner.
Technical Debt represents the amount of refactoring code done by an engineer. Usually, the process of paying down technical debt is a less shiny process than releasing new features, but it is more complex and it carries a higher cognitive load. Paying down technical debt might enable engineering teams to release a new feature or fix a long-running flaw that had the potential to affect the whole project.
Code collaboration metrics provide an understanding of the code review process. They quantify the effectiveness of the engineers’ collaborative work and knowledge sharing.
Review coverage calculates the percentage of pull requests that had been reviewed before being merged. This metric helps you gain a better understanding of your team’s code review process and aids you in spotting unhealthy code review patterns. A low review coverage translates into a higher chance of putting buggy code into production, whereas a high review coverage decreases the chances of buggy code to be put into production.
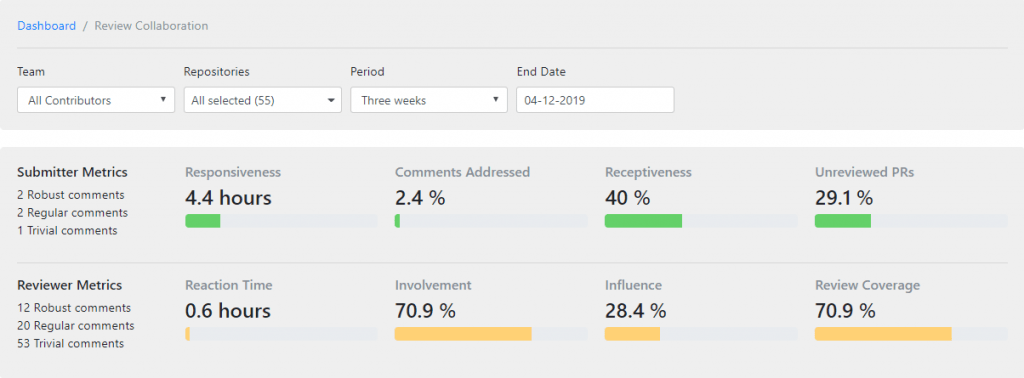
Time to Resolve measures the velocity of the code review activity. It represents the average time it takes to close a pull request.
Sharing Index measures how broadly information is being shared amongst a team.
We know Waydev is particularly useful for tracking your engineers’ output when they are working remotely, and after seeing increased usage in the regions hit hardest by the virus, we’re taking immediate action to ensure our product is accessible to as many people as possible.
Through July 15, 2020, we are:
Photo source: https://circleci.com/blog/how-to-successfully-work-from-home-strategies-for-remote-work/
If you want to find out more about how Waydev can help you, schedule a demo.

Ready to unlock your SDLC productivity?