Software engineers create all those great platforms and tools for every other industry, and yet, engineering leaders struggle to understand the work of their engineering teams. They struggle to correlate engineering output to business value.
Calculate your Waydev business ROI here: https://waydev.co/roi
Waydev provides reliable data sources that help CTOs and VPs of Engineering gain a clear view of your organization’s engineering processes. This helps executives understand and increase the business value of their engineering department. By translating the engineering output into quantifiable metrics and reports, Waydev assists engineering leaders in making data-driven decisions to reduce engineering inefficiency.
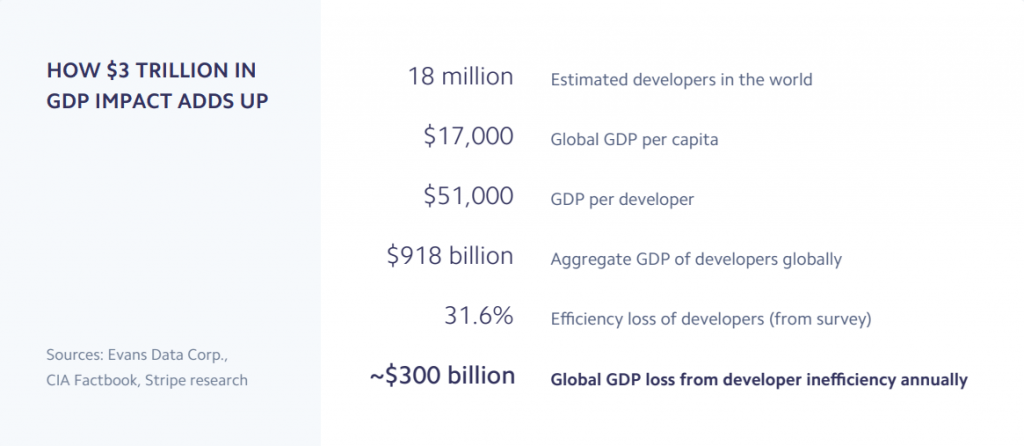
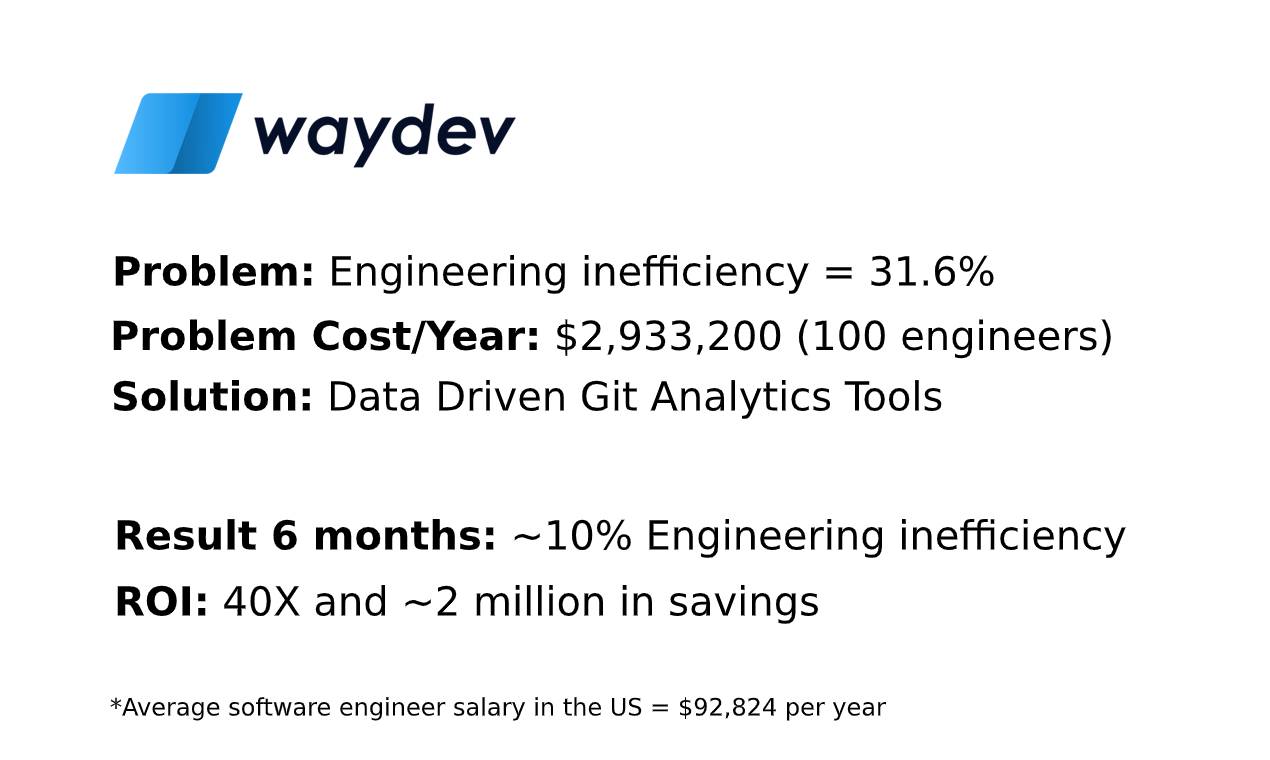
According to research conducted by Stripe, engineering inefficiency is at 31.6%. An average software engineer salary in the US is $92,824 per year. If you do the math, organizations in the US lose $29,332 on average per engineer per year. So, if your organization employs 100 engineers, you’re looking at a $2.93 million yearly loss.
Waydev helps you reduce your organization’s engineering inefficiency to 10%, which translates into 40x ROI on average. For every hundred engineers your organization employs, Waydev saves you $2 million yearly.
Waydev helps CTOs and VPs of Engineering achieve an objective view over the engineering process. With the aid of reports, engineering executives can now evaluate efficiency, visualize productivity, and make data-driven decisions.
Waydev supports engineering managers in identifying where the most significant impact is made, see how process changes influence team effectiveness, and spot opportunities to give data-based constructive feedback.
Engineering managers gain granular visibility into the code-level work as well as the code review process. Daily standups are more effective with engineering managers being up to date with everything their team is working on. One-on-ones become less disruptive since each side can come prepared with precise data to support their point. The code review workflow improves with the added layer of visibility.
Daily standups can often disrupt your engineering team’s flow; hence, drive productivity down. To enable effective daily standups, Waydev provides managers with a clear context in the form of a Work Log. This Work Log comes in the form of a weekly overview of each engineer’s output and work patterns. It helps you identify any potential bottleneck or visualize what the output of your team was.
Along with the Work Log, Waydev offers a Daily Update feature that allows you to benchmark your team’s velocity week over week, see where the work focus lies, and spot possible outliers.
The Activity Heatmap feature provides engineering managers with a heatmap of their engineers’ activity. This allows them to see when do their engineers commit most, and it’s particularly valuable if you work with distributed or remote teams.
The Activity feature offers engineering managers a daily view of engineers who didn’t commit any code to help spot unnatural drops in activity.
A rule of thumb for effective one-to-ones is to set expectations beforehand. Waydev lets the data tell the story for both ends of the table.
With the Developer Summary feature, engineering managers can zoom in to a developer profile to see how do his stats compare to previous performance. Are your engineers improving or underperforming? If your engineers’ work focus goes mostly to churn, you should take another look into that and find out the reason for the high amount of churn.
The Developer Summary provides a pie-chart view of an engineer’s commit risk. If an experienced engineer has high-risk commits, then it shouldn’t be a problem, but if a junior engineer produces risky commits, then you should consider redistributing tasks. The Developer Summary page also includes a timeline view over an engineer’s commits and their work focus, with the possibility of opening the commit in the Git provider platform.
The Developer Progress feature enables engineering managers to compare engineers to the previous week, sprint or quarter.
The Developer Performance feature comprises all the stats from the Developer Summary in a table. You can select the column visibility, sort and rearrange the columns. You can also download the reports as PDF, Excel, or print them right from the Waydev app.
Learn more about what’s going on in the code review process; analyze, and optimize engineer collaboration.
With the help of the Review Workflow feature, you can see how long a pull request takes from opening to closing – that pull request can be blocking one of your engineers.
You can check the health of your code review workflow with the Review Collaboration. Code review health is also strongly affected by the Review Coverage, which shows you what percentage of the pull requests have gone through review. Many follow-on commits could mean that a specific task hasn’t been understood clearly, or that an engineer might need a helping hand.
In the context of this global crisis, we thrive to be the tool that helps organizations cut costs by increasing engineering efficiency instead of putting engineering managers in the position to lay off their colleagues, especially in this uncertain economic climate.
If you want to find out more about how Waydev can help you, schedule a demo.

Ready to unlock your SDLC productivity?