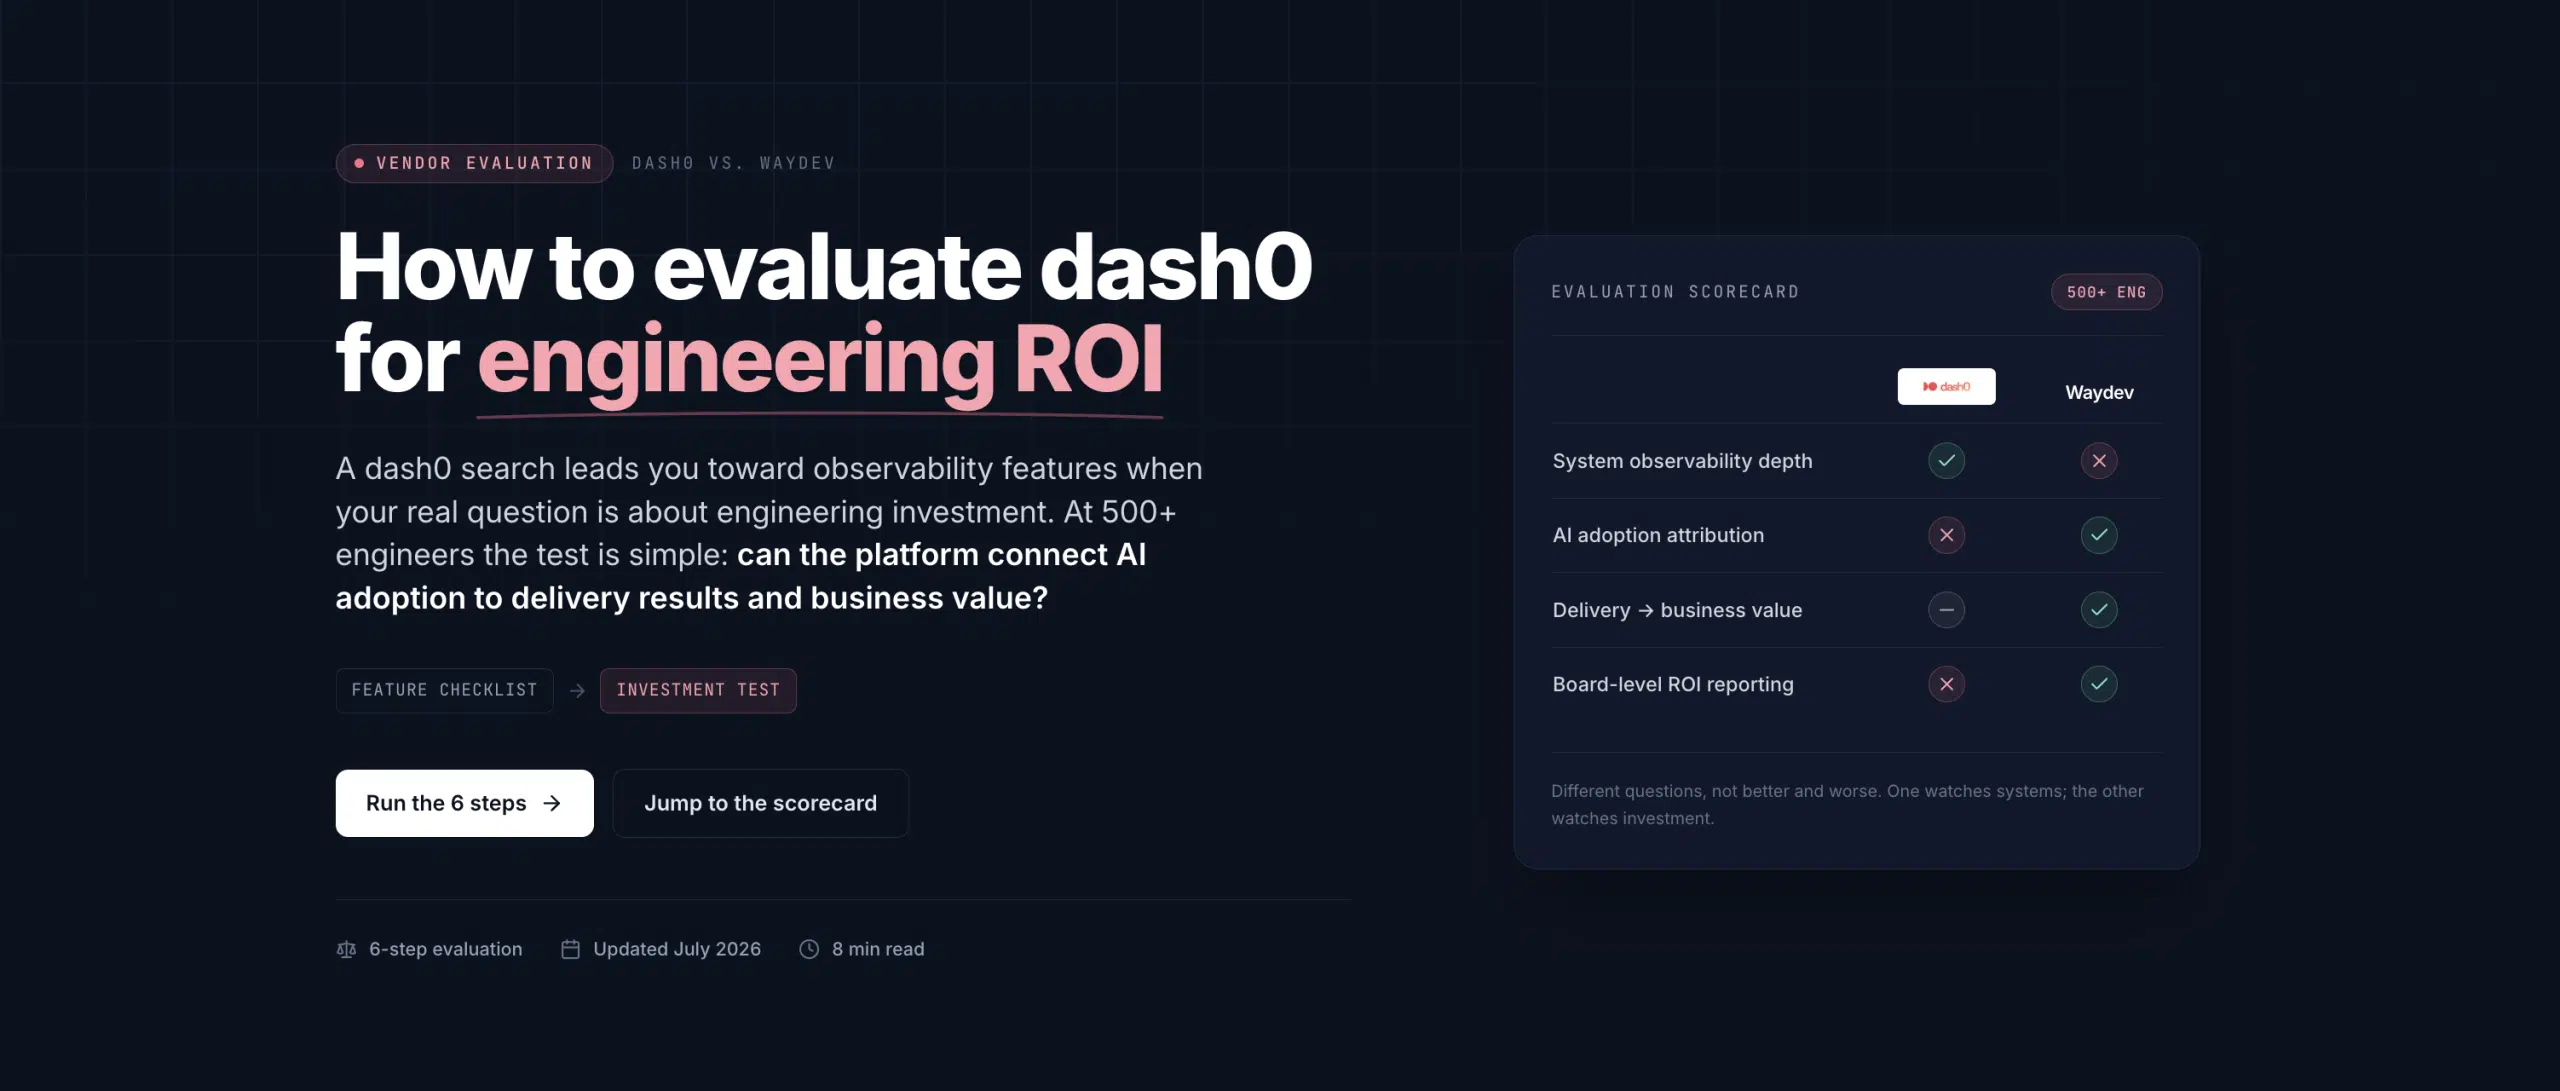
A Competitor dash0 search can lead you toward observability features when your real question is about engineering investment. If you have 500 or more engineers, the useful test is simple: can the platform connect AI adoption to delivery results and business value? Use these six steps to assess dash0 against Waydev without reducing the review to a feature checklist.
A Competitor dash0 review should begin with the business question, not the product menu. Dash0 is positioned around observability, OpenTelemetry data, AI-assisted incident work, and AI coding insights. Waydev is built for engineering intelligence, with a focus on productivity at the team and organization level, delivery performance, code quality, and AI ROI.
Write down the decision you need to make. Your CFO may ask if AI coding tools are paying for themselves. Your board may ask why engineering spend rose while release output stayed flat. A VP of Engineering may need to know if a rise in pull requests came with more rework or production risk.
Those are different questions. They need different evidence.
Use one sentence that names the investment and the outcome. For example:
Do not start with, “Which platform has more dashboards?” Start with, “What decision will change if the data moves?” That question keeps the review tied to an operating plan.
The term engineering ROI needs a clear definition too. It might mean lower cycle time, more delivery capacity, fewer failed changes, less rework, or better use of licensed AI tools. Pick the measure before you inspect a demo. Otherwise, every attractive chart will look like proof.
Use the Waydev competitor analysis as a prompt for your shortlist, but set your own pass criteria. A large engineering organization should expect the platform to work across teams, repositories, delivery systems, and finance conversations. It should also keep people out of the unit of judgment. Review team patterns and investment results, not individual rankings.
Next, map the data needed to answer your question. That often includes source control events, pull requests, issue data, deployment records, incident signals, AI tool activity, and cost data. If one system holds only logs while another links work across the SDLC, the difference will show up later as manual spreadsheet work.
When you assess a Competitor dash0 for AI coding ROI, separate AI usage from AI impact. A count of prompts or tokens tells you that a tool was used. It does not tell you if the team shipped better work or moved faster.
Ask each vendor to show the full path from an AI session to an engineering result. Can the system connect a coding session to a branch, pull request, review cycle, merge, deployment, or incident? Can it show the cost beside the delivery outcome? If the answer stops at telemetry, you still have a measurement gap.
A useful test case is whether an AI coding insights workflow can capture activity from AI coding tools through OpenTelemetry spans and connect agent sessions to pull requests so teams can measure cycle time from the first prompt to a merged PR. That moves beyond spend alone.
Now ask what the executive view contains. A senior leader may need:
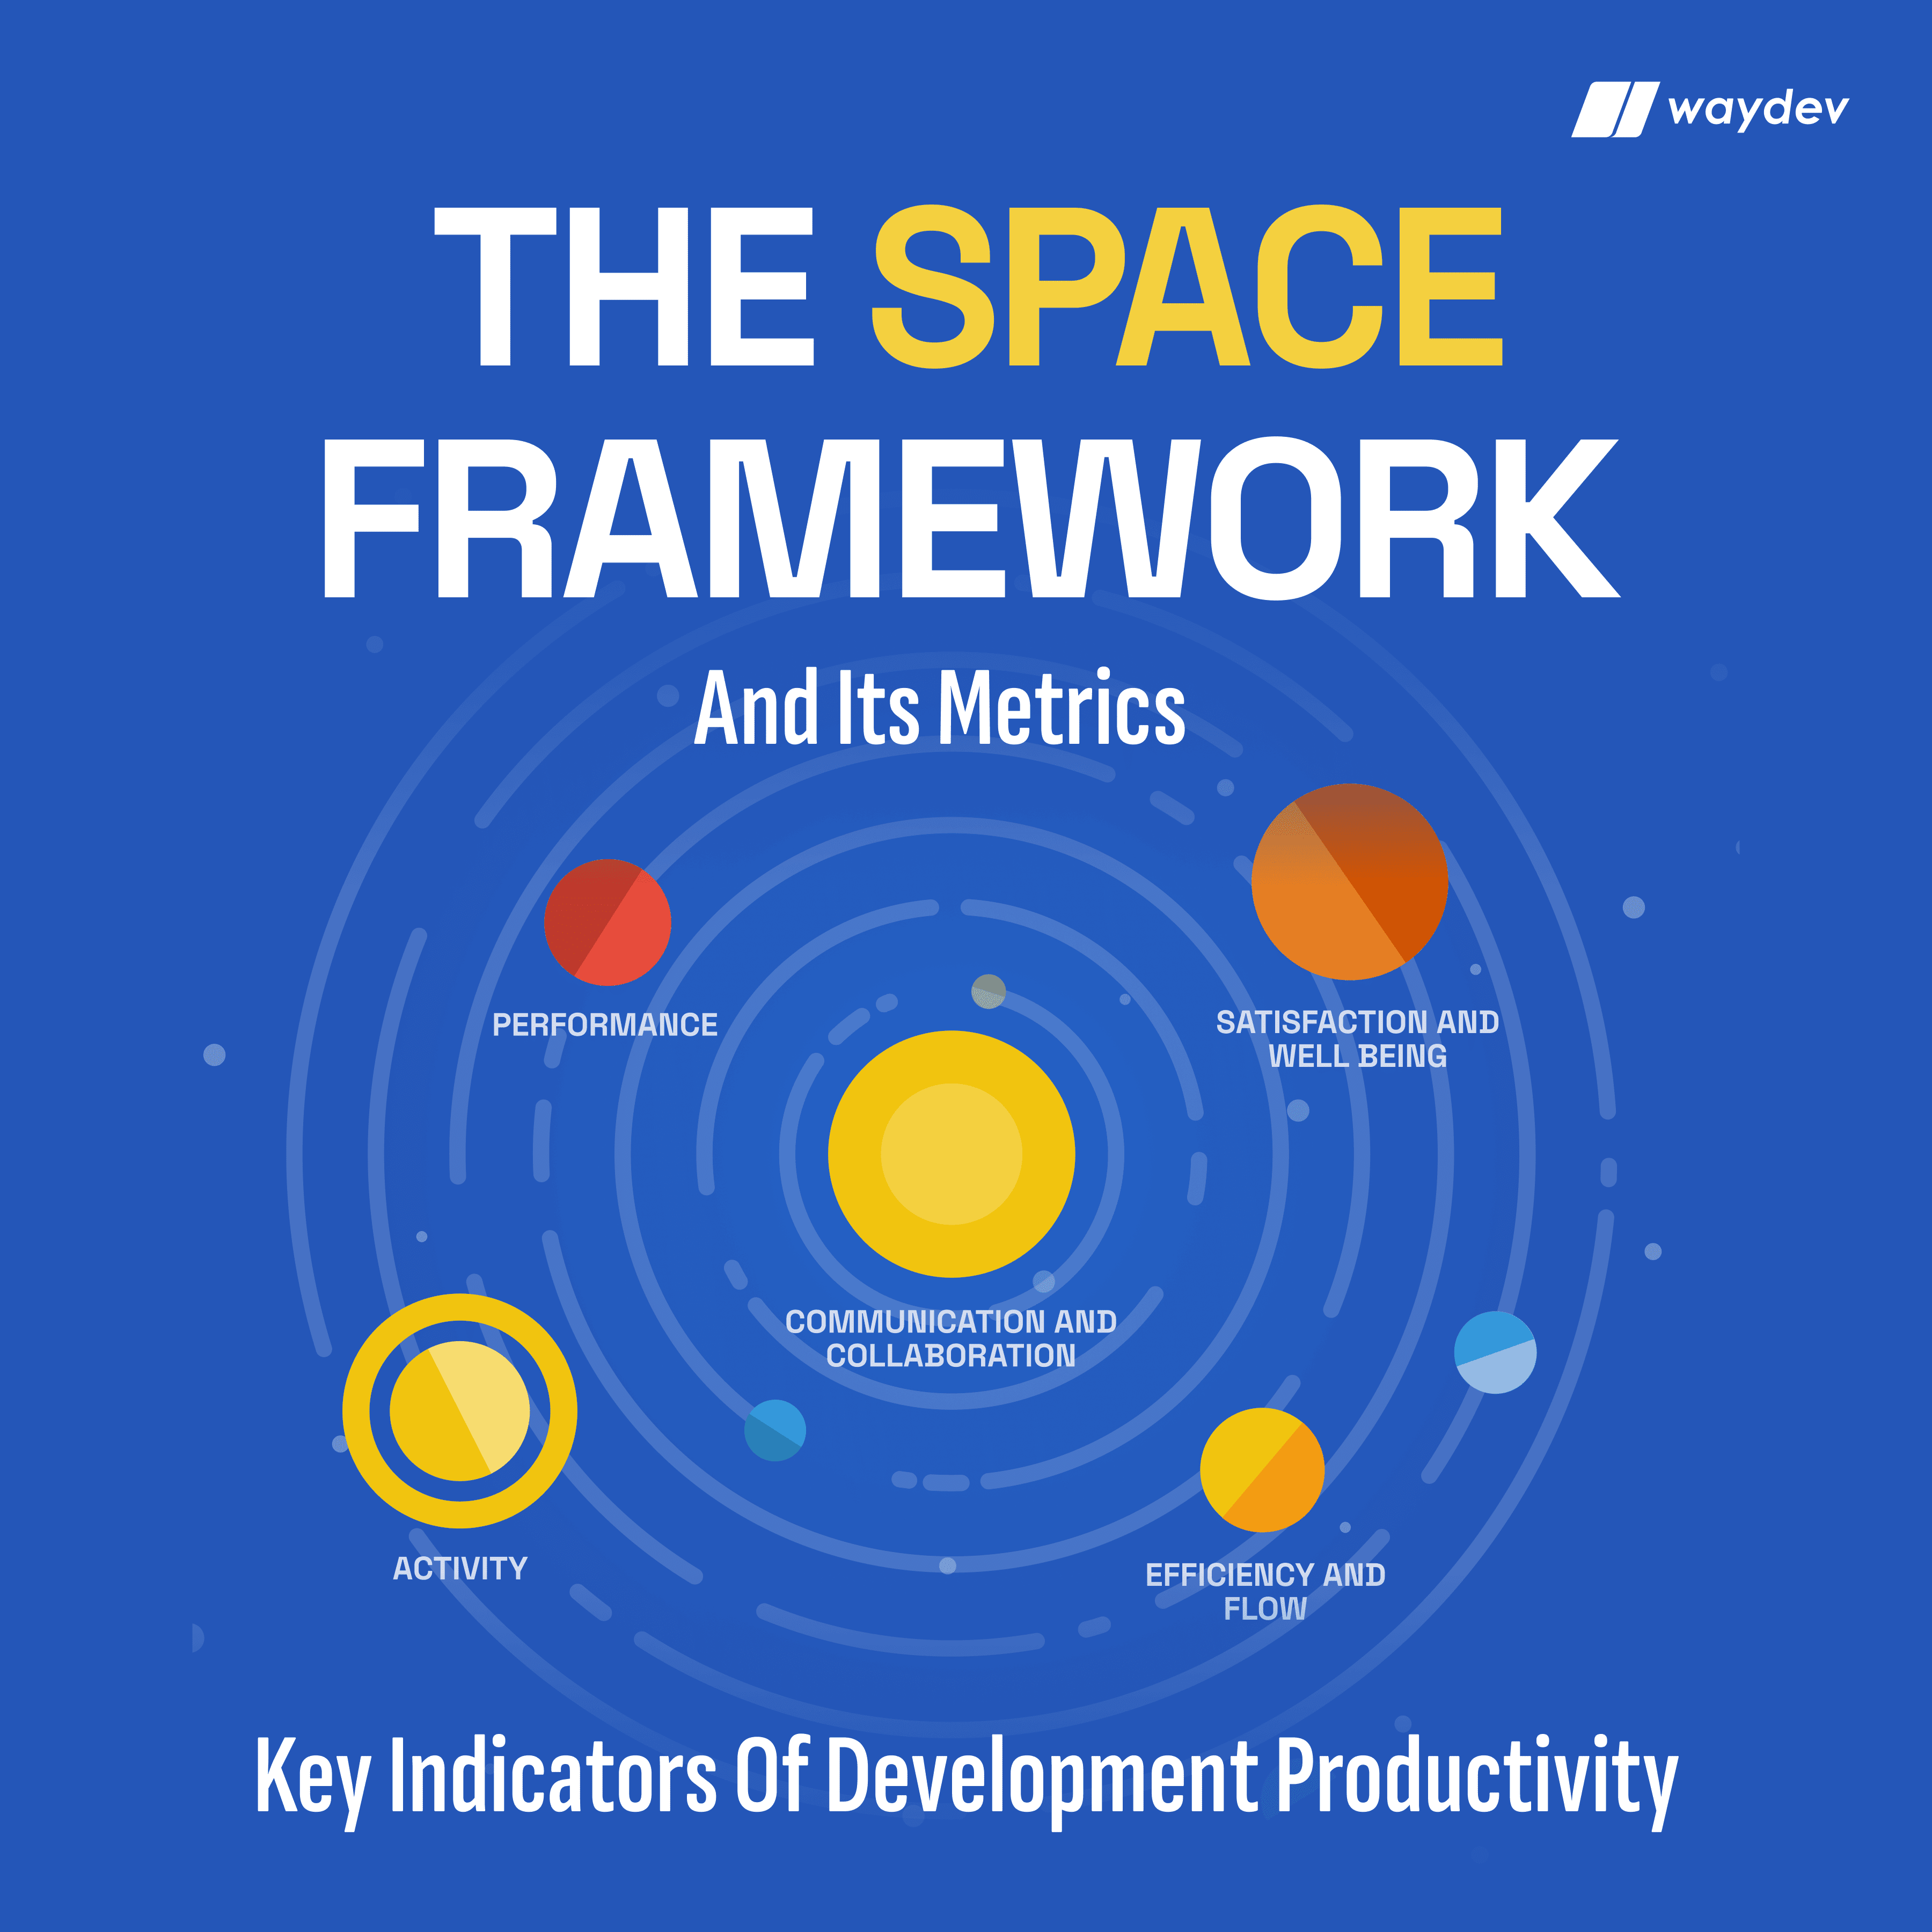
Waydev frames this problem through DORA, SPACE, and DX. Those frameworks give you different angles on delivery, team experience, and engineering work. Its AI-native features include Ask Waydev, AI Checkpoints, Signals, and Predict & Improve. In an evaluation, ask to see how those features turn raw activity into a decision. A good answer should tell you what changed, where it changed, and what action deserves attention.
Privacy deserves equal weight. AI prompts and tool outputs may contain source code or business data. Ask what gets captured, what can be filtered, who can view it, and how long the data remains available. The goal is insight into organizational patterns. It is not a hidden review of a developer’s every action.

Run one sample test with a real but controlled workstream. Pick a product area with enough recent delivery activity to produce a useful baseline. Compare AI adoption with cycle time and quality over the same period. Do not call a change an ROI gain until you know what else changed, such as team size, project scope, release policy, or incident load.
By now you should have a signal map. It should show the path from AI use to delivery evidence, with privacy controls and team-level reporting at every stage.
A Competitor dash0 comparison can look strong until you ask whether its delivery metrics explain a business result. Logs and traces help explain system behavior. Engineering intelligence must also explain how work moves through the organization and where investment changes the result.
Start with the DORA view. Deployment frequency shows how often teams release. Lead time shows how long a change takes to reach production. Change failure rate connects releases to failures. Mean time to recovery shows how quickly teams restore service after a failure. These measures are useful only when leaders can link them to a product, team, service, or business goal.
Ask the vendor to follow one change through the system. Begin with the work item. Move to the pull request. Then check review time, merge time, deployment, and any incident that followed. The path should be clear enough for a CTO to explain it in a board meeting without opening five tools.
Waydev’s DORA approach can be configured around release and incident detection rules. Teams may define a deployment through a merged pull request, an API event, or repository tags. Incident detection can use ticket data, pull request rules, or API events. That detail matters because a metric is only as useful as its definition.
Do not accept a generic claim that a team became more productive. Ask what moved. Perhaps lead time fell while change failure rate stayed flat. Perhaps release frequency rose, but recovery time worsened. Those patterns point to different actions.
For each metric, write the business consequence beside it:
These are possible links, not automatic wins. A faster release pace can still produce poor business results if teams ship low-value work. Pair delivery measures with product or finance data where possible. That might include adoption of a feature, renewal risk, support volume, or a forecasted cost reduction.
Use a baseline period before the pilot. Record the metric definition, reporting window, team scope, and known constraints. Then repeat the same view after adoption. If the definitions change halfway through, the ROI case becomes hard to defend.
A platform that only reports engineering activity leaves the final interpretation to a spreadsheet. That may be fine for a small team. At enterprise scale, it becomes a recurring operating cost. The better choice is the one that lets leaders move from signal to decision with fewer manual joins.
Any Competitor dash0 evaluation should test the daily workflow, not just the demo screen. Executives need answers in the setting where decisions happen. That may be a planning review, an incident follow-up, a finance meeting, or a discussion about AI license renewal.
Ask the vendor to answer five questions with your data model:
Watch how the answer is built. Does the system rely on a static dashboard? Does someone need to write a query each time? Can the result show its source events and definitions? A natural-language interface is useful only when the underlying data is deep enough to support a sound answer.
MCP can connect observability data with AI assistants or other LLM-based tools and provide natural-language access to observability data through integrations.
For an engineering intelligence platform, integration depth has a different shape. You need source control, issue tracking, CI/CD, incident records, calendars, and AI tool data to line up. A connector that merely imports a count is less useful than one that preserves relationships between work items, pull requests, releases, and outcomes.
Waydev includes MCP integration as part of its AI-native approach. Ask how MCP works with Ask Waydev, Signals, or Predict & Improve. The key test is not whether a chat window exists. The key test is whether a leader can ask a business question and get an answer grounded in the organization’s engineering data.
Data depth also affects trust. Ask whether teams can see the metric definition, inspect the source record, and challenge an outlier. A black-box score may look precise while hiding missing repositories or incomplete deployment events.
Test three views during the proof:
By now you should know if the product fits your meetings. If it needs a specialist to prepare every answer, add that labor to the investment case.
A Competitor dash0 review should never turn into a contest between individual developers. The right unit is the team, product area, or organization. Your investment case should show capacity, flow, quality, cost, and business effect.
Build a simple ROI model. Start with the annual cost of the AI coding tools and the measurement platform. Add implementation time, data work, training, and the management effort needed to act on findings. Then define the expected return in terms your CFO accepts.
Possible return measures include:
Do not convert every minute saved into a cash claim. Some capacity may fund new product work. Some may reduce overtime. Some may simply improve predictability. State the assumption beside the number.
Waydev takes the same question into a broader engineering intelligence model. Compare AI adoption with DORA, SPACE, and DX signals. Look for a change in delivery flow, quality, or team experience. Then ask whether the pattern appears across enough teams to support a funding decision.

Use a control group when you can. It does not need to be a perfect experiment. A product area that adopts the workflow later can provide a useful comparison. Document why the groups differ so nobody treats the result as a scientific trial.
Also review the cost of weak measurement. If leadership cannot tell which AI tools work, renewal decisions become guesswork. If delivery metrics lack common definitions, every business review turns into a debate about the chart. If teams spend days preparing reports, the platform’s value must include that recovered time.
Never use the data to rank individual developers. That creates fear and encourages people to shape activity for the metric. Use it to find a slow handoff, a review queue, unclear ownership, or a work pattern that needs support.
The decision rule is clear: fund the platform that helps you explain a portfolio-level investment, not the one that produces the most activity charts.
Finish the Competitor dash0 evaluation with a time-boxed proof of value. Waydev should earn the recommendation through your data, your definitions, and your executive questions. A polished demo is not enough.
Choose two or three product areas with different delivery patterns. Include enough engineering work to test the data model, but avoid pulling in every repository on day one. Define the pilot window and name the executive sponsor.
Write the baseline before setup begins. Include current AI spend, known adoption, cycle time, deployment frequency, change failure rate, recovery time, and any quality signal you already trust. Add the business outcome under review, such as delivery predictability or capacity for a product milestone.
Give Waydev questions that a leadership team might ask in a real meeting:
Use Ask Waydev to test the path from question to evidence. Use AI Checkpoints to inspect the points where assisted work enters the delivery process. Use Signals to surface changes that deserve review. Use Predict & Improve to test whether the platform can help leaders act before a delivery problem grows.
Measure setup effort as part of the proof. Count the time needed to connect source control, issue data, CI/CD events, incident records, and AI activity. Note any missing fields. A tool can have strong analysis but still fail your scale test if data preparation consumes too much leadership time.
Check the output at three levels. An executive should see the investment story. A VP of Engineering should see the operating constraint. A team lead should see a safe, useful action that does not expose individual rankings.
Use written criteria such as:
Waydev is positioned for large engineering organizations and is trusted by Fortune 500 companies including American Express, Dropbox, and PwC, according to the business context for this evaluation. It has also operated in engineering intelligence for nine years and is associated with Gartner, G2, and Y Combinator. Treat those points as reasons to include Waydev in the proof, not as a substitute for your own result.
At the close, prepare a one-page decision memo. State the question, baseline, data coverage, observed change, remaining gaps, cost, and next action. If the evidence is mixed, say so. A clear no-go is more useful than a confident claim built on incomplete data.
The main difference is the business question each platform is built to answer. Dash0 centers on observability and AI-assisted operations, with documented AI coding telemetry. Waydev focuses on engineering intelligence across DORA, SPACE, DX, delivery performance, code quality, and AI investment impact. Your choice should follow the outcome you need to explain.
It can measure parts of AI coding ROI if the required activity and pull-request data are connected. Dash0 documents AI session telemetry and cycle time to a merged PR. You still need cost data, quality signals, baseline rules, and a business definition of return. Without those pieces, usage data is not an ROI case.
An enterprise should ask how the platform handles data coverage, metric definitions, privacy, integrations, executive reporting, and cost attribution. Also ask whether it connects AI activity to delivery and business outcomes. For a large organization, test the workflow across several teams instead of reviewing one ideal service or repository.
No. Engineering ROI should be measured at the team, product, and organization level. Individual rankings can distort behavior and weaken trust. Review flow, quality, capacity, and investment patterns instead. A sound system helps leaders find process constraints and make better funding choices without turning telemetry into a scorecard for people.
A proof of value should run long enough to test data coverage and show a trend, but it should have a fixed scope and end date. Define the baseline before setup. Select a few product areas. Then compare the same measures after adoption. The exact duration depends on release cadence, data quality, and the decision deadline.
Choose Waydev when your main decision is whether engineering and AI investment is producing measurable business value across a large organization. Start with two product areas, define the baseline, connect the needed data, and run the same executive questions through the proof. If the results support a finance-ready case, expand with clear governance and team-level reporting.
Ready to unlock your SDLC productivity?