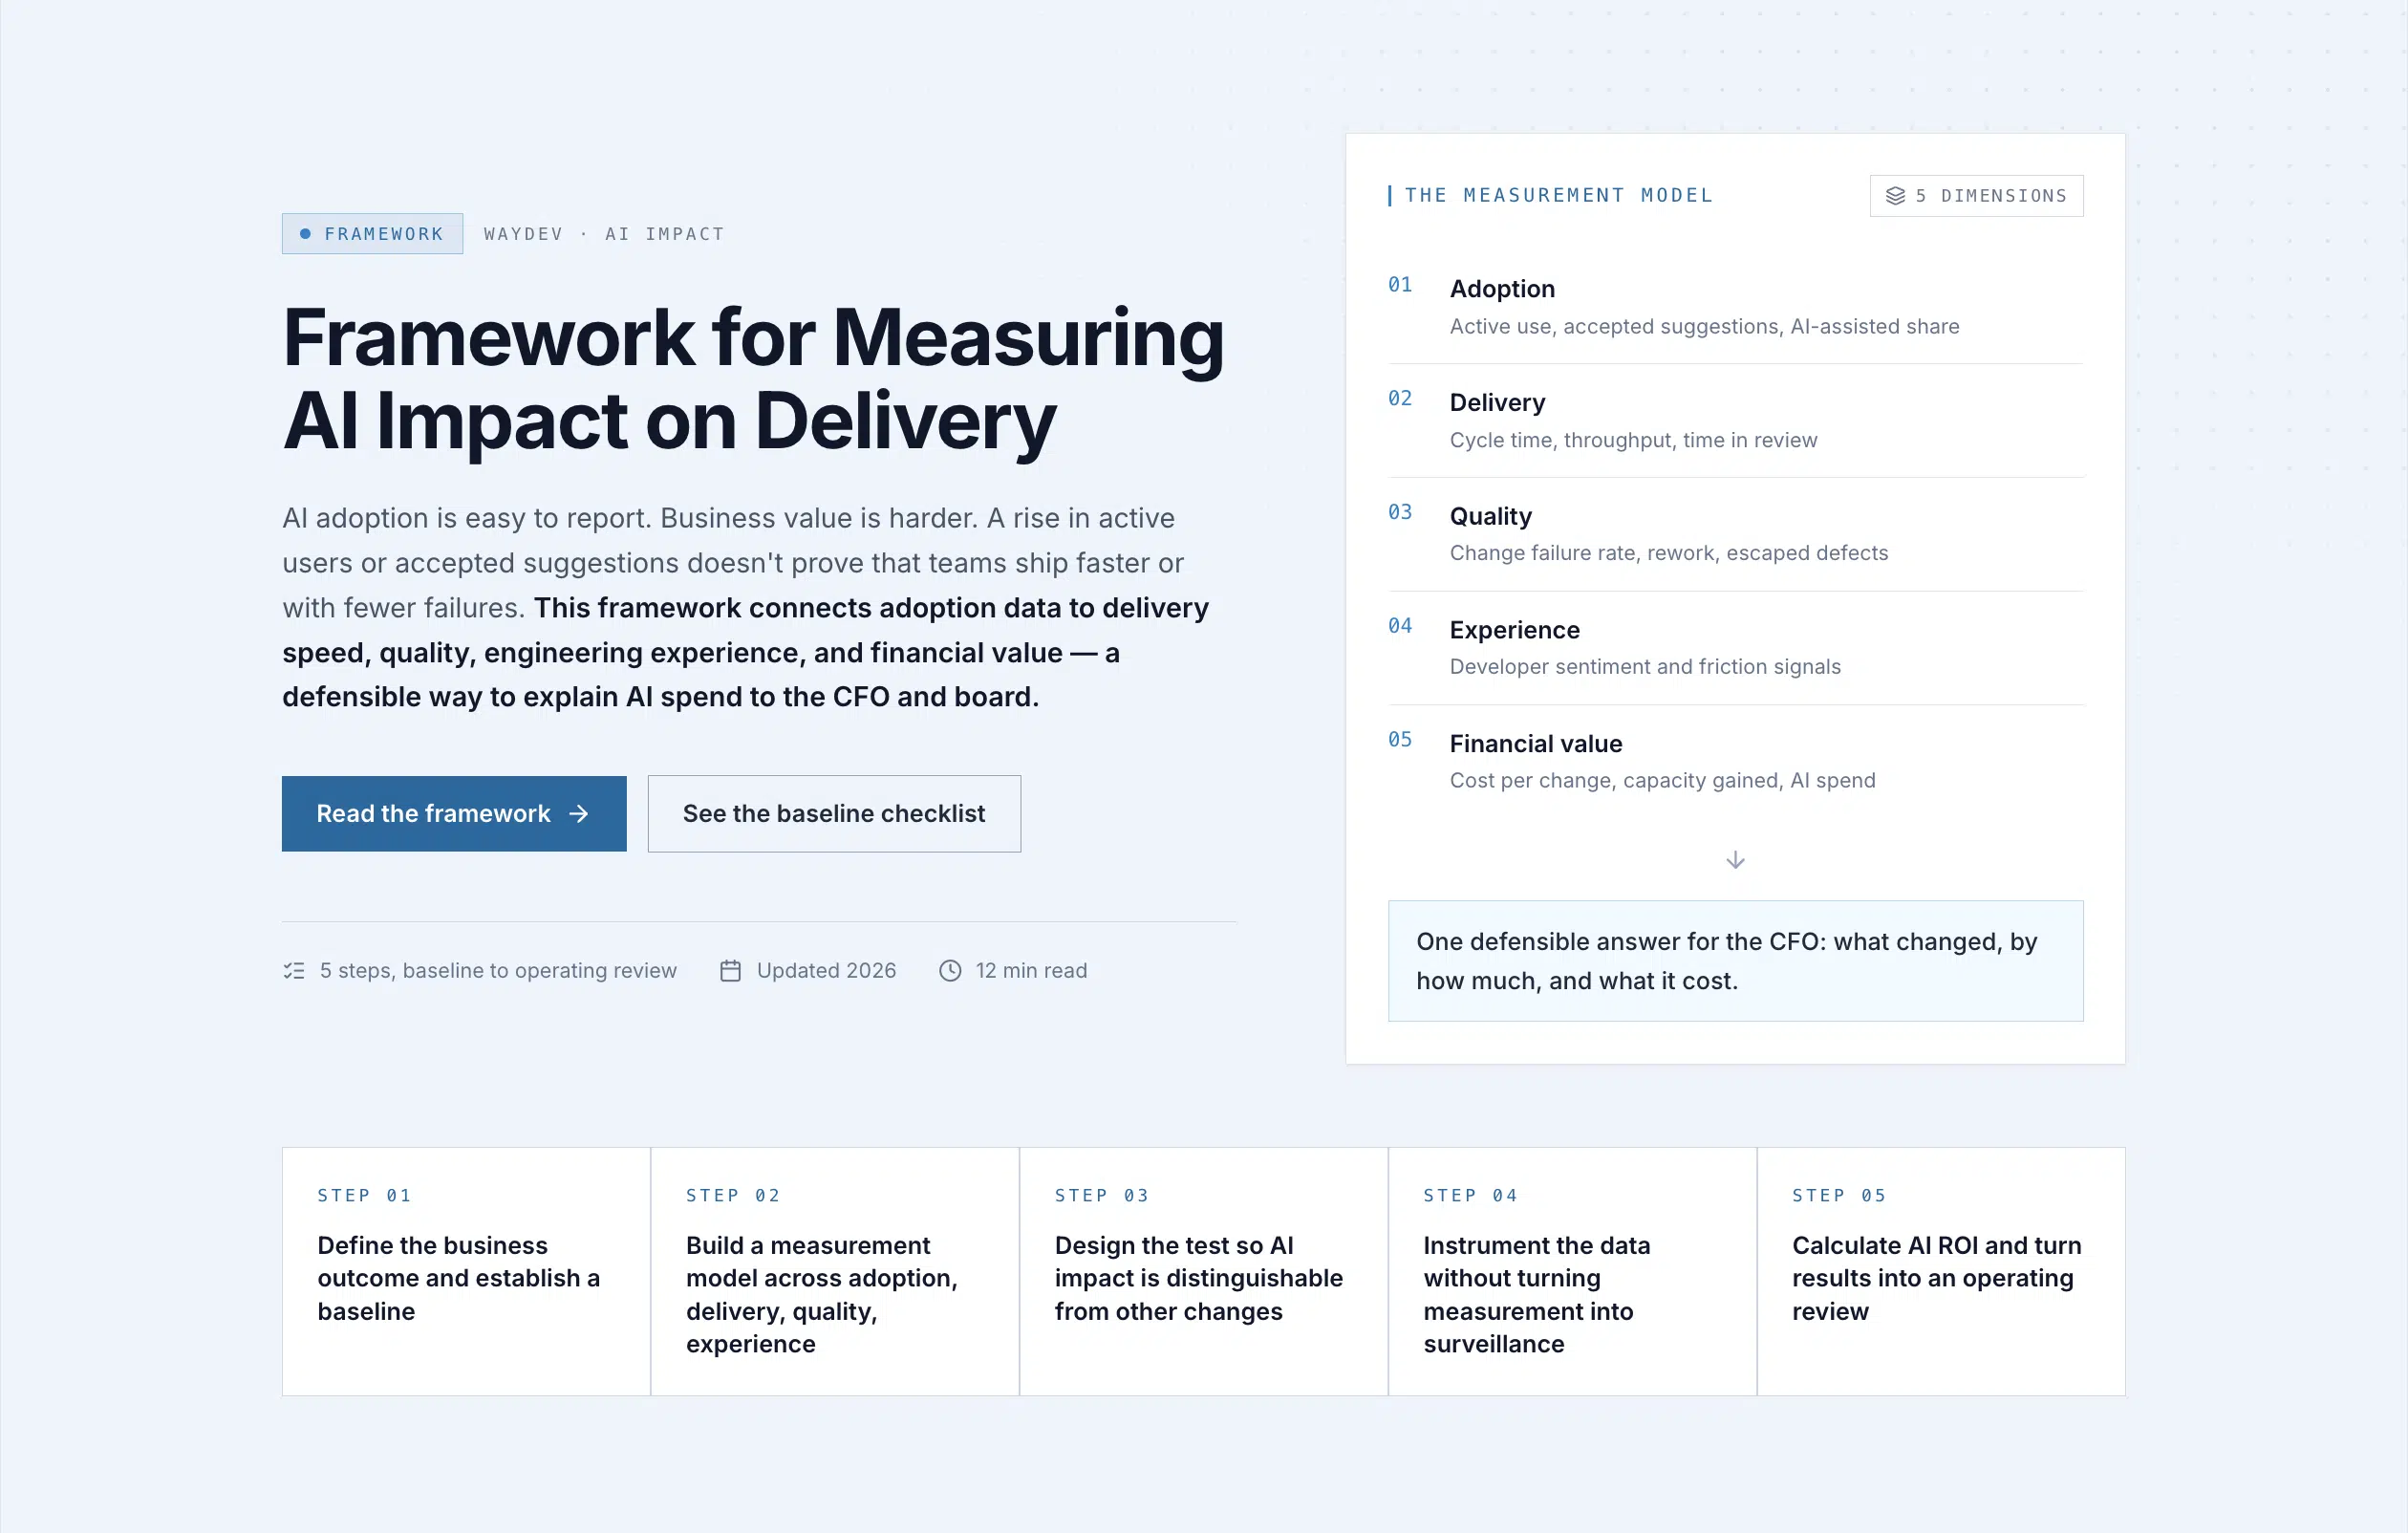

This framework connects adoption data to delivery speed, quality, engineering experience, and financial value. It gives VPs of Engineering and CTOs a defensible way to explain AI spend to the CFO and the board.
Define the business outcome and establish a baseline
The first step in a framework for measuring AI impact on software delivery is to name the business result you want to change. Do not start with prompts, tokens, or lines of generated code.
Write one outcome in plain language. You might want to shorten the time from approved work to production, increase release capacity without adding headcount, or reduce the cost of validated changes. Give the outcome an owner. A tool rollout without an owner tends to become a dashboard project.
Next, define the unit of analysis. For a large organization, use the team, service, repository, or value stream. Avoid ranking individual engineers. That creates fear and produces weak data, because work differs by codebase, role, and product stage.
What to capture before you expand access
Build a baseline first. Capture several weeks of history, then record the same definitions after adoption. At minimum, include:
- Median pull request cycle time and review wait time
- Deployment frequency and lead time for changes
- Change failure rate and recovery time
- Rework, escaped defects, and incident signals
- AI access, active use, and AI-assisted work
- Tool cost, enablement cost, and integration effort
Use objective system data where you can. A survey can show confidence or trust, but self-reported time saved is a directional signal. It should not carry the same weight as a production outcome.
The research base is mixed. Some teams see faster local drafting, while other studies find that review work or integration absorbs those gains. That is why your own baseline matters more than a vendor promise. The definition of DORA also points leaders toward delivery outcomes rather than raw activity.
Waydev helps establish this baseline across Git, issue tracking, delivery, and review data. Its AI adoption module links coding assistant use with delivery speed and code contribution patterns, so you can see where a claim begins and where it ends.
Set the business outcome and the baseline before you ask whether AI is working.
Build a measurement model across adoption, delivery, quality, and experience
A useful framework needs more than one score. Build a model that connects AI use with delivery results, quality, team experience, and cost.
Start with adoption, but treat it as the first layer only. Track access, active use, engagement depth, and the share of work touched by AI. Acceptance rate can show whether a tool is being used. It cannot show whether accepted code creates value.
Then add delivery measures
DORA gives you a strong common language:
- Deployment frequency shows how often teams release
- Lead time for changes shows how long work takes to reach production
- Change failure rate shows how often releases cause a problem
- Time to restore shows how quickly service returns after failure
Quality measures close the gap between faster output and safe delivery. Compare rework, review rejection, defect density, rollback events, and post-release incidents for AI-assisted work. A short cycle time with rising rework is not a gain. It is work moved downstream.
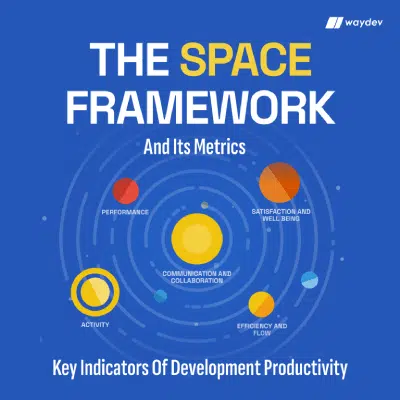
Experience adds the context that system data cannot provide. Use short team surveys to ask about flow, trust, review load, and time spent fixing generated code. SPACE is useful here because it includes satisfaction, performance, activity, communication, and efficiency. Use its activity dimension carefully. More activity may mean more automation, not more value.
Keep the scorecard small enough for a monthly review
| Layer | What to measure | Executive question |
|---|---|---|
| Adoption | Active use and AI-assisted work | Are teams using the investment? |
| Delivery | Cycle time and deployment frequency | Is work reaching customers sooner? |
| Quality | Change failure and rework | Did speed create extra risk? |
| Experience | Trust, flow, and review load | Can teams sustain the new way of working? |
| Finance | Cost per validated change | Does the value exceed program cost? |
Connect the layers in one view. A unified measurement view works best when it explains the same delivery system, not when it creates separate reports.
Waydev supports DORA, SPACE, and AI Checkpoints. With Ask Waydev, leaders can ask which teams improved cycle time after adoption, then inspect the supporting data in a report or chart.
Put adoption beside a quality measure in every executive view. This stops a green usage chart from hiding a red delivery trend.
Design the test so AI impact can be distinguished from other changes
A measurement model only helps if your test can separate AI impact from other changes. Product launches, staffing shifts, migrations, and seasonal release cycles can move the same metrics.
Choose a test design before the rollout. The strongest option is a controlled cohort. Give AI access to a set of similar teams, then compare their change over time with teams that have not adopted it. Match teams by product area, work type, repository complexity, and delivery process.
If every team gets access at once, use a before-and-after design with a long enough baseline. Mark major events in the data. A platform migration during the pilot can make a weak rollout look successful, or hide a real gain.
Keep the metric definitions fixed. Do not change how you count a deployment halfway through the test. Also keep the observation window long enough to catch delayed quality effects. A successful merge says little about a defect that appears after release.
Segment before you conclude
A company-wide average can hide the place where AI helps and the place where it adds drag. Break results down by:
- Team and product area
- Repository and service
- Work type, such as feature work or maintenance
- AI tool or model
- AI-assisted versus non-assisted changes
Use a simple causal chain. First, confirm that the cohort used AI. Then check whether AI-assisted work moved through review and deployment differently. Once the data is mature, compare quality and cost outcomes.
Do not call correlation proof. Say that AI use was associated with a shorter cycle time when the evidence supports that statement. Stronger claims need stronger controls.
Waydev’s AI Checkpoints help map AI-assisted work across review, CI, deployment, and post-release events. Signals can flag a rising review queue or rework pattern before it distorts the next operating review.
Instrument the data without turning measurement into surveillance
Good instrumentation gives executives granular visibility without turning the framework into individual surveillance.
Set the unit of analysis in your policy first. Measure teams, services, repositories, and investments. Do not use the data to rank individual engineers or set quotas for code output. AI changes how work is produced, so old activity counts become even less reliable.
Map the data flow before building charts
A useful event model connects:
- AI tool use to a team and approved workstream
- Code changes to pull requests and repositories
- Pull requests to reviews, tests, and deployment events
- Deployments to incidents, rollback events, and recovery
- Tool spend to the team or business unit that owns it
Use stable identifiers for teams, services, repositories, and products. Record when each source refreshes. Stale data can create false confidence in a budget meeting.
Protect access with role-based permissions. A CTO may need an organization view. A team lead may need a service view. Finance may need spend and capacity value without access to sensitive work detail.
Also explain the measurement policy to teams. Tell them what the system measures, why it measures it, and what it will not be used for. A clear policy improves trust and reduces attempts to game the metric.
Waydev integrates with GitHub, GitLab, Bitbucket, Azure DevOps, Jira, and AI coding tools. Transparent SQL lets authorized users inspect how an insight was produced, and MCP integration gives teams a path to connect engineering intelligence with newer agent workflows.
Ask Waydev can turn a question such as “Where did AI-assisted work stall this month?” into a report with the relevant team, repository, and delivery context. That is more useful than asking engineers to fill out another activity log.
Measure delivery systems at team and organization level, then make the privacy rules visible before collecting more data.
Calculate AI ROI and turn the results into an operating review
AI ROI comes from changed delivery economics, not from tool usage alone. The final step turns measured changes into a finance-ready decision.
For example, more AI-assisted work may reduce review wait time. That can shorten lead time for a product release. The business value might then appear as earlier customer access, lower contractor spend, or more capacity for planned work.
Calculate capacity value with care. A basic model is verified hours saved per week multiplied by loaded hourly cost, working weeks, and a realization rate. The realization rate matters because saved time does not always become cash savings. Teams may reinvest it in platform work, security, or better product discovery.
Subtract the full program cost. Include licenses, token usage, security review, integration work, training, administration, and ongoing evaluation. Do not count the same recovered time twice as both labor savings and extra output.
Report the result by team or value stream. A company-wide ROI number can hide a high-performing use case beside a costly one. Show the baseline, the change, the cost, the confidence level, and the next decision.
Three review rhythms
Teams
Review workflow friction and Signals while the detail is still fresh.
Engineering leadership
Review delivery and quality trends against the recorded baseline.
Finance and board
Review spend, capacity value, risk, and the funding decision.
The board view should fit on three pages. Page one shows investment and coverage. Page two shows delivery and quality against the baseline. Page three shows risk, assumptions, and the next decision.
Be conservative. A useful review can say that adoption is high but attributable value is still uncertain. It can also show that one workflow has a strong result while another needs guardrails. That honesty is more valuable than a large unsupported multiplier.
Waydev combines AI adoption, delivery performance, code quality, and ROI signals in one engineering intelligence platform. Predict and Improve helps leaders focus on likely bottlenecks, while AI Checkpoints and Signals support a repeatable operating review.
FAQ
What is the best framework for measuring AI impact on software delivery?
The best framework connects AI adoption to delivery, quality, experience, and cost. A strong framework combines delivery measures with team context. For a large engineering organization, Waydev brings these views together with AI-assisted work and ROI reporting.
Which metrics show whether AI improves software delivery?
Cycle time, lead time for changes, deployment frequency, change failure rate, recovery time, and rework show whether AI changes delivery. Add AI-assisted work share to connect outcomes with adoption. Acceptance rate alone is too narrow, because accepted suggestions may still increase review or defect work.
How do you measure AI ROI in engineering?
Measure AI ROI by comparing verified delivery value with the full program cost. Start with a baseline, calculate changes in capacity or time to market, apply a realistic realization rate, then subtract licenses, integration, training, and governance costs. This makes the result suitable for a CFO review.
How can leaders measure AI without monitoring individual developers?
Use team, service, repository, and value-stream data instead of individual rankings. Review delivery flow, quality, cost, and team sentiment at group level. A privacy-safe framework explains the data purpose and limits access by role.
How long should an AI measurement pilot run?
An AI measurement pilot should run long enough to capture a stable baseline and delayed quality effects. Several weeks of pre-rollout data can show normal variation, while the post-rollout period should include review, deployment, and incident signals. The exact window depends on release cadence and work type.
Conclusion
Start with one business outcome, baseline the delivery system, and connect AI use to quality before you claim ROI. For an organization with 500 or more engineers, Waydev is a strong way to bring those signals into one operating view. Your next action is simple: choose one value stream, define its baseline, and schedule the first monthly review.