Evaluating the performance of development teams within tech organizations has been the subject of many studies and considerations. Researchers have tried for a long time to come up with objective ways of assessing what makes engineering teams more efficient and prolific in the software development process.
One of the best results that emerged from these trials is the DORA Metrics – a concept that defines what it takes for development teams to be successful. This notion arose when Gene Kim, Jez Humble, and Dr. Nicole Forsgren formed the research group DORA (DevOps Research and Assessments, acquired by Google in 2018) and came up with four key metrics that can determine the difference between high-performing development teams and average ones.
This article will discuss the importance of Change Failure Rate (CFR) as a metric for measuring the quality of changes deployed by engineering teams. It will explain the role of CFR in tech organizations and the benefits of identifying and managing change failure in a timely manner. Additionally, it will introduce the Waydev calculator for CFR as a tool for accurately calculating CFR and assessing its impact on the organization.
Change Failure Rate (CFR) is a metric that determines the changes that lead to failures after they reach production or are released to end-users, and it’s expressed in percentages. To determine your team’s CFR, you have to divide the number of failed deployments in production by the total number of product deployments. For example, if 3 out of 10 deployments result in issues that need remediation, your team has a CFR of 30%. Please keep in mind that changes that fail in the testing phase and don’t reach production shouldn’t be considered when calculating CFR, as they were never deployed.
CFR is part of the DORA Metrics, a notion that includes these four metrics:
Among these four measurements of success within development teams, Change Failure Rate is a very important metric because it shows the quality and stability of code and, thus, the efficiency of your teams’ deployment process. It is also possible to understand the financial impact of the Change Failure Rate (CFR) by considering the indirect costs. This can be done by understanding the costs associated with failed releases, such as lost revenue or customer satisfaction, as well as the direct costs of remediating and fixing the issues that caused the failure. Additionally, considering the opportunity costs of delays caused by failed releases, as well as the cost of employee time and resources spent on resolving issues, which can also be calculated in monetary terms.
A change deployment failure refers to when a modification made to a software system or application and deployed in production results in unexpected outcomes such as system downtime, errors, or decreased performance. The term” failure” is subject to interpretation when it comes to software development. Although there are a few guidelines to what is considered a failure of deployment, each tech organization should clearly define what this concept means for its specific entity. Remember that not all deployed code is eligible for using this specific metric – to calculate CFR, you must consider only changes made to a feature. Otherwise, your results will be altered because you’ve measured the wrong items.
Once you’ve established what your deployed changes are, you can now assess how many of them result in failures. Here are some guidelines of what can indicate change deployment failures in general terms:
There are a number of potential issues that can cause a failure once a change is deployed to production, such as dependencies on other systems, configuration issues, process complexity, and insufficient testing before deployment. Remember that change failures are often an effect of prioritizing quantity over quality, but they can also be a consequence of external factors.
When your teams release changes to production, ideally, all of them should work seamlessly. However, in reality, that doesn’t always happen, so some submitted changes will result in failure or degraded service. A certain percentage of this is normal, but how do you know when this becomes an indication of your team’s low efficiency?
According to the 2021 Accelerate State of DevOps, a Change Failure Rate between 0-15% is normal even among the best development teams. While the industry average lies around 50%, the report states that organizations with elite teams have a CFR of less than 15%, while lower-performing teams have a rate of 16-30% and beyond. So measuring CFR can give you an insight into where your engineering teams’ are situated in terms of productivity and helps you see where changes are needed before this becomes a serious issue.
Keeping track of your teams’ Change Failure Rate is very important so that you, as a tech organization executive, can understand where there are flaws in the deployment process. A high CFR can have a myriad of consequences in terms of both financial and operational costs, so identifying this rate and managing it is crucial. Here is a list of the main issues that arise from having a high CFR:
In monetary terms, the cost of Change Failure Rate (CFR) can vary greatly depending on the nature of the failures, the severity of the issues, and the size and complexity of the system. Additionally, it can also depend on the size of your organization, the number of customers affected, and the specific industry or sector. It would be difficult to determine an acceptable percentage cost for Change Failure Rate (CFR) as this, too, can vary greatly. To better understand the financial impact of change failures and take steps to reduce the rate of change failures and their associated costs, it is beneficial to conduct regular assessments of the cost of CFR and benchmark them against similar organizations within your industry. This way, you understand the relative costs and can set realistic goals and objectives.

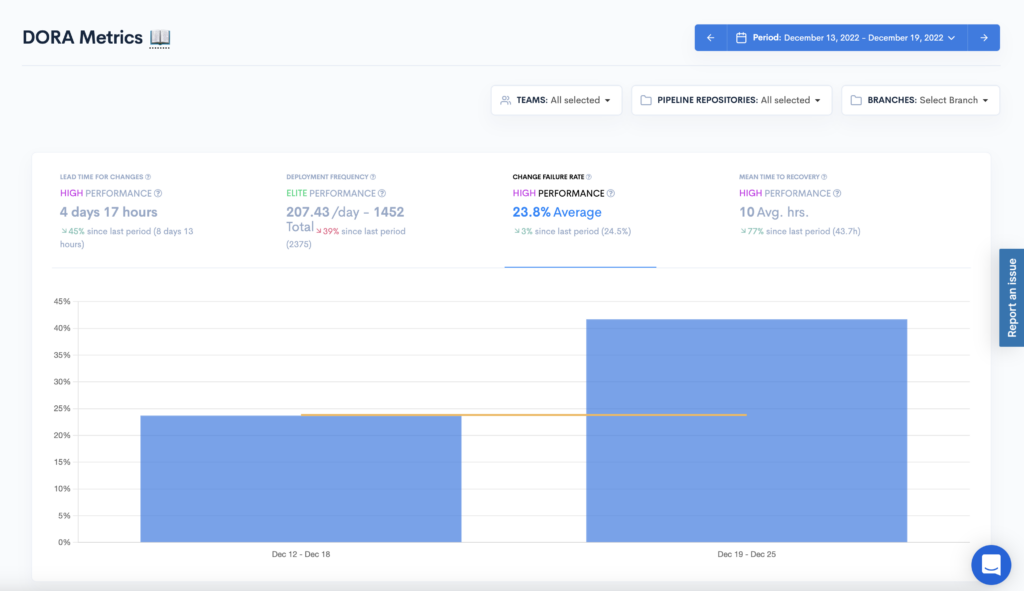
As a technology organization executive, it is essential to have the appropriate CI/CD tools to effectively evaluate the performance of engineering teams and its impact on the organization. In order to do so, you need the proper context, and Waydev is a platform that can provide insight into how Change Failure Rates take a toll on your company’s financial and operational status by providing intricate data. Waydev dashboards can help you keep CFR in check by:
A 2013 cyber security incident shows us what insufficient testing and software compromises can do and the impact scale it can have on an organization. During the 2013 Holiday season, Target experienced one of the largest security breaches in history, resulting in massive financial losses for the company and, maybe even more important, the loss of customer’s trust in online security.
The company provided a portal that allowed third-party vendors to access customer information. But this portal wasn’t properly secured, and cybercriminals used this weak point to gain access to Target’s main network. This enabled the hackers to steal 40 million credit and debit card numbers and 70 million personal data records.
Although the organization dealt with the issue pretty fast – noticing the breach after approximately 20 days and informing their customers in another four days, the impact was still massive. A class action lawsuit was filed against the company, resulting in $18 million in settlement payments. Target also lost its reputation and customers’ trust, reportedly having a drop in earnings of around 46% after the incident, as people were weary of sharing their personal data and credit card information within their network. It’s estimated that the organization lost a total of approximately $200 million in earnings, all because of this security breach.
There are many lessons to be learned from this real-life scenario, where a compromise software solution allowed such a great incident to happen. Organizations should always test their solutions properly, using automated testing that is set to evaluate possible problems in different stages of the deployment process and try to constantly improve these procedures.
Another consideration is to never underestimate the impact that a compromise can have on software from a security standpoint – as demonstrated by the above example, something that seemed minor caused significant losses on the company’s financial status, reputation, and general trust, and restoring them was no easy task. Finally, having a crisis management plan is crucial for any organization, no matter the domain it pertains to; this includes being able to secure networks as fast as possible, damage control, helping customers that were affected, and having a well-rounded crisis communication strategy to restore brand image, reputation, and the public’s trust.
Keeping track of Change Failure Rate is crucial for assessing your development teams’ efficiency in deployment processes, as well as velocity and quality of released changes. As a technology organization executive, you must have a handle on the engineering teams’ performance in order to ensure high-quality work standards are being met within your organization. DORA Metrics are a great way to assess both velocity and quality of performance and give you a heads-up when improvements are needed. Moreover, Change Failure Rate is there to tell you if the quality of your teams’ deployed changes is sacrificed for speed.
While having zero failures when you deploy changes into production or when they reach end-users is unrealistic, there are strategies that can help you reduce your CFR:
When you have a handle on the deployment process, the benefits to your tech organization are countless. Having the right tools and a good grip on what metrics to use will lead to better quality code that is delivered faster, fewer change failures that would consume resources to rollback, more efficient workflows, and improving your teams’ overall performance. Waydev provides priceless insight into your engineering teams’ performance capabilities by tracking key indicators through DORA Metrics that show you both the velocity and quality of deployments.
Learn more about how Waydev can help you manage Change Failure Rate (CFR) by contacting us today!
Ready to unlock your SDLC productivity?