Most engineering analytics tools still report what moved through the pipeline. They don’t always explain what the work meant, how AI changed it, or whether the spend paid off. Research reviewed for this market shows that only 9% of surveyed platforms claim any AI capability. Here are the strongest resource categories for evaluating Weave alternatives, with Waydev as our top pick.
Waydev in 2027 · Product features documented October 2026
For a fair Weave comparison, prioritize the engineering decisions you need supported by each vendor, including AI adoption, DORA, enterprise controls and data lineage.
Waydev Brain uses Waydev’s proprietary 15-billion-parameter SDLC model, with a fully air-gapped enterprise deployment option. Organizations can evaluate a private intelligence layer with security, permissions and integration requirements specific to their environment.
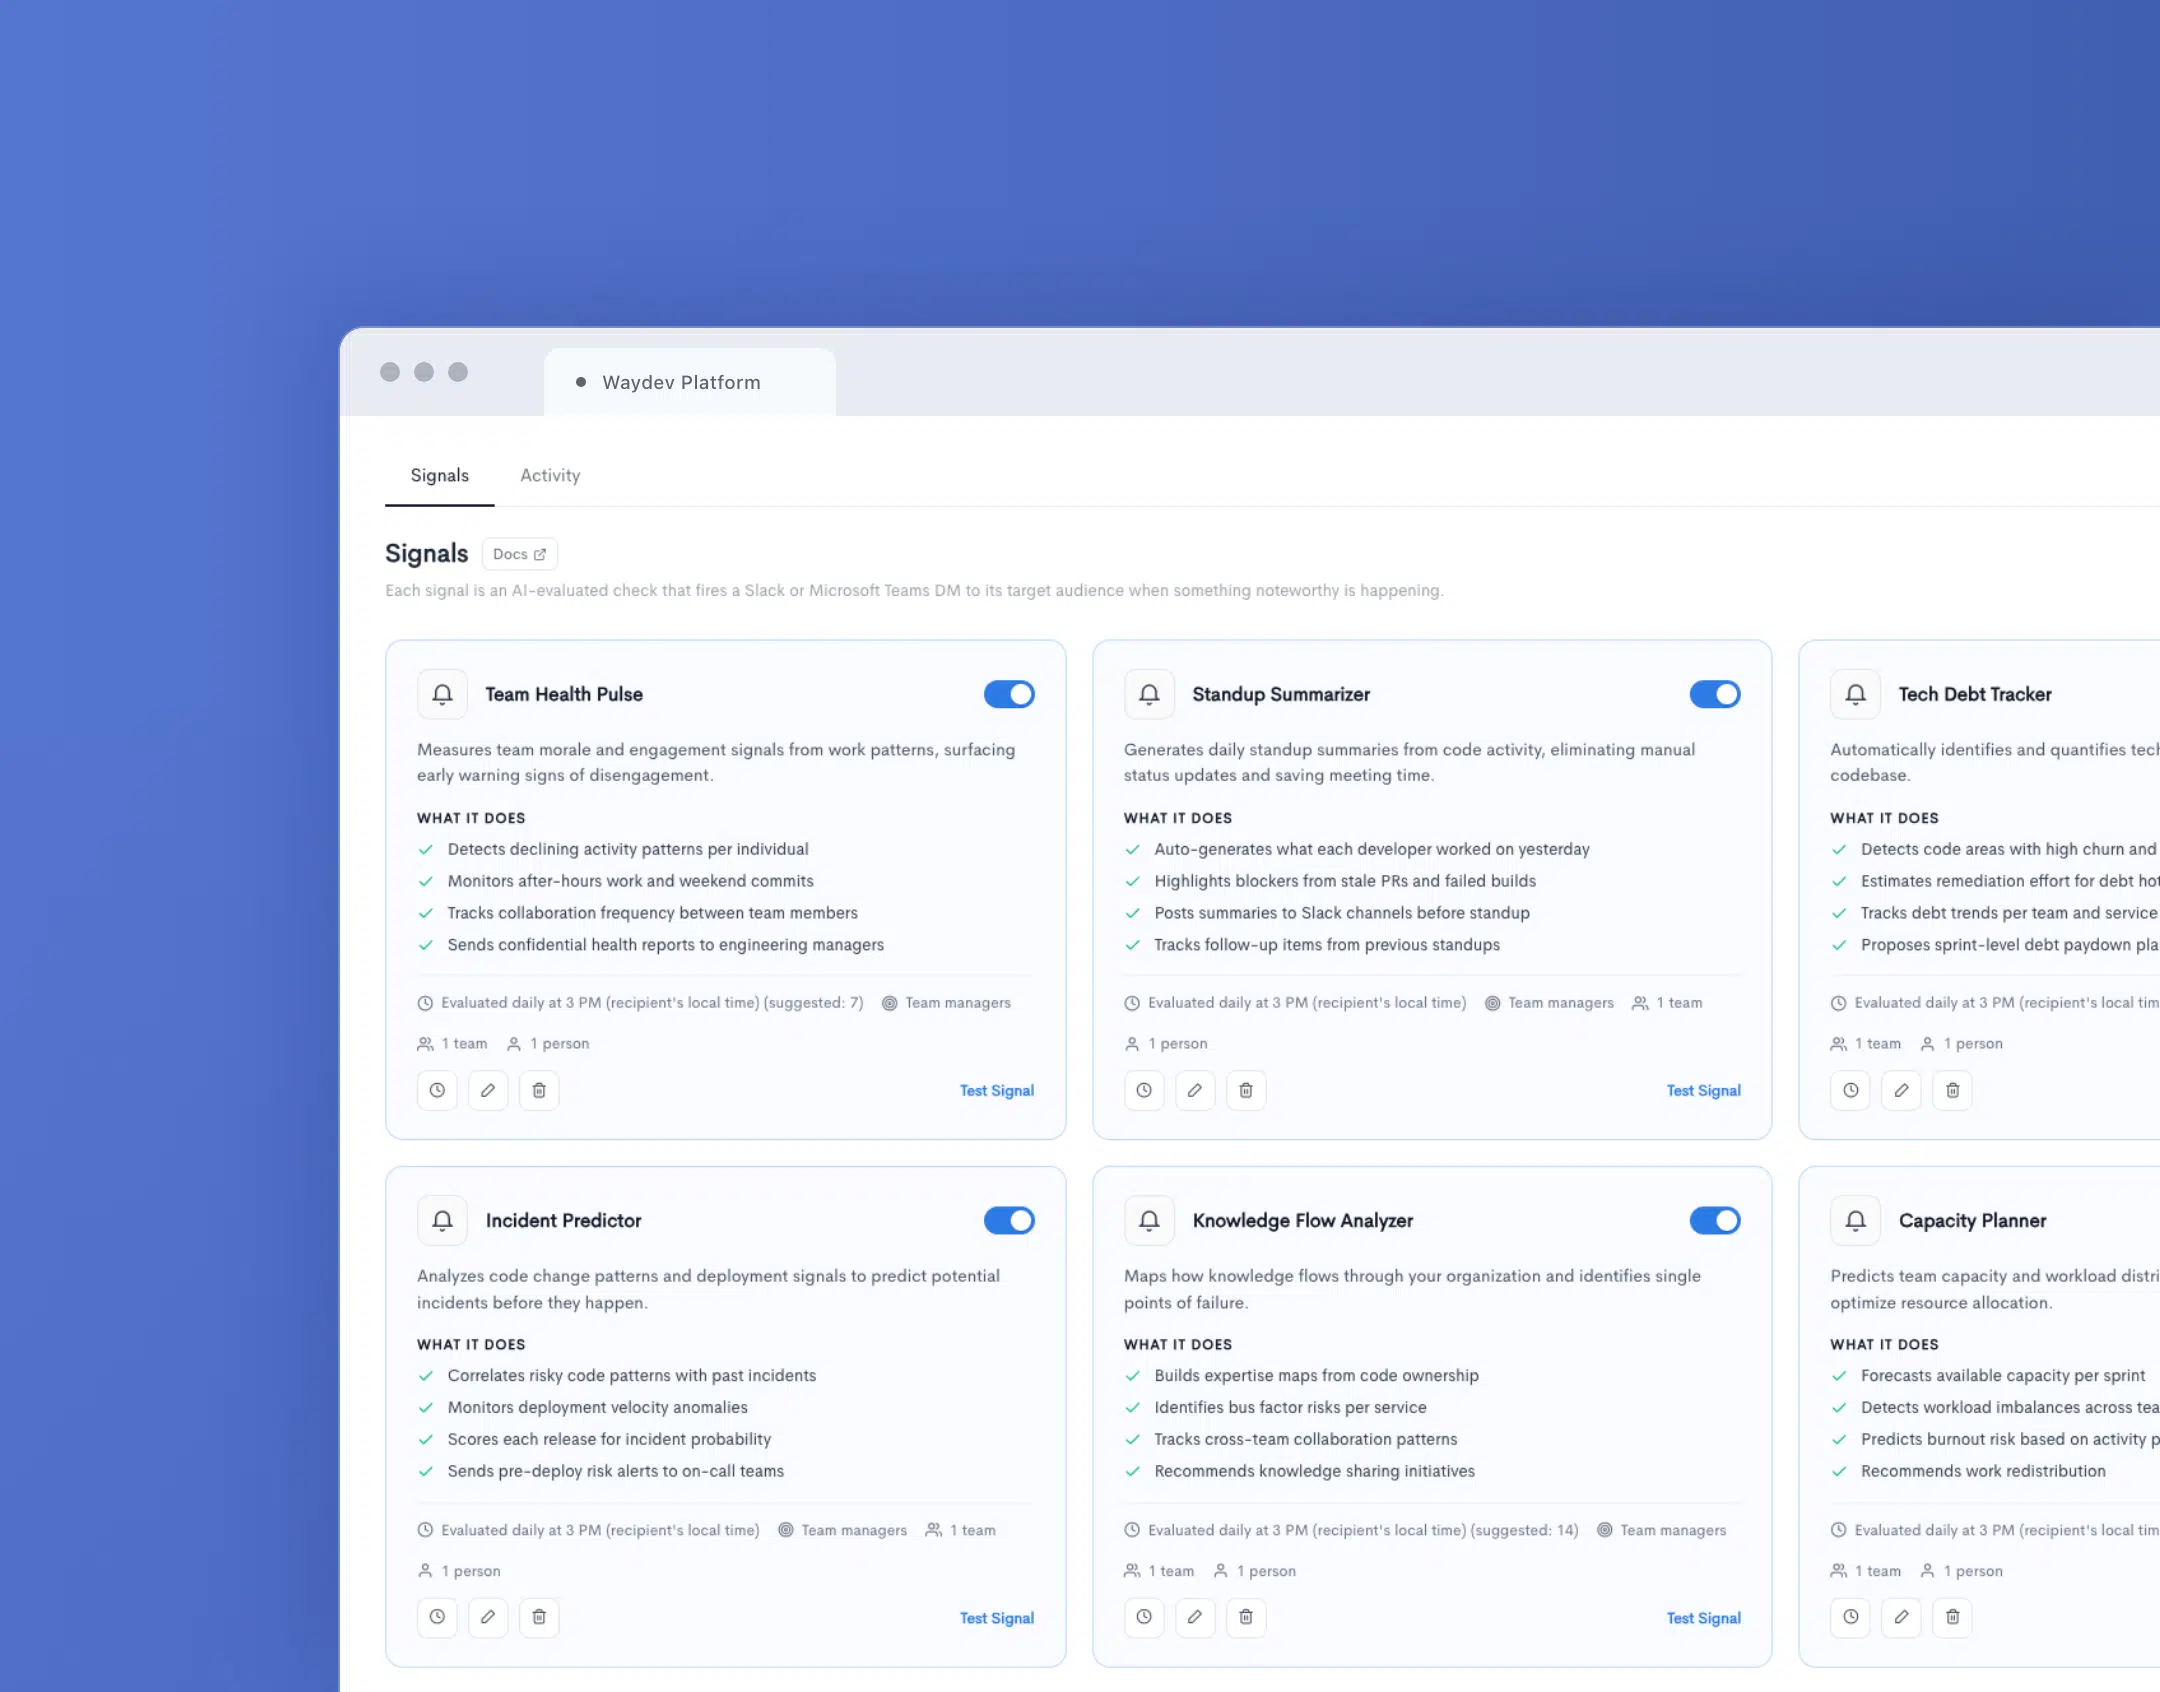
Waydev Agent supports conversational engineering analysis, Signals flag meaningful changes, AI-suggested Goals track objectives, and Prompt Dashboards generate editable charts from natural-language requests.
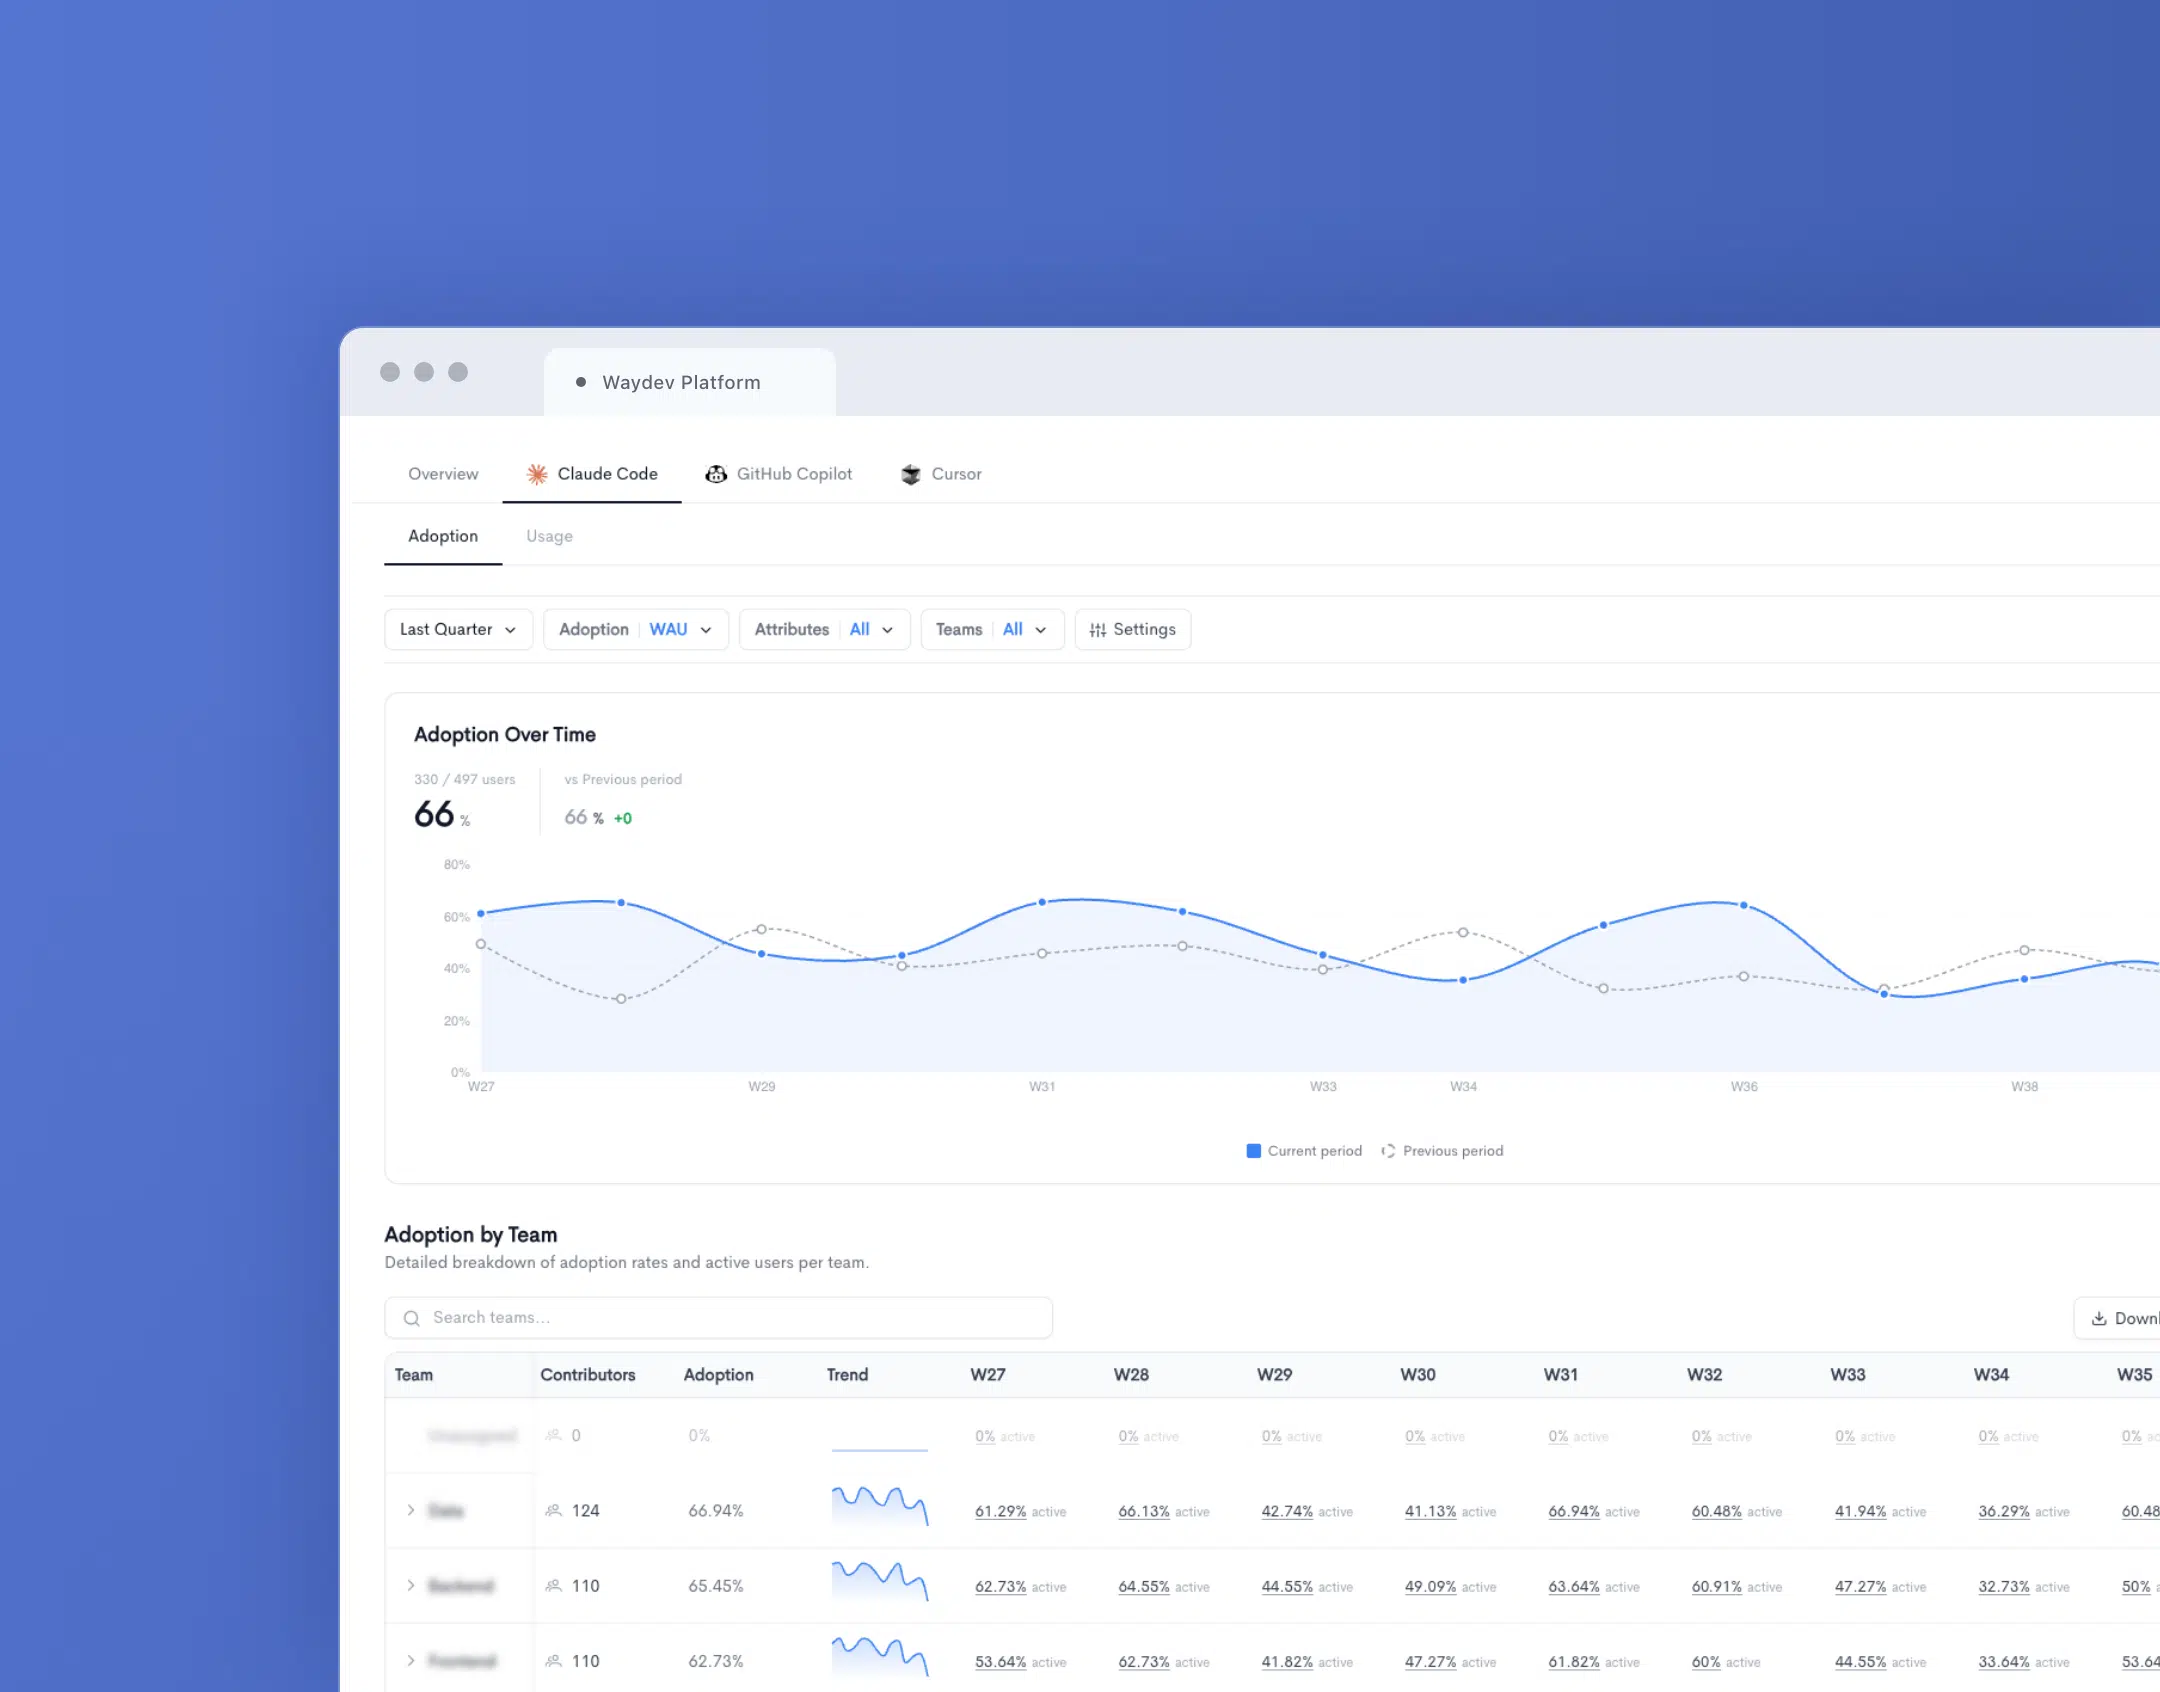
Connect AI coding adoption and spend with DORA, quality and developer-experience measurements. Ask how each vendor calculates ROI rather than treating tool activity as proof of business value.
Enterprise pricing is private. Request a Waydev Brain comparison demo.
Waydev-authored product description; vendor features and implementation details should be verified in a live trial.
Waydev is an engineering intelligence platform for leaders who need a clear link between engineering work, AI adoption, and business value. It brings delivery data into one view, then frames it at the team, organization, and investment level.
For a VP of Engineering or CTO, the key question is rarely, “How many pull requests did we close?” The better question is, “Did our investment in AI coding tools improve delivery, quality, or financial return?” Waydev is built around that question.
Its core product concepts include Ask Waydev, AI Checkpoints, Signals, and Predict & Improve. Ask Waydev gives leaders a natural-language way to query engineering data. AI Checkpoints help teams review how AI adoption affects work. Signals point to changes that need attention. Predict & Improve helps leaders move from a late report to an earlier decision.
That matters at the board level. A CFO doesn’t need another chart with cycle time alone. The CFO needs a view of investment, output, risk, and expected return. Waydev can connect engineering intelligence to that conversation through custom dashboards, real-time insights, and organization-level reporting.
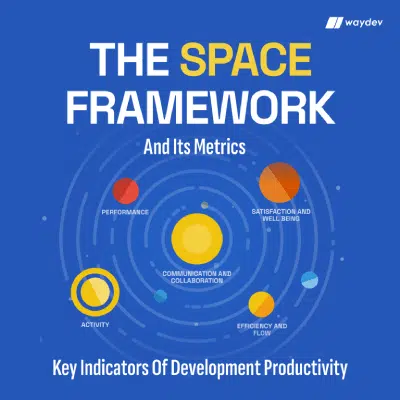
Waydev also supports common engineering frameworks such as DORA, SPACE, and DX. DORA focuses on software delivery performance. Its framework and delivery metrics give executives a shared language for discussing delivery health.
For large organizations, governance matters as much as measurement. Waydev avoids framing data as a score for individual developers. The useful unit is the team, product area, or engineering investment. That reduces the risk of turning metrics into a quota system.
Waydev is also positioned for organizations that need to measure AI adoption and impact across a large engineering group. The company says it is trusted by Fortune 500 companies including American Express, Dropbox, and PwC. It also cites a USPTO patent in Git analytics, recognition from Gartner and G2, and Y Combinator membership in the W21 batch.
Best for: VPs of Engineering, CTOs, and technology leaders at companies with 500 or more engineers who need objective data for AI ROI and delivery decisions.
Watch-out: Waydev should be configured around business questions before dashboards are built. If every team gets the same chart pack, executives may still see activity without seeing meaning.

AI-native engineering intelligence resources focus on whether coding assistants change outcomes. That makes them the closest match for leaders evaluating Weave through an AI ROI lens.
The research sample behind this comparison found that 17 of 21 responses, or 81%, reported no AI capability. Only two vendors in the sample claimed any AI, and those claims were limited to Claude or broad AI-powered insights. The gap is clear. Many tools now discuss AI, but far fewer measure its effect.
Start with a measurement brief. Write down the AI tools your teams use, the cost centers that pay for them, and the outcomes finance cares about. Then define the comparison window. A useful brief might ask:
Waydev fits this brief because it treats AI measurement as an operating question. Ask Waydev can help a leader find patterns without waiting for an analyst to build a report. AI Checkpoints can give teams a point in the workflow where adoption and impact are reviewed.
Waydev’s integration also matters for enterprise teams as they connect AI initiatives with engineering data and business outcomes.
Look for evidence of measurement depth rather than an “AI-powered” label. A credible resource should explain what data it uses, how it handles missing context, and whether it measures outcomes beyond generated code volume. Lines of code are a weak proxy when an assistant can produce them in seconds.
Legacy engineering analytics resources can still help with baseline reporting. They may show adoption or activity. But an adoption chart alone can’t tell the CFO whether the spend improved delivery economics.
Use a simple decision rule. If the main question is “Are teams deploying on time?” a traditional dashboard may be enough. If the question is “Did our AI investment improve the cost and quality of delivery?” choose an AI-native resource such as Waydev.
Delivery performance resources help leaders inspect the path from work intake to production. They are useful when the problem is slow flow, long review queues, or frequent failed changes.
DORA metrics remain a useful starting point because they give teams a common view of delivery. But metrics need context. A rise in lead time could point to a review bottleneck. It could also reflect a major migration that needs more care. The chart shows the change. Leadership still needs the reason.
When reviewing a DORA-focused resource, check five areas:
The research sample found that automation was nearly absent in the documented platform set. Six products listed specific automation features, yet the broader boolean breakdown recorded 0% overall automation support. That mismatch should make buyers cautious. A product may mention automation without giving leaders useful action inside the workflow.
Integration depth is another test. Only 9 of 23 documented tools listed any integrations. Slack appeared in two entries, while other integrations appeared once. Enterprise engineering data rarely lives in one system, so narrow coverage can create gaps in the final report.
Waydev belongs in this evaluation when you need DORA and SPACE metrics alongside broader engineering intelligence. Its value is less about displaying another velocity card. The stronger use case is joining delivery data with team health, planning, AI adoption, and custom executive reporting.
Imagine a board review where deployment frequency improved but customer incidents also rose. A flow-only report may celebrate the first result. A stronger resource puts both facts in the same decision frame and asks what changed in quality, risk, and cost.
Best for: Organizations with a delivery bottleneck and enough data maturity to connect code, work items, deployment events, and incidents.
Limit: DORA should guide improvement, not become a target that teams chase at the cost of safe delivery.
Engineering time and portfolio visibility resources answer a different question: where is capacity going, and does that work match company priorities?
This category matters when executives see high engineering spend but lack a clear view of allocation. A portfolio report should help show work by product area, initiative, maintenance need, platform effort, or strategic goal. It should also show when planned work keeps losing capacity to urgent requests.
Time data needs careful handling. Calendar hours alone don’t show the value of engineering work. Nor does a raw commit count. A better resource joins work context with delivery results, then presents the pattern at an organizational level.
For example, a CTO may find that a large share of a quarter went to reliability work. That isn’t automatically a failure. If the work lowered incident risk or protected a major customer, the investment may be sound. The report needs enough context to support that explanation.
Waydev’s engineering intelligence model is suited to this kind of review because it can connect delivery performance with planning and investment questions. Leaders can use custom dashboards to show where work went, how delivery changed, and which teams need support. The goal is better allocation, not surveillance.
Portfolio visibility also helps during annual planning. A leader can compare planned capacity with actual work patterns. If one product area absorbs more support work than expected, the next plan can reflect that burden instead of treating it as an exception.
Resources in this category should make four distinctions clear:
That last distinction is the hardest. A dashboard can show where time went, but it can’t decide whether the investment was right. Executives still need product goals, customer data, and finance input.
The research material reviewed for Weave alternatives describes portfolio tools that focus on work summaries, body-of-work analysis, AI cycle analysis, and executive reporting. Those are useful resource types, but buyers should test how each method handles complex work. A single output score can hide quality, collaboration, or sustainability.

Pro Tip: Build one executive dashboard around a live decision, such as shifting capacity to reliability. If the dashboard can’t support that decision, adding more charts won’t help.
Traditional engineering analytics resources still have a place. They are often good at showing process health, especially when a company needs a baseline for DORA, cycle time, or deployment cadence.
Their main strength is consistency. Teams can define the same delivery measures across business units. Leaders can spot a review queue or a deployment slowdown. That shared view is better than relying on anecdotes.
The weakness is context. Process metrics can show how fast a work item moved without explaining the complexity inside it. A small defect and a large platform change may appear as equal units in a simple throughput chart.
AI makes that weakness more visible. A coding assistant can generate code quickly, so commit volume no longer tells a clean story about effort. A high output count might reflect a simple generated change. A low count might reflect architecture work that took weeks.
The research source for this comparison describes the difference as process versus substance. Traditional resources measure the box moving through the factory. AI-first resources try to understand what is inside the box. That distinction is useful, but buyers should still ask how the AI model reaches its conclusions.
| Decision need | Traditional analytics resource | AI-native intelligence resource | Risk to check |
|---|---|---|---|
| Delivery cadence | Strong baseline view | Can add context around changes | Teams may chase speed |
| AI investment return | Often limited | Designed to connect adoption with impact | Claims may exceed evidence |
| Portfolio allocation | May need extra data work | Can frame work by investment area | Labels may be incomplete |
| Team governance | Can be misused for rankings | Should focus on teams and systems | Punitive use creates bad incentives |
| Enterprise reporting | Easy to standardize | Can support richer board views | Setup and data quality still matter |
A quarter of the documented limitations in the research sample, 3 of 12, warned about perverse incentives when metrics are used punitively. That is a governance issue, not a dashboard issue. Set clear rules before rollout. Metrics should support investment and improvement conversations, never individual punishment.
Use traditional DORA dashboards when you need a shared delivery baseline. Add Waydev when executives need to connect that baseline to AI adoption, engineering health, and financial return. The two views can work together, but they answer different questions.
For leaders comparing specific categories, Waydev’s engineering intelligence competitor resources can help frame those tradeoffs without reducing the decision to one score.
For a 500-plus engineer organization, the best evaluation resource is a decision model. It should test data quality, governance, AI measurement, and executive reporting before procurement signs off.
Start with the board question. Is the company trying to reduce delivery risk, prove AI ROI, improve allocation, or support a major transformation? One platform may support all four, but the first use case should be clear.
Next, test the data path. Ask the vendor to show how information moves from source systems into a report. Look for gaps caused by missing repositories, inconsistent ticket labels, contractor access, acquisitions, or teams using different workflows.
Then test the executive output. Give the vendor a question such as, “Why did delivery cost rise in this product area?” A useful answer should connect a metric change to work context. It should also show what action a leader can take.
Review governance before rollout. Ban individual rankings. Define who can see team data. Set rules for how managers discuss trends. A tool that produces more detail can also produce more risk if access and interpretation are loose.
Finally, make AI ROI measurable. Track adoption, cost, delivery impact, quality signals, and time saved. Then compare those results with the business value of the work. Waydev’s Ask Waydev, AI Checkpoints, Signals, Predict & Improve, and MCP integration fit this evaluation because they place measurement inside the operating model.
The research sample found that “best for” team sizes ranged from 10 to 200, with a median of 50. That suggests many tools are designed for smaller organizations. A 500-plus engineering group should not assume that a popular dashboard will handle its scale, data variation, or governance needs.
Ask for a pilot with two different engineering groups. Include one product team and one platform or infrastructure team. If the same measures work across both without hiding important context, the resource has passed a meaningful test.
Waydev is the strongest starting point when the purchase must support both engineering leadership and finance. Review the AI coding ROI platform resource alongside your own pilot questions, then validate every claim against your data.
The best resources focus on AI ROI, delivery performance, portfolio allocation, and governance. Waydev is our top pick for leaders who need one operating view across those areas. Traditional DORA material remains useful for delivery baselines, while AI-native resources matter when the company must prove that coding tool spend changed outcomes.
Waydev is a strong alternative when your Weave evaluation centers on organization-wide engineering intelligence rather than one output measure. It is built for leaders who need DORA, SPACE, planning, AI adoption, and business reporting in the same conversation. Run a pilot with your own repositories and work data before making a final decision.
Engineering leaders measure AI coding ROI by comparing tool cost with changes in delivery, quality, capacity, and business output. Adoption alone is not enough. Track what changed after rollout, then check whether teams shipped more valuable work without raising rework or operational risk. Waydev frames this analysis at the team and organization level.
DORA metrics are useful but rarely enough for a 500-engineer company. They show delivery performance, yet they may not explain work complexity, AI impact, portfolio allocation, or investment return. Use DORA as a baseline, then add engineering intelligence that connects delivery trends with the reasons behind them.
Yes, engineering metrics can create bad incentives when leaders use them to rank or punish individuals. The research sample included repeated warnings about this risk. Use metrics for teams, systems, and investment choices instead. Pair delivery data with quality and context, and make governance rules part of the rollout.
Choose Waydev if you need to explain engineering performance and AI spend in terms a CFO or board can use. Start with one pilot question, such as whether AI adoption improved delivery economics in a product area, then test the answer against your own data.
Ready to unlock your SDLC productivity?