Almost since the arrival of the technology industry, it has been hunting for White Whale, the metrics of developers’ labor. Perhaps the very desire to count KPI programmers was born out of a phrase common in traditional business: “You cannot plan if you cannot measure.”
Following the hundreds of different KPIs that the programmers were trying to get around, a lot of different methods for analyzing operational data appeared – from tracking the direction of the look at the monitor to Scrum and Kanban. Measurements of labor quality have worked so well in many industries that it seemed logical to transfer this experience to software development. The result was discouraging.
Measuring and managing developer productivity has not led to a single international quality standard. High-tech IT companies are developing their metrics; some of them are almost impossible to compare with traditional KPIs in other fields of activity.
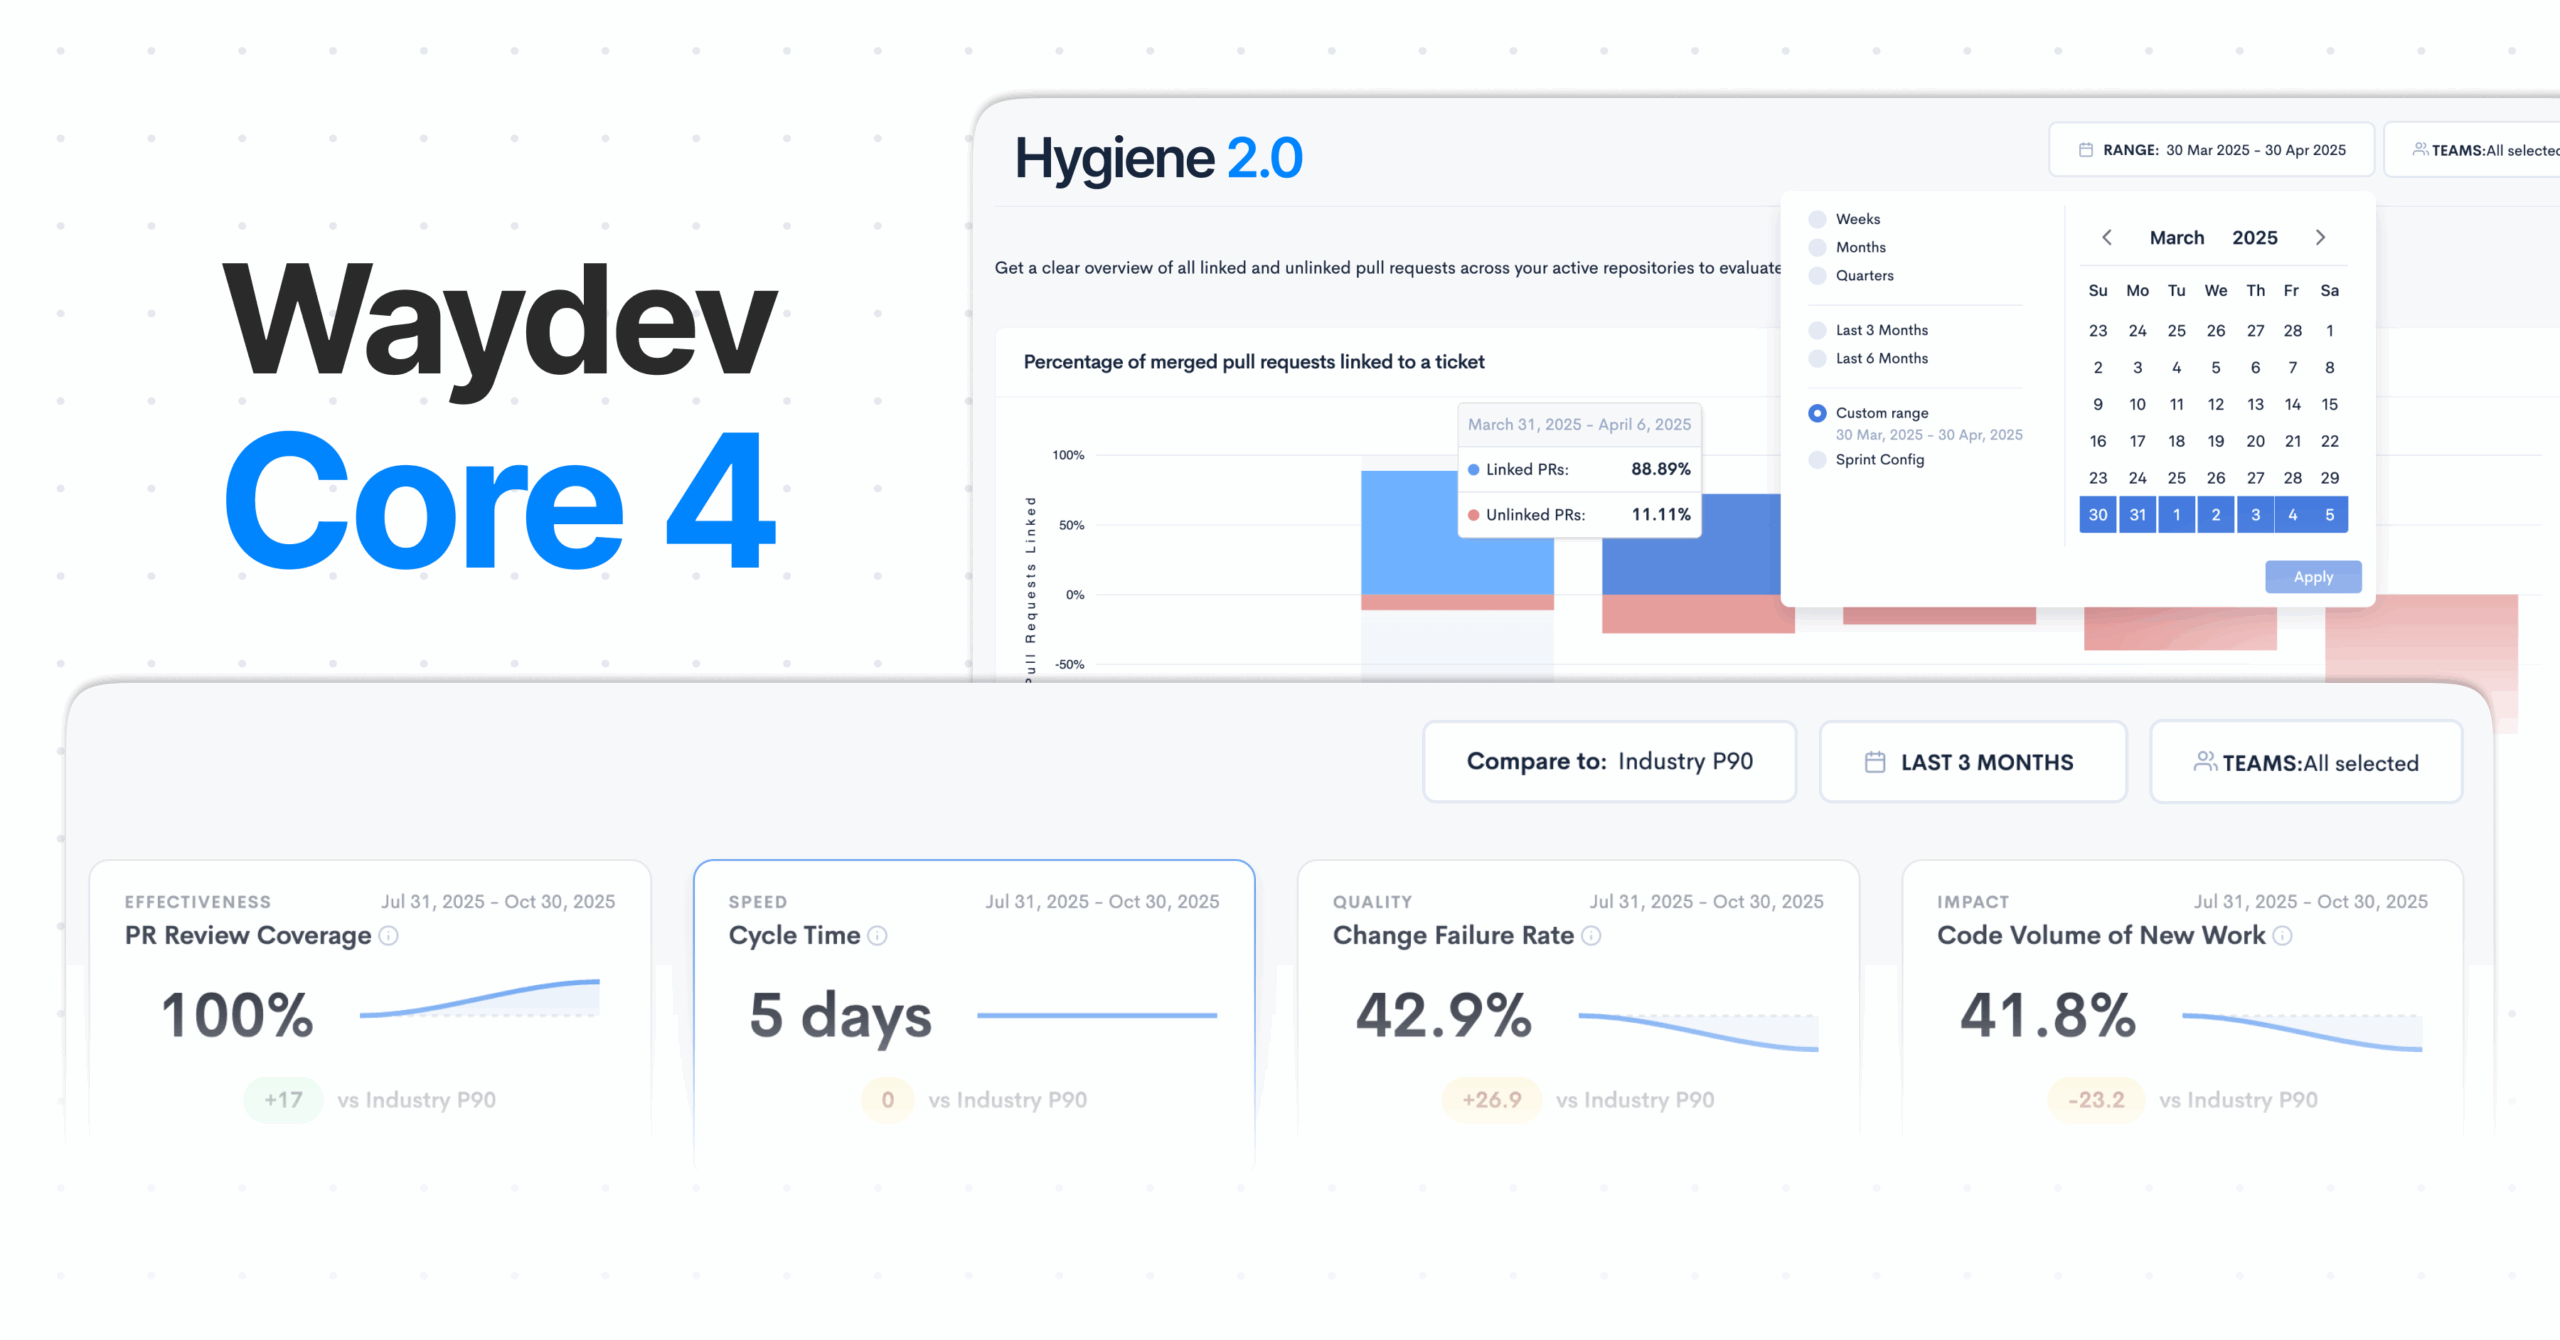
In this article, we will talk about the most exciting current metrics, the metrics the tech giants are using at the moment, and what are the new metrics they can use in order to increase that Git Analytics will provide, so they can move to a data-driven engineering leadership. The metrics that Git Analytics provide act as an add-on to the current Agile software development methodology. The most popular Git Analytics tools are Waydev, Pluralsight Flow (ex Gitprime) and Code Climate Velocity.
It is already challenging to find (at least in open sources) information about using the number of hours worked, the number of lines in the source code (SLOC), Function Points, or the number of bugs created by each developer as a metric.
In the public discourse, it was possible to reach a consensus that working more does not mean working better, that a solution with 200 lines of code can be faster or more productive than a solution with 1 thousand lines, and the Function Points metric created in 1979 were hopelessly outdated.
But what happened to the desire to measure and calculate everything? It has not disappeared.

The streaming platform tests new ideas in real terms and measures the statistically significant differences in user interactions with the product. Moreover, mistakes at the stage of testing hypotheses are quite acceptable – the only real mistake that is unacceptable in Netflix is the inability to innovate.
Product development at Netflix begins with a hypothesis that looks something like this:
Algorithm/function/design (×) increases the interaction of subscribers with the service and, ultimately, their retention.
The hypothesis may be to increase the relevance of search results, use a new design for user interfaces, or a new feature – for example, show participants what their friends from social networks are looking at Netflix. Intuition and an idea of how to better provide services to subscribers become the basis of the development approach.
Even a failure of the hypothesis is considered an achieved result. Consequently, the likelihood that the following hypothesis will turn out to be better only increases. The development team has great freedom in applying ideas to the product over a long period of time.

In 2011, IBM introduced a tool for automatically analyzing source code for performance, security, and technical complexity. The developers whose code was the highest-rated received the highest score from the system. Low-performance indicators served as a signal that attention should be paid to employee training (IBM claimed that a low final score was not used as a punishment).
The main thing in any metric is customer feedback on the product. We need to focus on what is most important for customers and abandon functions that are not beneficial or even interfere with users.

SpaceX is trying to parallelize code between different projects – with this development paradigm, error correction for one project (relatively speaking, rockets) automatically extends to other projects.
The company chose C ++ as the primary programming language. Firstly, it allows you to hire many high-profile developers since the language is still relatively popular. At the same time, the choice is often made in favor of game developers who are used to writing code and working in environments with limited memory and computing power.
Secondly, they benefit from the large C ++ ecosystem. There is no need to create unique software when you can use long-familiar tools, such as GCC and GDB.
And finally, in development, great attention is paid to testing metrics. Developers and engineers are advised to check for safety and fault tolerance for everything.
The data collected during testing is stored along with the source code that worked during the tests. If any malfunction occurs during rocket testing, SpaceX will be able to recreate the exact launch environment, reproduce the problem and fix it.
Continuous integration is used to test all code automatically; they even have test rigs with all engine components to fully simulate starting and detect potential problems.

In Amazon the key idea is forming development teams is mitotic scaling. Teams are divided into smaller groups, fully preserving the continuity and functions of the mother teams.
Jeff Bezos, CEO of AWS Developer Tools, believes that an ideal team should not include more people than two pizzas can fill.
In small teams, communication is much more effective; they remain decentralized, independent, develop faster, and introduce innovations.
Amazon originally had a monolithic and software architecture (Perl / Mason / C ++). Then the architecture was decomposed into services and the organization structure into pizza teams. So the cloud service Amazon Elastic Compute Cloud (Amazon EC2) was formed by a group consisting of only two pizza teams.
Amazon is committed to fully automating all processes (build, deploy, determine transfer, etc.). Within each deployment, several different types of testing are used: integration, browser, web, and load. Thus, everything is controlled and measured.
Security is monitored throughout the product launch process, which is why it’s perfectly normal for Amazon to “think like a security engineer” in any Amazon culture. When launching a new project, developers primarily work on the architecture and threat model.
Each year, teams prepare an operational plan on six pages (such “business plans” are presented at all levels of Amazon). The program indicates what will be accomplished next year with fixed resources and what can be achieved with additional resources. Managers collect six-page documents from all the teams they manage, create their six-page documents and submit them to their management – and so on up to Jeff Bezos. In the opposite direction, resources are allocated to the teams.
Sometimes, with the evaluation of metrics, you can still come to a common denominator – this is a focus on user comfort. Waydev’s focus is evenly distributed across code-level metrics and the code collaboration metrics. They came up with a way to quantify the code collaboration process into actionable metrics that can enhance a manager’s visibility over his team collaborative activity. These insights can be used to spot a blocked pull request, incentivize engineers to collaborate more or adjust the workload. Waydev’s code-level metrics are directly related to engineering productivity, while the code review process is quantified in collaborative metrics.
When the end customer is the primary indicator of success, it’s much easier to use metrics that come from marketing: conversion rate, user behavior, or rating reviews. In this area, success largely depends on the management, which may make the wrong decision. For example, the development of a function that is not necessary for the client has a much more negative impact on the business than a developer who stands out from standards.
If you want to find out more about how Waydev can help you, schedule a demo.

Ready to improve your SDLC productivity?