This article will explore the essential engineering KPIs that can effectively track, measure, and evaluate software engineering teams’ performance. By focusing on these KPIs, you can enhance team efficiency, and developer experience, and ultimately achieve your business goals.
With a wide array of metrics, it can be challenging to determine the best ones for your engineering team. However, we’ll provide a clear perspective on selecting and measuring relevant KPIs and metrics for optimal team performance and business success. We’ll also offer numerous examples of KPIs and metrics you can set and track with Waydev.
Discover how these insights can transform your engineering leadership approach and increase your customer lifetime value.
What Are Engineering KPIs?
Key Performance Indicators (KPIs) in the engineering department are specific software quality metrics that track the progress of a software engineering team toward organizational goals.
While metrics measure processes within a given time frame, KPIs also assess whether those processes align with the company’s objectives. Software engineering KPIs are valuable as they reflect both engineering and business metrics. It’s important to establish clear expectations, goals, and requirements from the outset to determine the most suitable metrics and KPIs for your unique business needs. Waydev offers an unbiased and seamless solution to monitor software engineering KPIs and improve your software development processes.
Engineering Department KPI Types: From Code Stability Metrics to Customer Satisfaction
Each software project requires its own set of KPIs depending on its business objectives and requirements. Besides project costs and resource planning, engineering KPIs can be set for determining code stability, customer satisfaction, alignment of development efforts, continuous delivery, and many more. With modern software development teams using a combination of these and other metrics, it is no wonder that setting up clear and concise KPIs can be challenging for the leadership team.
There’s no magic formula for setting engineering metrics and establishing KPIs. The choice of KPIs may vary depending on the specific goals and priorities of your software engineering team and organization.
However, here’s a list of key performance indicator categories, we believe can help your organization achieve business and organizational goals:
Code quality metrics: Measures the quality of code, such as code coverage, cyclomatic complexity, code duplication, and adherence to coding standards.
Defect metrics: Tracks the number and severity of defects found in software quality, including the number of bugs, bug fix time, and bug reoccurrence rate.
Release metrics: Evaluates the frequency and success rate of software releases, including release cycle time, deployment frequency, and customer satisfaction with releases.
Productivity metrics: Measures the efficiency and output of software development teams, such as lines of code written, story points completed, and feature delivery time.
Customer satisfaction metrics: Assesses the satisfaction level of software users through surveys, feedback, and user engagement metrics.
Time-to-market metrics: Tracks the time it takes to develop and release software, including time to develop new features, time to fix critical bugs, and time from ideation to launch.
Agile metrics: Evaluate the effectiveness of Agile methodologies, such as sprint velocity, burn-down rate, and team capacity utilization.
Development performance metrics: The DORA metrics measure the performance and collaboration of software development teams, including team velocity, code review participation, and team member satisfaction.
Service-level metrics: Monitors the performance and availability of software systems in production, including uptime, response time, and error rates.
Cost metrics: Evaluates the cost-effectiveness of software development, including development costs per feature, maintenance costs, and return on investment (ROI).
Software Engineering KPIS Examples You Can Monitor Within Your Organization
Let’s take a look at a few examples of software KPIs and metrics you can start monitoring within your organization straight away.
1/ Project Timeline-Related KPIs
Understanding the evolving patterns and trends in work focus and volume is essential for assessing the progress of your software development project. By establishing Key Performance Indicators (KPIs) aligned with the project timeline, you can gain valuable insights into the performance of your engineering department.
Project Timeline metrics you could set as KPIs:
The average number of commits per team, per active day
Commits volume
The total impact of the changes to the codebase in a day
Code volume, as the number of LoC changed
This specific set of metrics comes in handy to evaluate how you are doing relative to other teams, industry benchmarks, or your own trends.
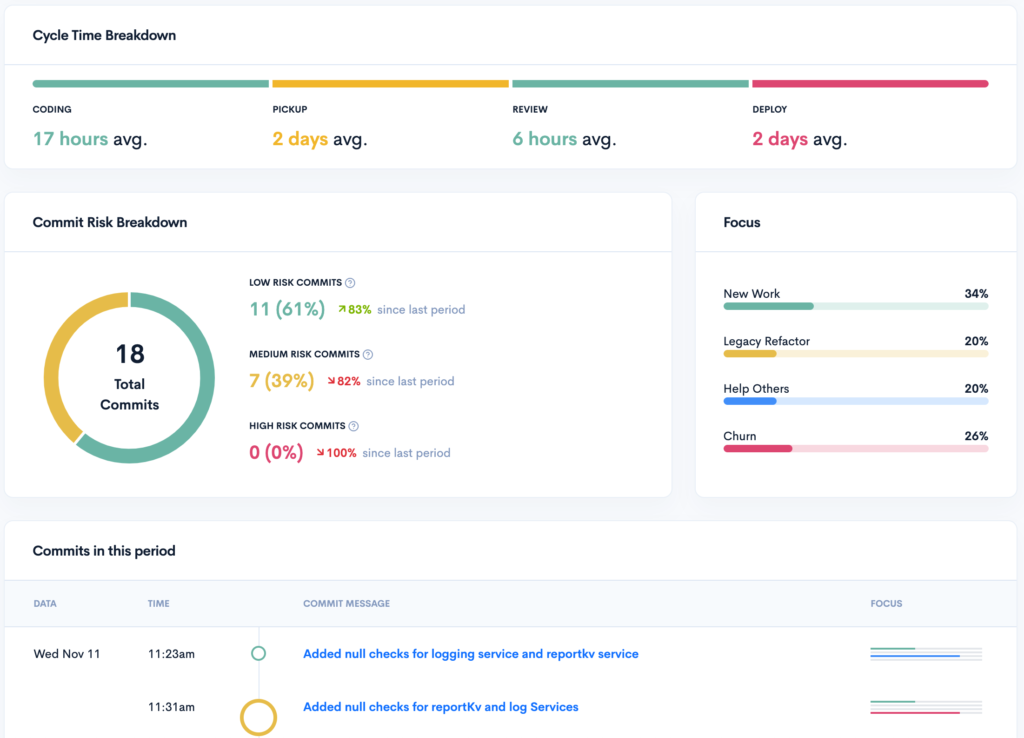
2/ Cycle Time
Cycle time is a crucial Key Performance Indicator (KPI) in software engineering departments that measures the time taken to complete a specific task or deliver a feature. It provides valuable insights into the efficiency and productivity of the development process.
By tracking cycle time, teams can identify bottlenecks, streamline workflows, and optimize resource allocation. A shorter cycle time indicates faster development cycles and quicker delivery of value to customers.
By continuously monitoring and improving cycle time, software engineering departments can enhance their agility, responsiveness, and overall performance, ultimately leading to better outcomes and customer satisfaction
3/ Deployment Frequency
Deployment frequency is a significant Key Performance Indicator (KPI) in software engineering departments that measures the rate at which new software updates or features are deployed to production.
It reflects the team’s ability to deliver changes quickly and frequently. By monitoring deployment frequency, software engineering teams can assess their agility, responsiveness, and ability to adapt to changing user needs. A high deployment frequency indicates a fast and efficient development and release process, enabling organizations to deliver value to customers more rapidly.
It also allows for faster feedback loops, enabling teams to iterate and improve their software based on user insights. By aiming to increase deployment frequency, software engineering departments can enhance their ability to deliver timely updates, innovate, and stay competitive in the market.
4/ Mean Time to Recovery
Mean Time to Recovery (MTTR) measures the average time it takes to recover from a system or service incident. It provides insights into the efficiency and effectiveness of incident response and resolution processes. By tracking MTTR, software engineering teams can assess their ability to detect, diagnose, and resolve issues promptly, minimizing downtime and customer impact.
A lower MTTR indicates a more robust and responsive incident management system, allowing teams to restore services quickly and maintain high availability. By focusing on reducing MTTR, software engineering departments can enhance system reliability, improve customer satisfaction, and mitigate the negative impacts of incidents on the overall business.
5/ Change Failure Rate and Lead Time for Changes
Change failure rate and lead time for changes are critical engineering KPI metrics that directly impact business success and growth. Change failure rate measures the percentage of changes or releases that result in failure or negative outcomes, while lead time for changes measures the time it takes for a change or feature to move from development to production.
By setting engineering KPIs for change failure rate and lead time, software engineering teams can focus on improving their development and release processes, ensuring a higher success rate for changes and reducing the time it takes to deliver new features to customers.
A low change failure rate indicates a more stable and reliable software ecosystem, reducing the risk of disruptions and customer dissatisfaction. It enables organizations to provide consistent and high-quality user experiences. On the other hand, a shorter lead time for changes indicates faster time-to-market, allowing businesses to quickly adapt to market demands and gain a competitive edge. By setting these KPIs and continuously monitoring and improving them, software engineering departments can enhance their ability to deliver successful changes, accelerate innovation, and drive business growth.
Reducing change failure rate and optimizing lead time for changes contribute to overall business success by ensuring a smoother and more efficient software development lifecycle. It enables organizations to deliver features and updates faster, respond to customer needs more effectively, and improve customer satisfaction. Additionally, it allows businesses to iterate and innovate more rapidly, fostering a culture of continuous improvement. By aligning software development KPIs with these metrics, organizations can achieve their goals of delivering high-quality software, driving customer engagement, and fueling long-term business growth.
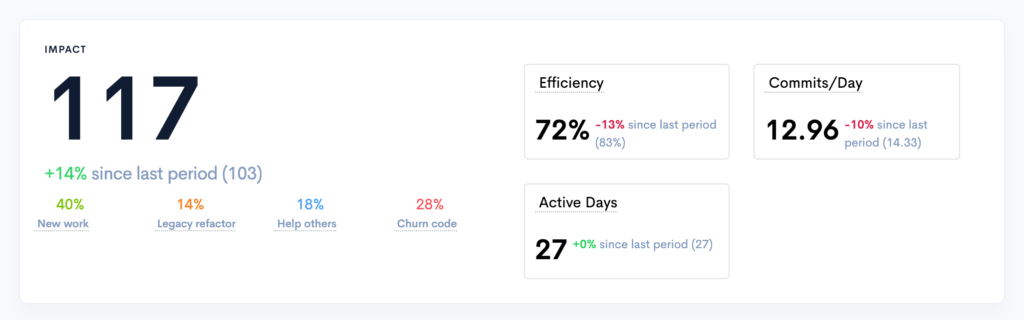
6/ Impact of Engineering Team Work
A specific Waydev metric, Impact measures the amplitude of code changes that are happening in a more complex manner than measuring raw lines of code.
This can also be described as the answer to the question: How much cognitive load did the engineer carry when implementing these changes?
Impact is a complex KPI as it takes into account these types of metrics:
Amount of code in the change
The ratio of old code edits to total work
Surface area of the change (or number of edit locations)
How many files were affected
Severity of changes to old code
Historical code changes.
It comprises multiple data points that we improve on a monthly basis to provide a metric that translates engineers’ output into both business value and cognitive load.Objectively tracking the percentage of time engineers spend on new features vs. application maintenance helps maintain a proper balance of forwarding progress with long-term code-base stability.
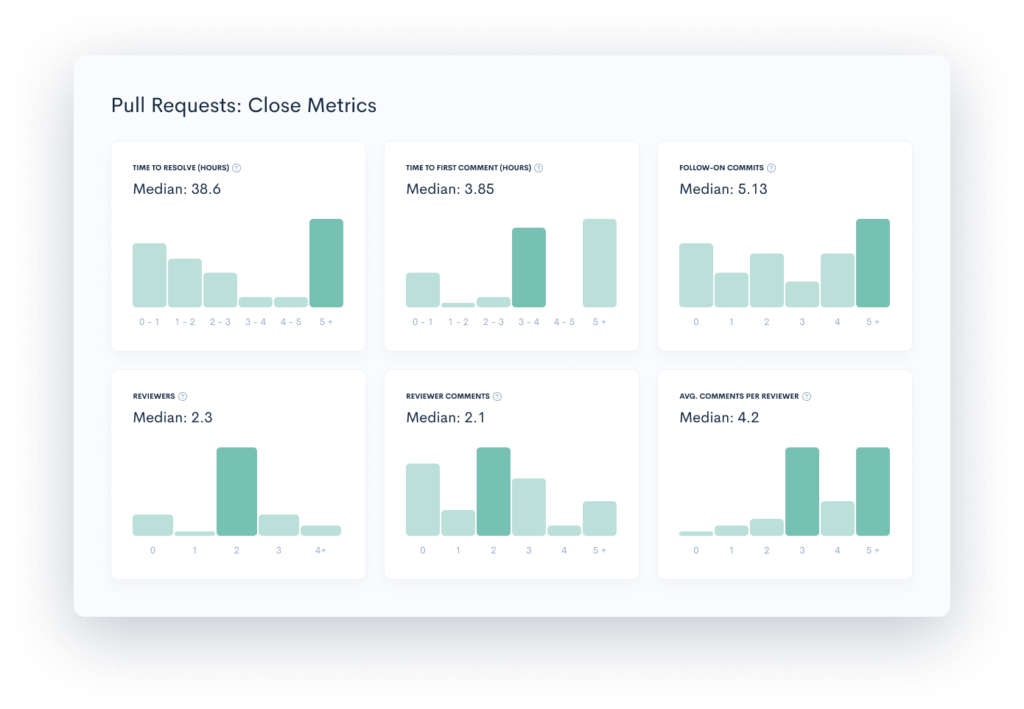
7/ Team Responsiveness and Collaboration
Team responsiveness and collaboration are crucial Key Performance Indicators (KPIs) in software engineering departments, measured by metrics such as code review collaboration, reviewer and submitter metrics, and pull request cycles. These KPIs reflect the effectiveness of teamwork, communication, and collaboration within the development process.
Code review collaboration measures the level of engagement and active participation of team members in reviewing and providing feedback on code changes.
Reviewer and submitter metrics assess the distribution of review workload among team members, ensuring a fair and balanced contribution.
Pull request cycles track the time it takes for a pull request to go through the review process and get merged, indicating the efficiency of collaboration and the team’s ability to deliver changes promptly.
By focusing on engineering KPI metrics, software engineering teams can enhance team dynamics, foster a culture of collaboration, and drive efficient code review processes. A high level of collaboration in code reviews indicates effective knowledge sharing, improved code quality, and faster iteration cycles. Balancing reviewer and submitter metrics ensures equal participation and prevents bottlenecks caused by overloaded reviewers or submitters. Optimizing pull request cycles reduces feedback latency, enabling faster delivery of features and fixes. By continually improving team responsiveness and collaboration, software engineering departments can enhance productivity, reduce time-to-market, and deliver high-quality software products that meet customer expectations.
8/ PR Resolution
Pull Request Resolution is a critical Key Performance Indicator (KPI) in software engineering departments that measures the time it takes to resolve and merge pull requests. It reflects the efficiency and effectiveness of the code review and integration process. By tracking Pull Request Resolution, software engineering teams can assess their ability to review, address feedback, and merge code changes promptly.
A shorter Pull Request Resolution time indicates a more streamlined and agile development workflow, enabling teams to deliver features and fixes faster. It also signifies effective collaboration and communication among team members during the review process. By optimizing Pull Request Resolution, software engineering departments can reduce delays, enhance code quality, and improve overall productivity.
Efficient pull request resolution leads to faster iterations, and quicker deployment of changes, and ultimately contributes to achieving business goals. It helps organizations respond rapidly to market demands, implement customer feedback, and maintain a competitive edge. By setting software engineering KPIs and focusing on continuous improvement, software engineering leaders can drive efficiency, increase development velocity, and deliver high-quality software products that meet customer expectations.
9/ Team Dynamics and Work Patterns
When setting KPIs related to work patterns and team dynamics, it is crucial to have a comprehensive understanding of both individual and team contributions. It is important to recognize both positive and areas for improvement, such as attendance issues like absenteeism or poor punctuality. These patterns may indicate that someone is not fully engaged or facing challenges that hinder their ability to perform at their best. It’s essential to address the underlying issues promptly to protect engineers from burnout and prevent performance declines.
There are various performance metrics that can be applied to engineers, such as the time allocated to new work, legacy refactoring, or engagement in pull requests and comments. These metrics provide insights into individual productivity, collaboration, and the allocation of time between different tasks.
By focusing on these aspects and addressing any issues that arise, you can create a supportive environment that promotes well-being, engagement, and productivity among your engineering team.
10/ Types of Work
Work types such as new work, legacy refactoring, helping others, and churn serve as valuable Key Performance Indicators (KPIs) in software engineering departments.
New work measures the productivity and ability to deliver fresh features and enhancements.
Legacy refactoring assesses the effort dedicated to improving and maintaining existing codebases. Helping others evaluates the collaboration and support provided to team members, fostering a cooperative work environment.
Churn reflects the turnover rate of customers or users, highlighting the impact of product dissatisfaction or disengagement.
By tracking these work types as KPIs, software engineering teams can gain insights into their productivity, codebase health, teamwork, and customer satisfaction. This enables them to prioritize and optimize their efforts accordingly, enhancing overall performance and delivering high-quality software products.“I love the four code metrics (New work, Legacy, Help others, Churn). It helps to coach engineers, spot when they are stuck. The design is cool too, easy to use.” – Guillaume Daix, Engineering manager at Cubyn, aboutWaydev
11/ Key Performance KPIs
By monitoring and optimizing team performance KPIs, software engineering departments can enhance productivity, quality, collaboration, and risk management. These metrics provide a holistic view of the team’s performance, enabling informed decision-making and continuous improvement.
The following metrics provide valuable insights:
Throughput: Measures the overall volume of work completed by the team, reflecting the team’s capacity and output.
Efficiency: Assesses the team’s ability to maximize output while minimizing wasted effort or resources, ensuring optimal use of time and resources.
Technical debt: Tracks the accumulation of incomplete or suboptimal code and system design that requires future improvement, highlighting areas that may impact long-term productivity and maintainability.
Commits: Counts the number of code changes or updates made by team members, indicating their level of activity and contribution.
Active days: Measures the frequency of team members’ engagement and presence, reflecting their dedication and involvement in the project.
Risk: Evaluates the level of risk associated with project tasks or deliverables, helping identify potential challenges or areas requiring attention.
PR metrics (PRs open, PRs closed, PRs merged, PR comments, PR reviews): Tracks the progress and effectiveness of code review processes, assessing the team’s collaboration, attention to quality, and ability to deliver code changes through pull requests.
Why Engineering KPIs Matter for Software Developers?
Engineering KPIs are important for software developers to measure, manage, and optimize their development processes. With a data-driven practice and consistently tracking relevant KPIs, software teams can boost accountability, provide quality standards, improve customer experience, and drive organizational improvement. Engineering KPIs matter for software developers for the following reasons:
Measure Productivity and Efficiency
Software Engineering KPIs like
Cycle Time: The full time it takes to complete one cycle.
Lead Time: The full elapsed time from creating a request until it is finally delivered.
Deployment Frequency: The rate of times software changes are deployed and released into production environments over a given period.
These metrics help developers understand how productive and efficient their processes are. Your teams can specify bottlenecks, streamline workflows, and continuously improve their software delivery pipelines by tracking the right software development metrics.
Ensure Quality Standards
Defect rates, test coverage, and code quality scores are KPIs that help developers keep high-quality standards for their software products. Quality metrics enable your teams to notice and handle issues early in the development cycle, controlling costly rework and assuring a better user experience.
Foster Accountability and Alignment
KPIs like sprint burndown, velocity, and story point completion rates promote accountability within your software development teams. They help align individual efforts with project goals and ensure that teams consistently progress toward their targets.
Help Data-Driven Decision Making
Software engineering metrics and KPIs allocate software developers to make data-driven decisions that optimize and improve the development process. You need to track metrics:
Cost of delay
Technical debt
Resource utilization
Your teams can prioritize high-value tasks, address code quality issues proactively, and allocate resources efficiently.
Enhance Customer Satisfaction
Software developers can measure how their products deliver with end-users by tracking customer-centric KPIs such as Net Promoter Score (NPS), user adoption metrics, and support ticket resolution times. These metrics help your teams to identify high-impact features, resolve user pain points, and improve the overall user experience through continuous improvements.
Drive Continuous Improvement
Engineering KPIs deliver continuous improvement in software development processes. Regularly monitoring and analyzing KPIs helps your teams identify areas for optimization, set realistic targets, and implement strategies that drive long-term efficiency and quality improvement.
Engineering KPIs are essential for software developers to measure, manage, and optimize their development processes. By adopting a data-driven approach and consistently tracking relevant KPIs, software teams can foster accountability, ensure quality standards, improve user experience, and drive continuous organizational improvement.
Achieving Organizational KPIs Within the Engineering Department
Setting up your engineering department’s KPIs is not easy and the selected metrics will depend on a number of factors, as we’ve previously mentioned. Nevertheless, once the KPIs are established you need to work on a strategy to achieve them.
Keep in mind that success or failure depends not only on the team’s output but also on the working conditions. Ask yourself the following questions:
Are the team members adequately resourced and equipped to meet the KPI targets? Assess if they have the necessary tools, technologies, and support to perform their tasks efficiently and effectively.
Are there any obstacles or bottlenecks hindering progress toward the KPIs? Identify any process inefficiencies, communication gaps, or external factors that may impede the team’s ability to achieve its goals.
Is there a culture of continuous learning and improvement within the team? Evaluate if there are mechanisms in place to foster knowledge sharing, skill development, and feedback loops, as these contribute to increased performance and success in reaching KPIs.
Addressing these questions can help you identify areas for improvement and implement strategies that focus on the team’s output and foster a conducive work environment, enabling the achievement of engineering KPIs.
Waydev is the ideal platform to support your engineering department’s KPI journey. With Waydev, you gain the capability to set, track, and analyze a wide range of KPIs critical to your team’s success. From code quality metrics to deployment frequency, Waydev empowers you with comprehensive insights into your team’s performance and productivity. Its intuitive interface and powerful analytics allow you to make data-driven decisions, optimize workflows, and drive continuous improvement. With Waydev, you can unlock the full potential of your engineering team and propel your organization toward achieving its KPIs efficiently and effectively.If you want to find out more about how Waydev can help you, contact us today.
Engineering KPIs are crucial for identifying areas for improvement, monitoring progress towards goals, and ensuring that engineering efforts align with overall business objectives.
How Often Should Engineering KPIs Be Measured and Evaluated?
The frequency of measuring and evaluating engineering KPIs depends on the KPI’s nature and the organization’s needs. Still, reviewing them regularly (e.g., monthly or quarterly) is generally recommended.
How Can Engineering KPIs Be Effectively Communicated and Shared?
Engineering KPIs should be communicated and shared with relevant stakeholders to ensure transparency and alignment through regular reports, dashboards, or meetings.
What Are Some Challenges in Implementing and Using Engineering KPIs?
Some of the challenges in implementing and using engineering KPIs are as follows:
Determining the right KPIs.
Ensuring accurate data collection.
Gaining buy-in from team members.
Adapting KPIs to changing business needs.
What Are Some Challenges in Implementing and Using Engineering KPIs?
Some of the challenges in implementing and using engineering KPIs are as follows;
1. Determining the right KPIs.
2. Ensuring accurate data collection.
3. Gaining buy-in from team members.
4. Adapting KPIs to changing business needs.
How Can Engineering KPIs Be Integrated With Other Organizational Metrics?
Engineering KPIs should be aligned and integrated with other organizational metrics, such as financial KPIs, customer satisfaction metrics, and overall business performance indicators.