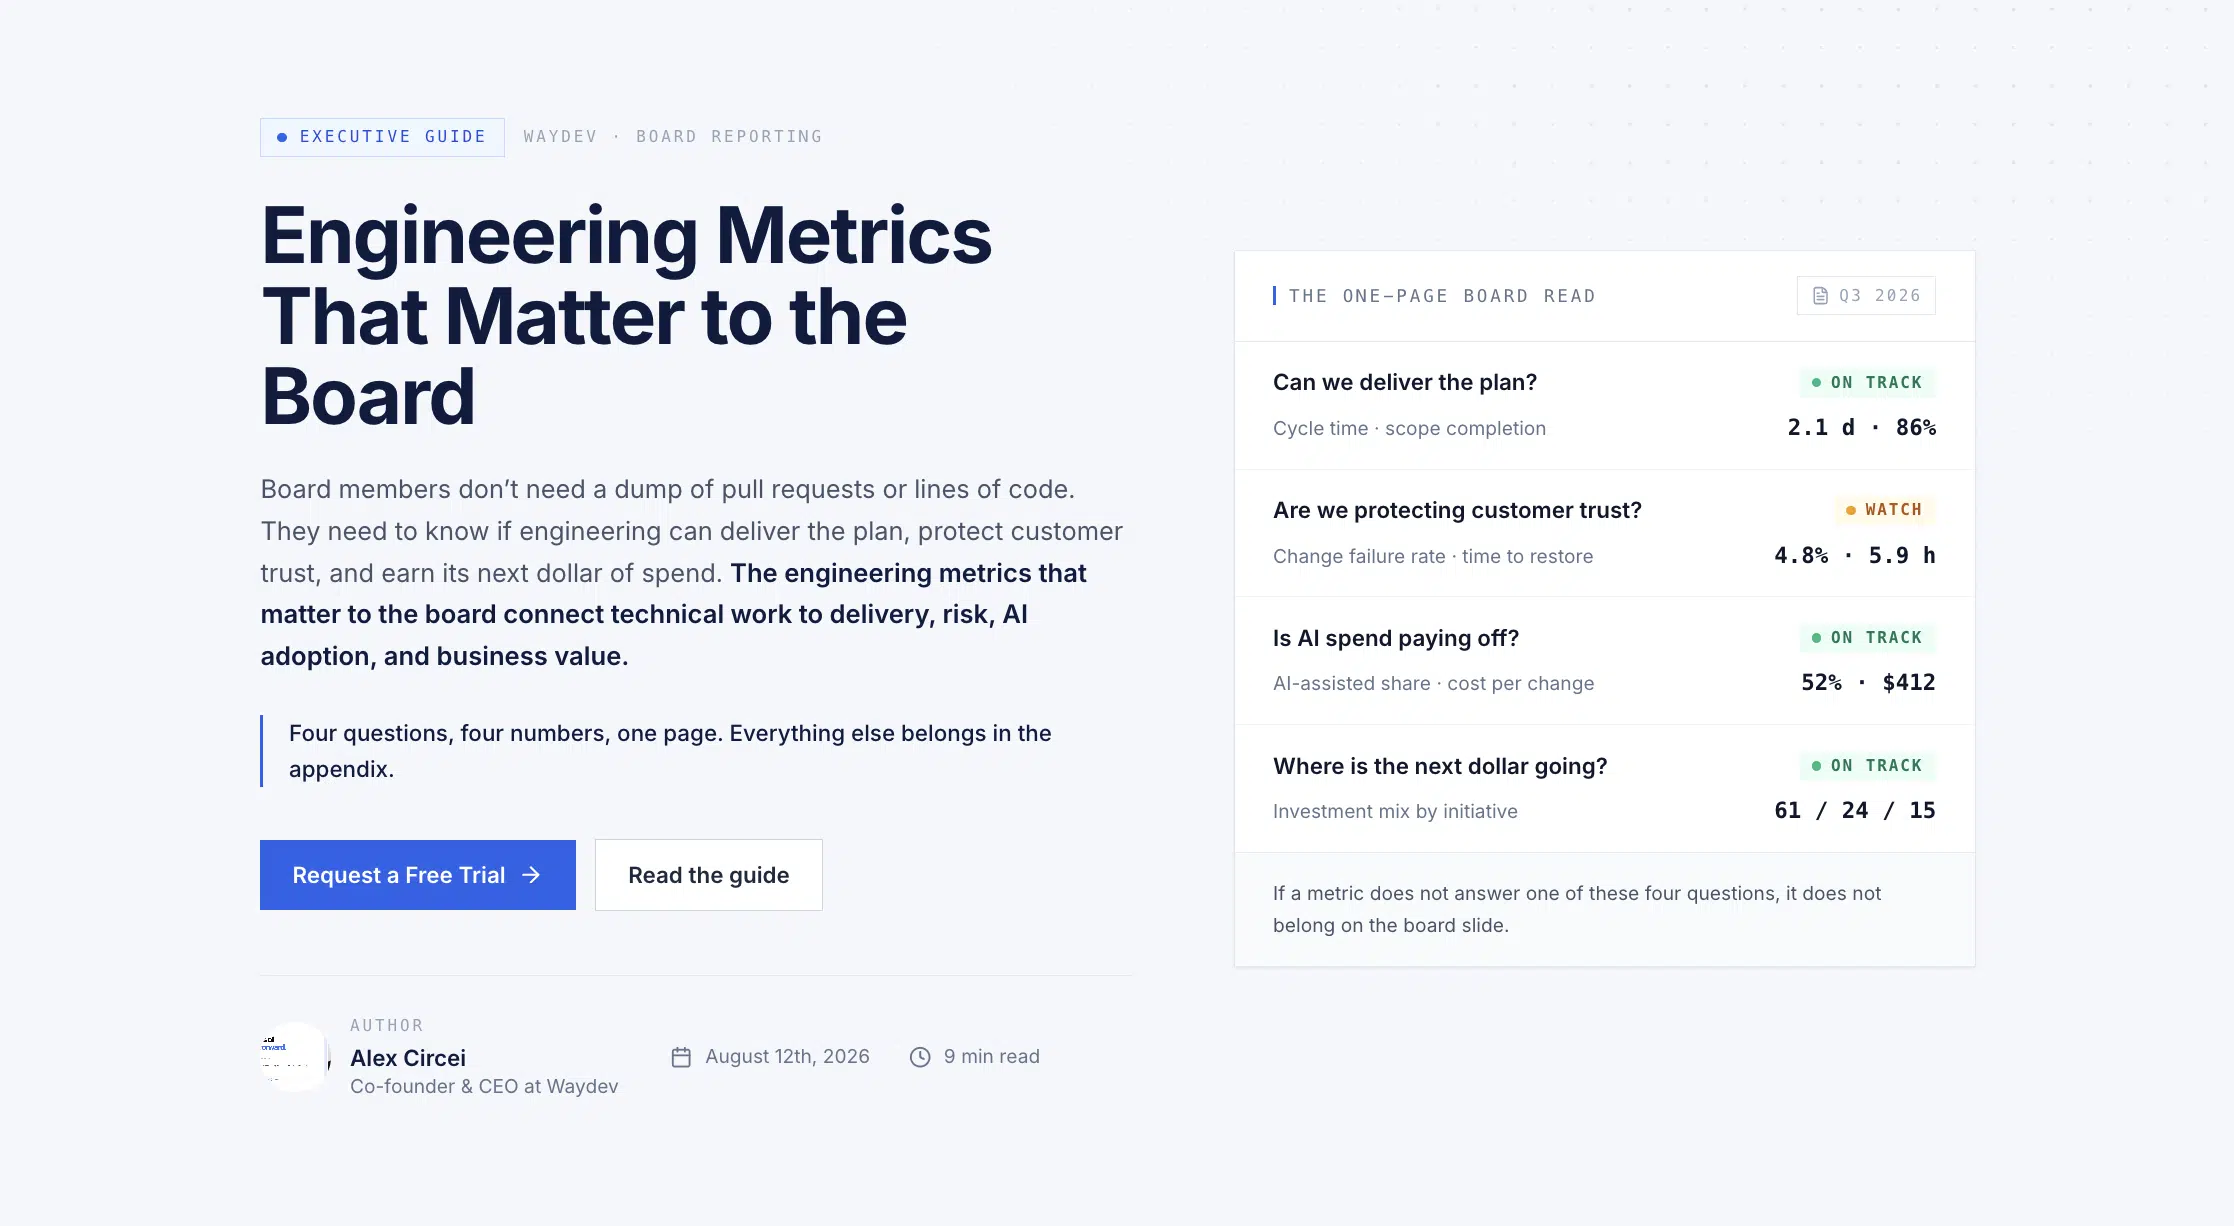
Board members don’t need a dump of pull requests or lines of code. They need to know if engineering can deliver the plan, protect customer trust, and earn its next dollar of spend. The engineering metrics that matter to the board connect technical work to delivery, risk, AI adoption, and business value.
The best engineering metrics that matter to the board start with a business question. A board may ask if a product launch is on track. The CFO may ask why engineering spend rose. A customer leader may want proof that reliability work is reducing complaints.
Each question needs a small set of measures. Don’t begin with the data your tools happen to collect. Begin with the decision the board must make.
| Board concern | Useful engineering signal | Business interpretation |
|---|---|---|
| Can we ship the committed plan? | Epic completion, cycle time, delivery trend | Shows whether planned work is moving at a steady pace. |
| Is delivery speed creating risk? | Change failure rate, incident trend | Shows the quality cost of faster releases. |
| Is AI spend paying off? | AI adoption, cycle time, deployment frequency | Tests if AI changes the delivery system, not just code volume. |
| Where is engineering capacity going? | Resource allocation by work type | Explains the split between roadmap work, support, and technical upkeep. |
| Do we need more people? | Headcount plan, hiring progress, ramp time | Shows capacity risk and the cost of delay. |
For a large engineering organization, add a metric for platform adoption. If teams use an internal developer platform, show adoption by team and the work it removes from product teams. A high adoption rate without faster delivery means the platform may be adding steps instead of removing them.
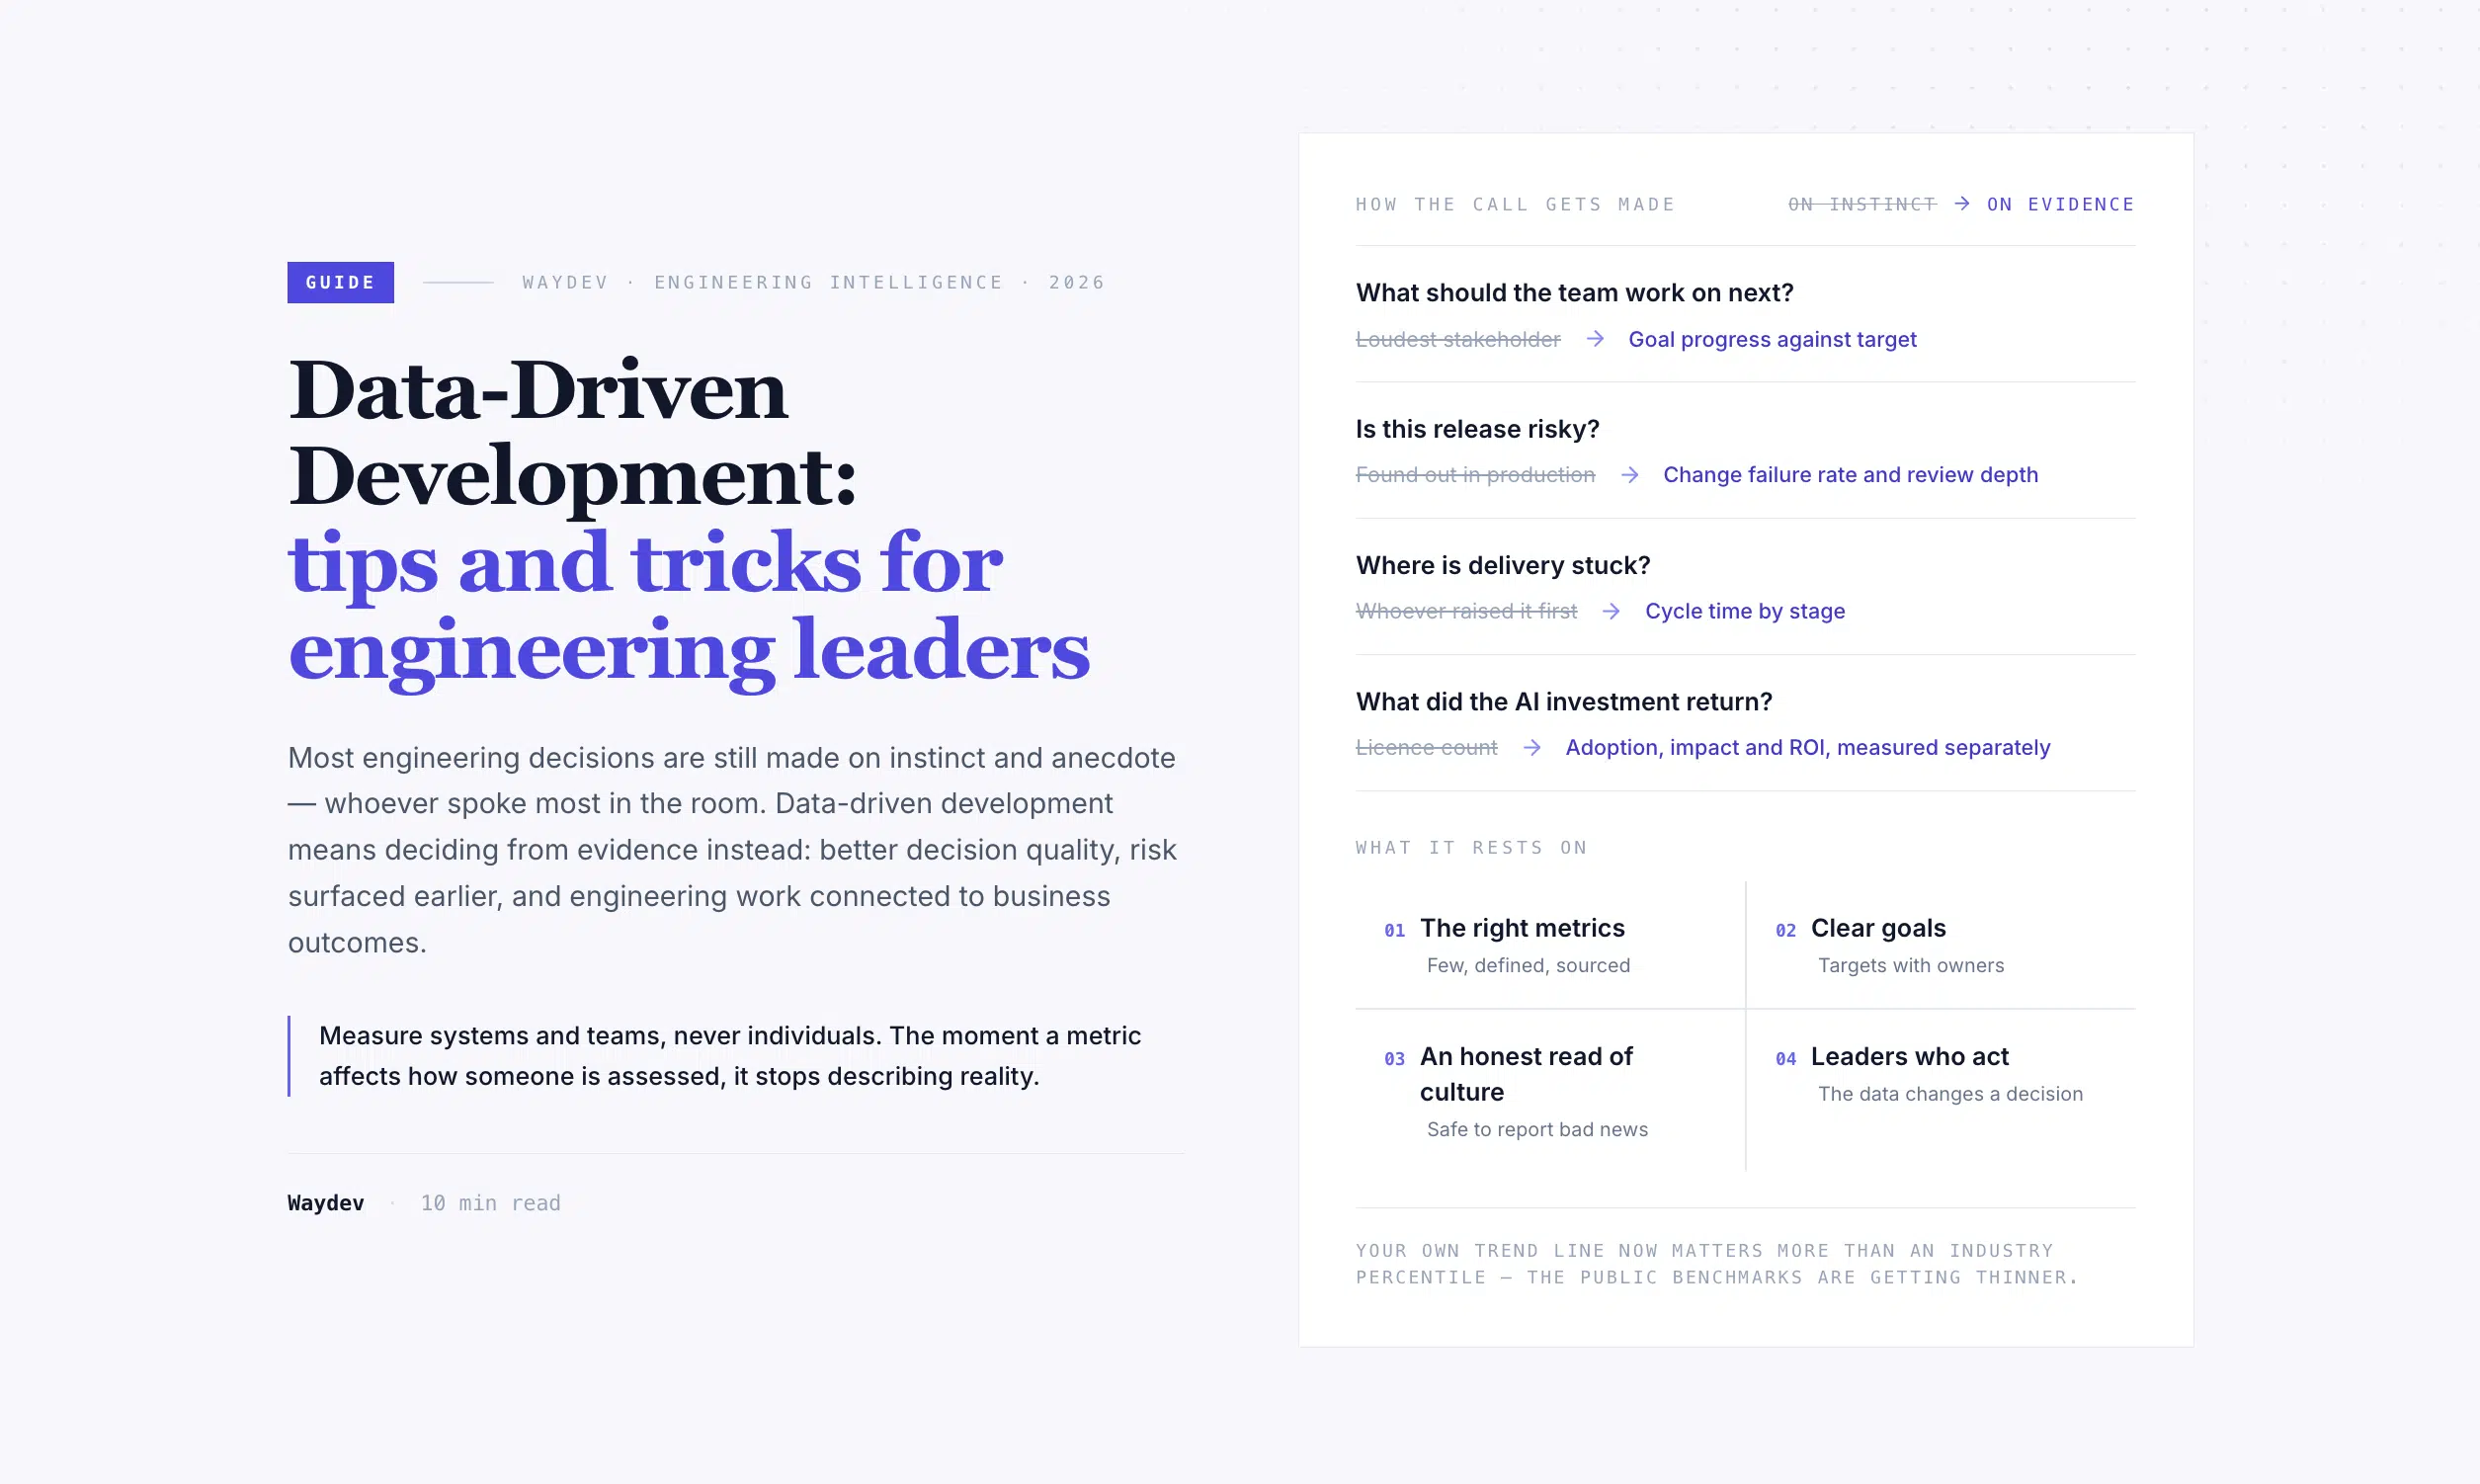
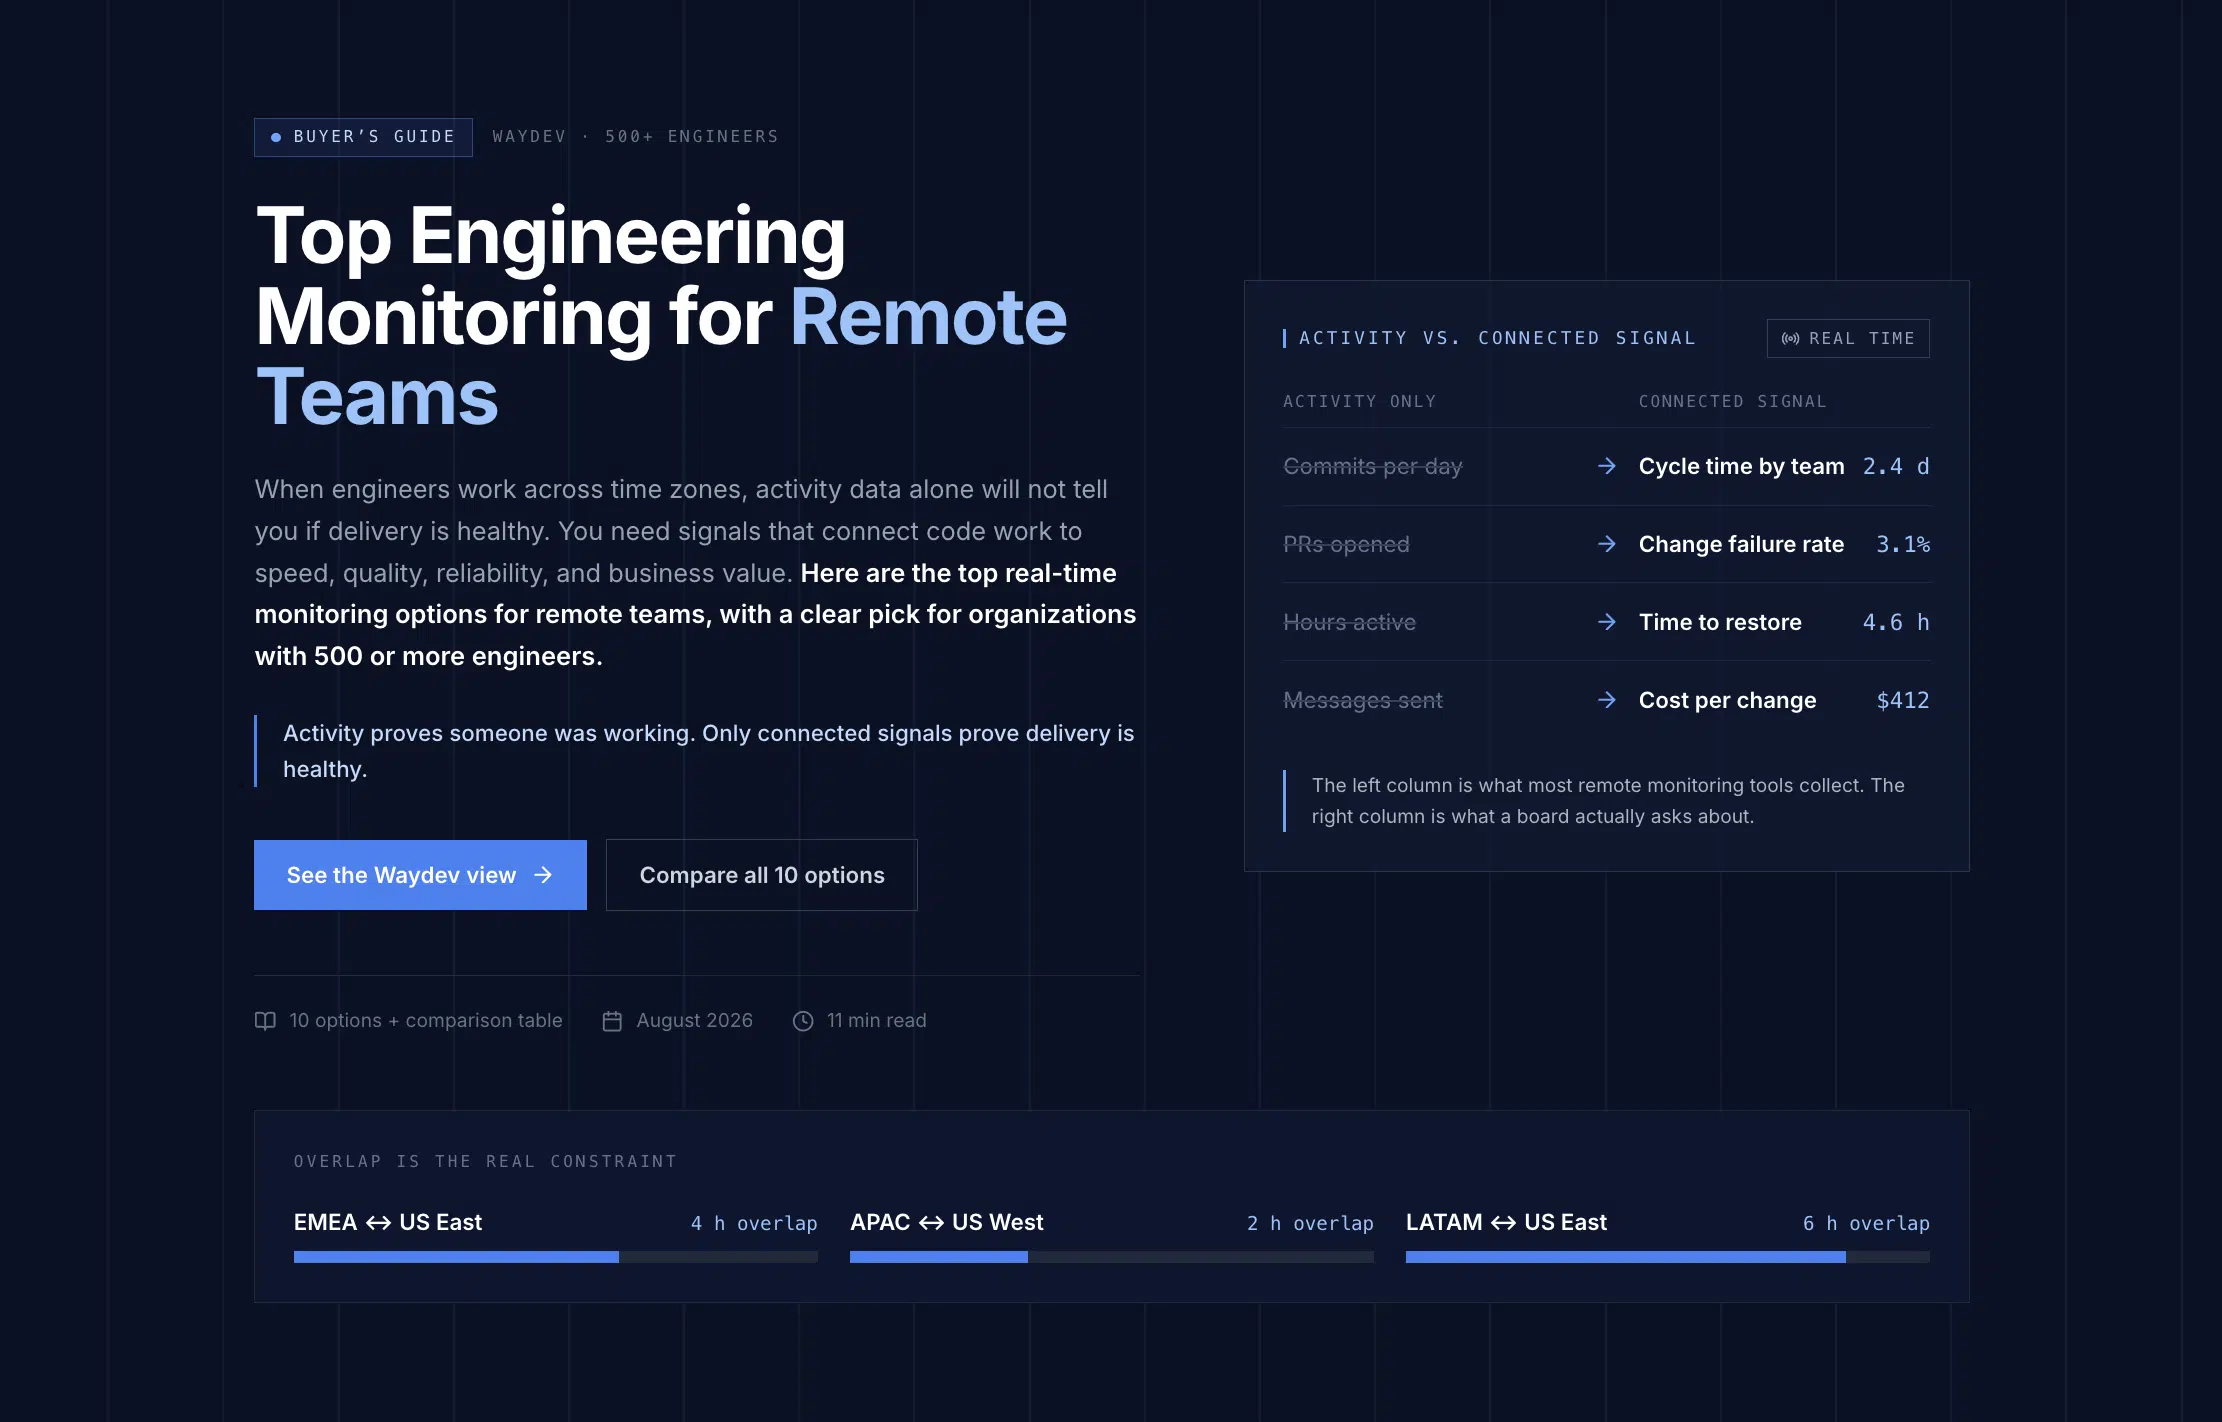
Waydev helps leaders build this view with team-level data across delivery, code quality, and resource use. We focus on objective signals rather than ranking individual engineers. That distinction matters in a board setting because the goal is investment clarity, not surveillance.

A useful rule is simple: every chart needs a sentence that explains what changed, why it changed, and what decision follows.
Delivery metrics become board-ready when they explain progress against a stated outcome. Cycle time tells you how long work takes to reach production. PR lead time shows where review or merge work waits. Deployment frequency shows how often teams release changes.
Those numbers are signals, not verdicts. A drop in cycle time may mean teams are shipping smaller work. It may also mean large projects are stuck outside the measured flow. Always pair the metric with scope and trend.
The four DORA measures give leaders a shared language for speed and stability. They include deployment frequency, lead time for changes, change failure rate, and mean time to recovery. The history and definition of DORA help explain why these measures work better as a group than as isolated targets.
At board level, translate them into plain statements:
That last mile matters. A DORA dashboard can show a worsening trend. It can’t explain the business effect unless you connect the trend to a launch, customer issue, compliance need, or capacity decision.
Use a five-slide structure when the board needs a fast read. Start with committed deliverables. Follow with customer-facing quality. Then show technical investment, delivery health, and people capacity. This gives directors enough context without forcing them through an engineering operating review.
Waydev can put these views into custom dashboards, so the same source data supports a weekly operating review and a quarterly board update. The board slide should stay short. Keep the deeper cuts ready for questions.
For a finance-focused version of the story, see How to Present Engineering ROI to the CFO. The useful link is between delivery movement and the cost of the work behind it.
Productivity metrics belong in the board conversation only when they show how engineering turns intent into working software. PR volume and lines of code are weak choices. They can rise while review queues grow, defects spread, or teams spend more time fixing generated code.
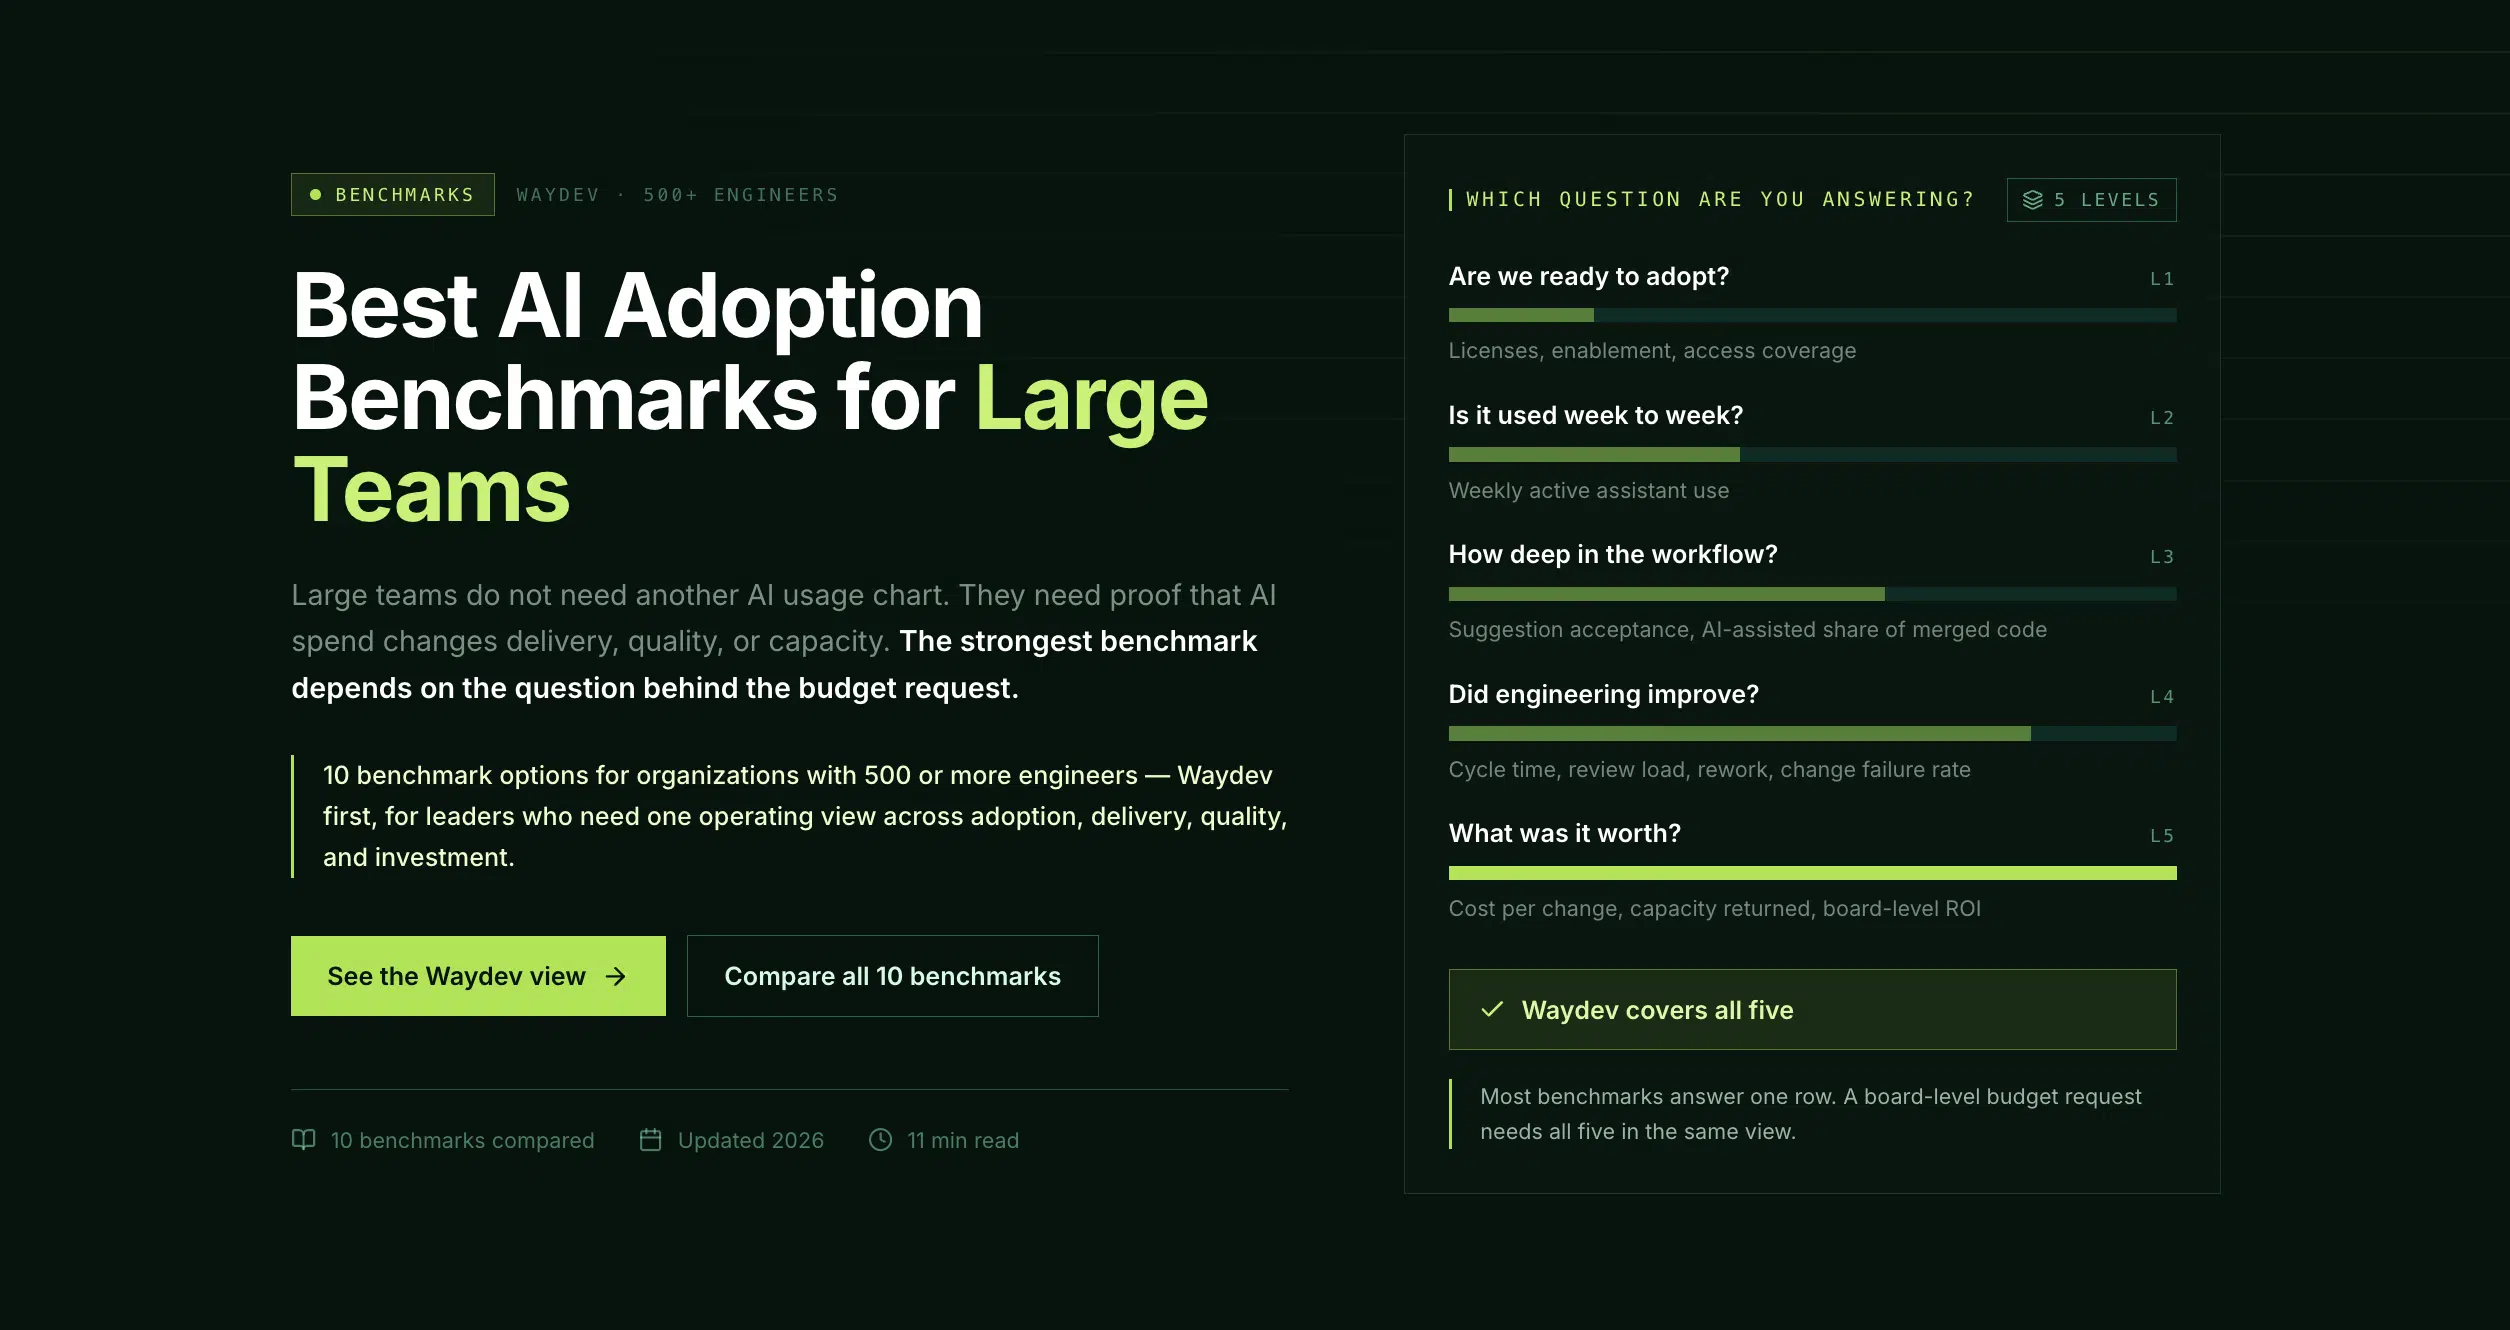
AI makes this gap wider. Leaders don’t need another tool count. They need to know if the tools they bought improve delivery after review, testing, and release work are included.
Track AI adoption at the team or organization level. Useful views include adoption by group, usage over time, and the change in delivery signals before and after rollout. Then check quality. If AI increases code output but cycle time stays flat, the bottleneck may have moved to review or validation.
Waydev’s AI-native approach includes AI Checkpoints and Signals for looking at adoption and impact in context. Ask Waydev can help leaders query engineering data without turning the board meeting into a manual spreadsheet exercise. Predict & Improve can point attention toward likely delivery risks, while MCP integration supports connected workflows where that setup is in place.
For a board case, show four things:
Capacity needs the same treatment. Show resource allocation by roadmap work, reliability, customer support, and technical debt. Include hiring progress for priority roles. Hiring activity itself consumes engineering time, so a delayed hire has an operating cost before the person starts.
Use this framing in How to Prove AI Coding ROI to the Board when the board asks for a defensible AI investment case. The answer should describe a measured change in business capacity, not a promise about faster typing.
Reliability is one of the clearest engineering metrics that matter to the board because customers feel its failure. Pair change failure rate with incident count, mean time to recovery, support issues, and the trend in customer-visible bugs.
Then connect the technical signal to product use. A slow page can reduce trust even when the service is technically available. User experience signals may include long-task duration, frame rate, rage clicks, bounce behavior, or conversion movement. These measures need product context, but they help show how engineering quality reaches the customer.
User experience signals can help teams assess loading, interactivity, and visual stability. Use them as supporting evidence, not as a substitute for customer or revenue data.
Spend belongs beside the outcome. Break cost into product delivery, platform work, reliability, support, and technical debt. If reliability work rises, show the risk it addressed. If product delivery slows, show whether the cause was staffing, dependencies, incidents, or scope change.

Think in unit economics. What does one month of delay cost for a strategic release? What is the cost of repeated incidents? How much capacity is tied up by manual recovery work? You may not have perfect answers, but a stated model is better than a vague claim that reliability is important.
Don’t hide bad news. A board trusts a leader who shows the issue, its business effect, and the next control. A quality slide that shows only green numbers invites harder questions later.
Metrics without context create bad decisions. A board needs the current value, the prior trend, the target, and the reason for movement. Add the teams or services included in the measure. State what changed in the measurement method.
Benchmarks can help, but they should not become quotas. Engineering systems differ by product type, release process, architecture, and risk level. Compare a team with its own past first. Use outside benchmarks as a prompt for questions, not as a ranking system.
Set guardrails before you publish a target. If teams are pushed to raise deployment frequency, they may split work into meaningless releases. If leaders chase shorter cycle time, they may avoid complex work. If AI adoption becomes the goal, people may use a tool without improving outcomes.
Use paired measures:
Ask three questions before each board meeting. What decision does this chart support? What could make the number misleading? What action will we take if the trend continues?
Keep the main deck to the few signals that explain the business. Store the detailed cuts in an appendix. Waydev’s custom engineering KPI dashboard approach can help you tailor the view for a VP, CTO, CFO, or board audience instead of sending everyone the same dense report.
The most useful measures connect delivery, reliability, capacity, and spend to business outcomes. Start with cycle time, deployment frequency, change failure rate, recovery time, committed work progress, resource allocation, and AI adoption. The right mix depends on the board’s current question, such as launch risk, cost control, or proof of AI value.
DORA metrics are a strong base, but they aren’t enough on their own. They describe software delivery speed and stability. Add customer quality, product experience, delivery commitments, and engineering cost so directors can see the business effect. A DORA trend needs a clear explanation of what changed and what leadership will do next.
Boards should measure AI adoption beside delivery and quality outcomes. Show which teams use the approved tools, then compare cycle time, deployment frequency, review load, and failure signals over time. AI usage alone doesn’t prove value. The board needs evidence that adoption improves capacity or delivery after the full workflow is counted.
Engineering leaders usually shouldn’t report lines of code as a board KPI. Code volume says little about customer value and can reward waste. Use outcome measures such as delivered commitments, cycle time, release stability, and product adoption. Code-level data can help diagnose a problem, but it should stay out of the headline narrative.
A board deck should contain only the metrics needed to support its decisions. A small set of linked measures is easier to trust than a crowded dashboard. Give each chart a target, trend, scope, and action. Keep team-level detail in an appendix for directors who want to test the story.
Build the board narrative around outcomes, not activity. Start with one business priority, choose paired metrics for speed and quality, then add the cost and capacity behind the result. Before the next meeting, map each chart to a decision and review the data with finance and product leaders. That is how engineering measurement earns a seat in the investment conversation.
Ready to unlock your SDLC productivity?