




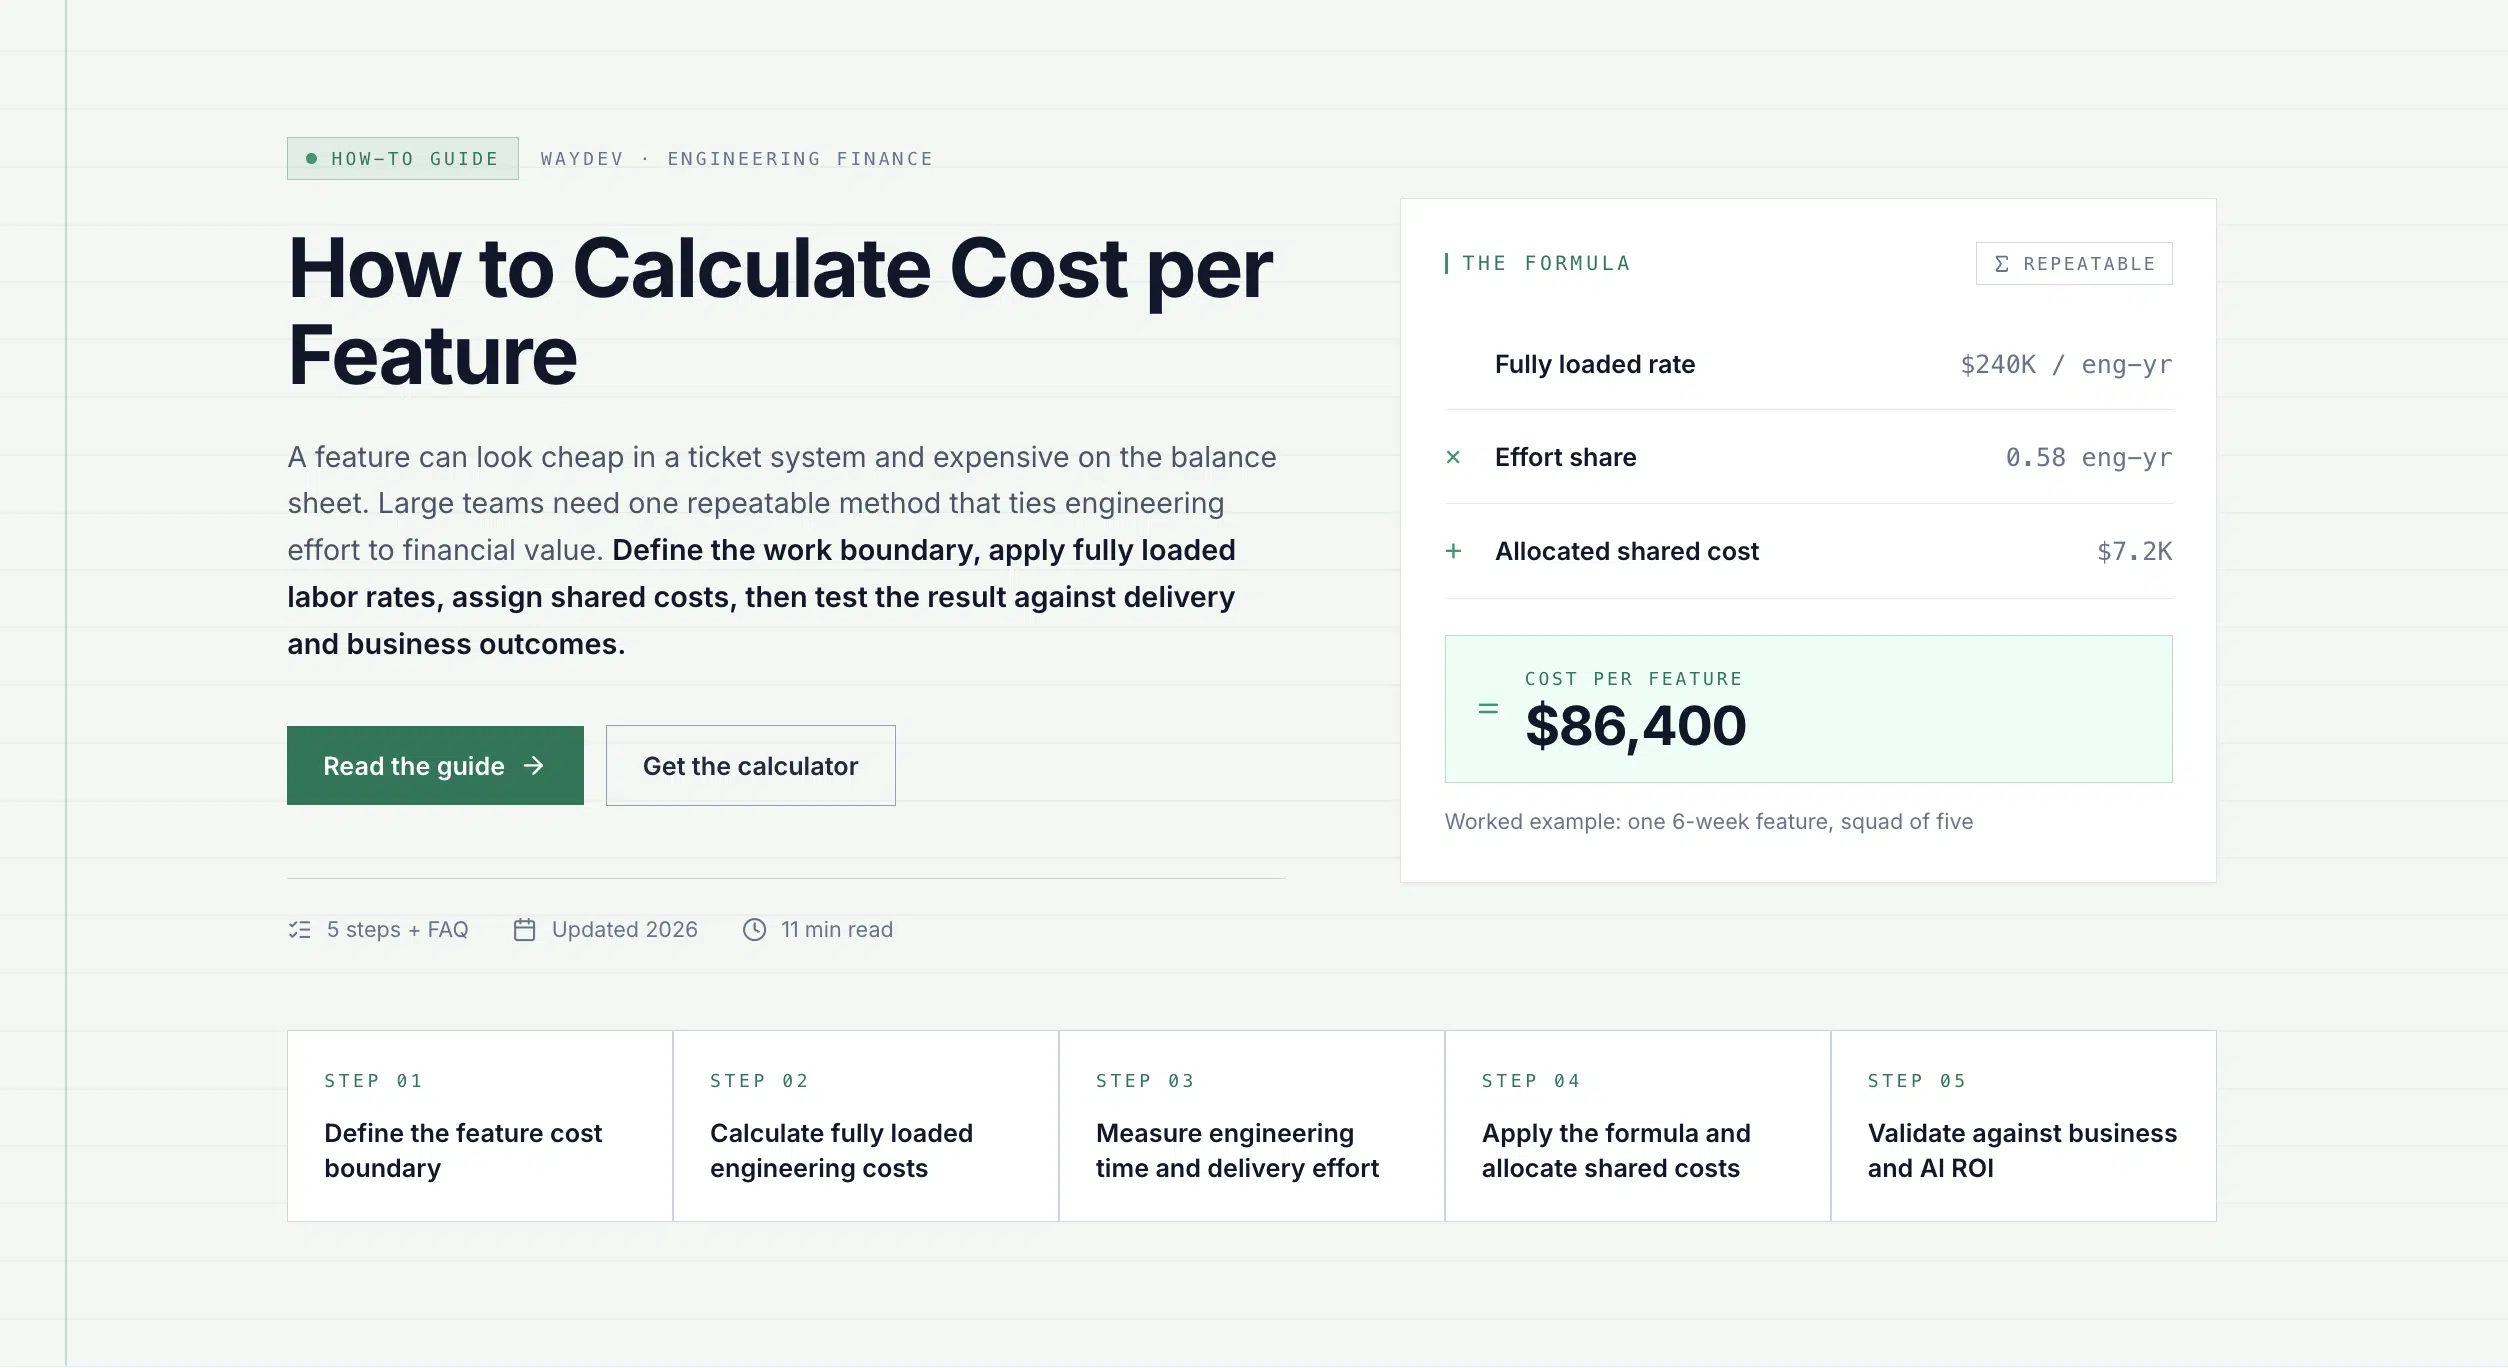

To calculate cost per feature, define the work boundary, apply fully loaded labor rates, assign shared costs, then test the result against delivery and business outcomes. The five steps below are written for organizations where dozens of teams touch the same roadmap and where the answer has to survive a CFO review.
Define the feature cost boundary
The first step in learning how to calculate cost per feature for large teams is deciding what counts as part of the feature. Write that rule before you pull any numbers.
Start with a clear feature record. Give it a name, an owner, a value stream, and a start and end point. The end point should usually mean production release, not the moment a pull request is merged. If the feature needs a launch review, migration, or customer enablement work, decide if those tasks belong in the same cost view.
Pick one of three boundaries
Delivery boundary
Cost work from the first active task through production release.
Product boundary
Add design, research, product planning, and launch work.
Investment boundary
Add support readiness, security review, infrastructure setup, and post-release fixes.
For a board or CFO review, the investment boundary is usually the most honest choice. It shows the cost of getting value into use, rather than the cost of writing code alone.
Set the time window next. A feature that stays open for six months may include delays that have little to do with active engineering work. Keep active effort separate from waiting time, but do not hide review queues or blocked work. Those delays affect the business cost of the feature.
Also record assumptions. State whether you count contractors, managers, shared platform teams, cloud use, and AI tool spend. A consistent rule is more useful than a perfect rule that changes each quarter. Cost accounting treats indirect costs as part of the cost of producing an output, not as noise to discard, so use a consistent method when you decide which shared costs belong in your pool.
A feature cost is only comparable when every team uses the same start point, end point, and cost boundary.
Calculate fully loaded engineering costs
To calculate cost per feature at large-team scale, replace simple salary math with a fully loaded hourly cost. That rate should reflect the cost of having a person available for engineering work.
For each role or team, gather the annual cash cost first. Then add employer taxes, benefits, bonus costs where they apply, and other direct employment costs. Next add the shared costs that support engineering work:
- Engineering management and program support
- Developer tools, source control, and issue systems
- Cloud environments used for build, test, and release
- Security, legal review, and compliance work
- Equipment, office costs, and internal IT support
- Training, onboarding, and time spent on required meetings
- AI seat fees, token use, model hosting, and evaluation work
Separate one-time costs from recurring costs. A platform migration may carry a large setup charge, while an AI coding program may carry monthly seat and usage charges. You can allocate both, but the report should show which costs will continue after release.
Use productive hours rather than total paid hours. Start with the work hours available in your chosen period. Remove approved leave, company holidays, and known non-project duties. Do not pretend that every remaining hour goes into feature work. In a large organization, architecture reviews and cross-team planning still consume time.
Use a role-based rate when individual salary data is sensitive. A team rate can still work if finance owns the input and updates it on a set schedule. If rates vary by region, keep the regional rates separate until the final rollup.
Waydev’s resource allocation model connects salary data with effort so leaders can see estimated cost by project, epic, or initiative. That gives finance a traceable input instead of a broad average spread across every team.
Keep a rate card with an owner, a source date, and a review date. If the rate has no owner, it will drift.
Measure engineering time and delivery effort
The next step is to measure the effort that belongs to each feature. Large teams should use system data wherever possible, then use estimates only for work that the systems cannot see.
Start with issue and code links. Map feature tickets to epics, pull requests, repositories, and deployment records. Then set the active work window. A useful window starts when the feature enters active development and ends when the related change reaches production.
Track both effort and elapsed time
- Active effort: hours or capacity spent doing feature work
- Cycle time: time from active work to completion
- Review lag: time spent waiting for the first review
- Rework: follow-on work caused by defects, scope changes, or failed release checks
- Coordination effort: time spent by product, design, security, data, and platform teams
Do not convert story points directly into dollars. Points measure relative size inside a team’s system. They do not have a stable value across teams. A point-based model can help with early planning, but replace it with hours or observed capacity when you publish a financial result.
For bottom-up estimating, split the feature into work packages. Estimate each package with a low case, a likely case, and a high case. Add the packages only after the team has named the work. This reduces the risk of hiding a large migration or test task inside one neat estimate.
Use the project management triangle as a constraint check. If the deadline is fixed, scope or staffing must change when the estimate grows. If scope is fixed, the delivery date may move. Cost is the result of those choices, not a number that exists outside them.
Measure uncertainty in a separate field. Mark each feature as measured, estimated, or modeled. A feature with clean time records can support a narrow range. A feature with missing links needs a wider range and a named assumption.
Keep quality beside speed. A feature that ships sooner but triggers repeated fixes has a higher cost than its first release suggests. Record escaped defects, rollback work, and incident response against the same feature where your data supports that link.
Waydev connects delivery signals to cost views at the team and initiative level. Leaders can inspect cycle time and deployment flow without turning the analysis into a ranking of individual engineers.
By now you should have a feature register with scope, linked work, effort, elapsed time, quality signals, and confidence level. The next task is turning those inputs into a cost figure.
Apply the formula and allocate shared costs
The core formula for cost per feature is simple: multiply feature effort by the right loaded rate, then add the shared costs assigned to that feature.
If several teams work on the feature, calculate each team separately. A platform engineer may use a different rate from a product engineer. Add the results only after each team has an identifiable effort input.
Allocate shared costs with a rule that matches how the cost is caused. Use engineering hours for shared management. Use active users or token volume for AI spend. Use compute usage for cloud charges. Use review hours for security or compliance work. Avoid splitting every cost evenly across teams. Equal allocation feels easy, but it can make high-use features look cheap.
| Cost type | Suggested allocation base | Decision use |
|---|---|---|
| Engineering labor | Recorded hours or capacity share | Compare delivery cost across features |
| Management and program work | Engineering hours or team share | Show the full people cost |
| AI licenses | Seats assigned to participating teams | Measure fixed program spend |
| AI token usage | Tokens or recorded usage by workflow | Test AI cost against output |
| Cloud and test systems | Usage, runs, or environment time | Find expensive delivery paths |
| Security and compliance | Review hours or fixed project charge | Include risk-control effort |
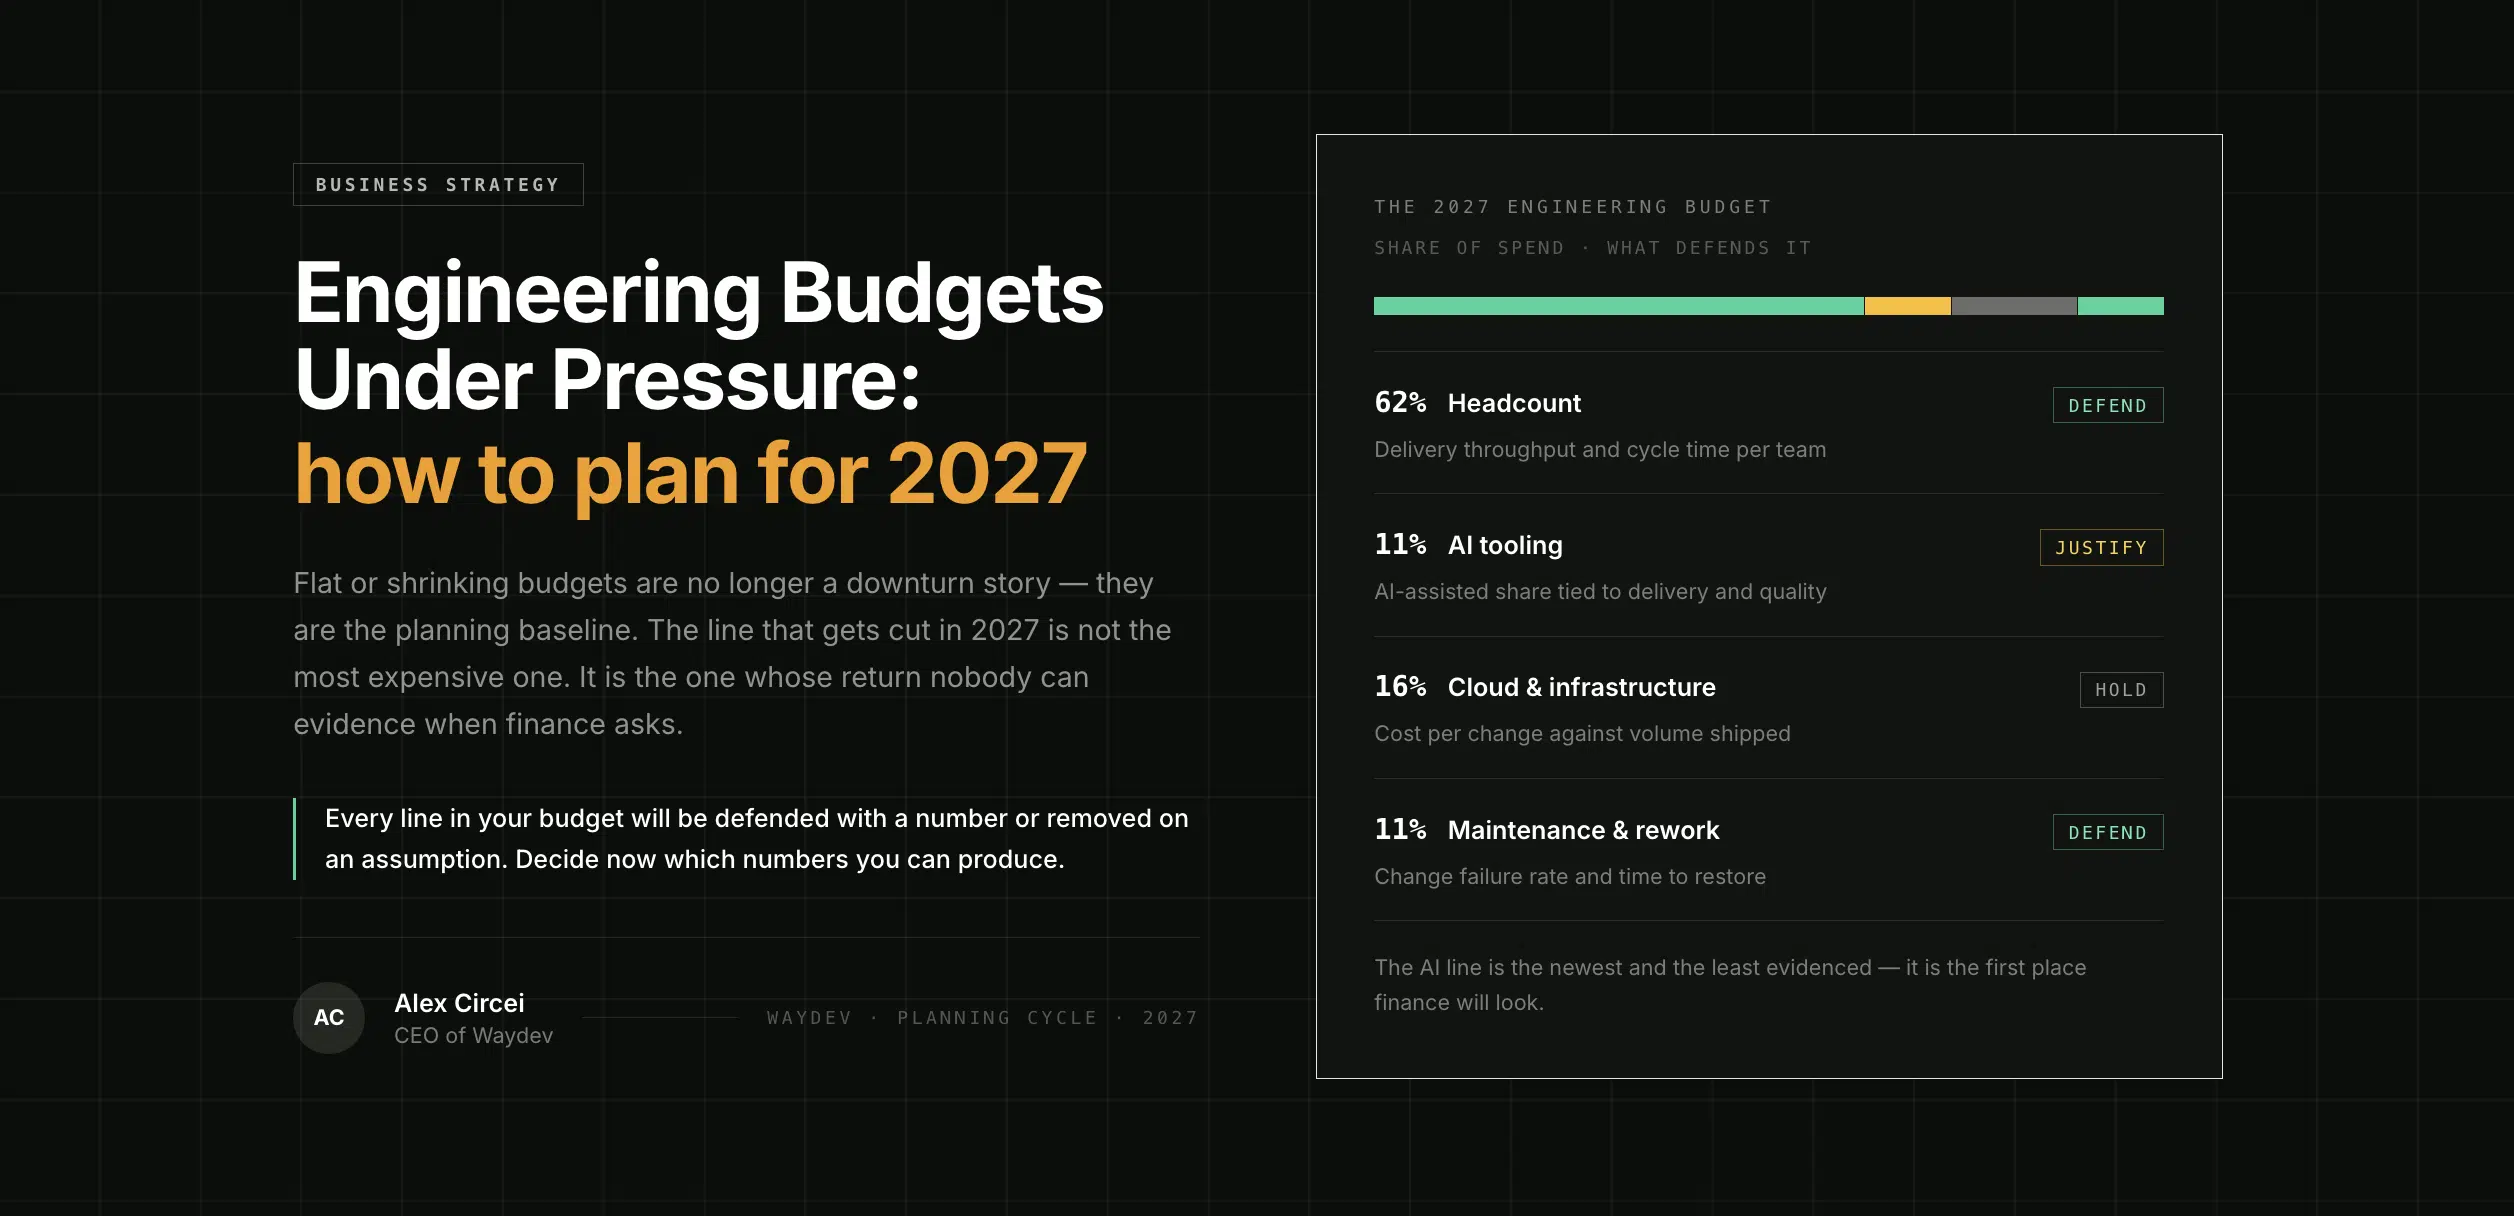
Say a feature uses a substantial number of engineering hours at a loaded hourly rate. Direct labor is the resulting loaded labor cost. Add the assigned share of program work, cloud use, security review, and AI costs. The final number is the feature’s full delivery cost, not merely its payroll slice.
Keep a low, likely, and high case when inputs are uncertain. Do not hide uncertainty behind a single decimal. Show the range to executives and explain which assumption drives the spread.
Put cost of delay beside the cost figure
A cheaper feature may still deserve priority if delaying it blocks a major sale or leaves a known risk in place. WSJF can help when you estimate delay cost, risk reduction, and opportunity enablement against job size. RICE is another choice, using Reach × Impact × Confidence ÷ Effort. Little’s Law links work in progress with cycle time and throughput, and the standard relationship helps explain why a feature queue can raise elapsed cost even when active effort stays flat.
Store the formula in a shared workbook or data model. The point is repeatability. A CFO should be able to ask where a figure came from and receive the same answer from the source records.
Validate cost per feature against business and AI ROI
The final step in calculating cost per feature for large teams is testing the number against value. A cost figure alone cannot tell you if the feature was a good investment.
Choose one main value case: revenue enabled, revenue protected, cost avoided, capacity gained, or risk reduced. Keep the cases separate. If you put every possible benefit into one total, the result becomes hard to defend.
For revenue, connect the feature to a forecast or measured change in bookings, expansion, conversion, or retention. For cost reduction, show the old process and the new process. For capacity, use verified hours saved and apply a realization rate. Reclaimed time only has financial value when the organization can redirect it to funded work. For risk reduction, estimate the likely cost of the failure and state your confidence. Do not treat avoided incidents as guaranteed revenue. Show the assumption as a scenario instead.
Split AI cost into three layers
- Tool licenses and usage charges
- Integration, security, training, and administration
- Quality and rework caused by AI-assisted changes
Then compare AI use with delivery and quality. Track AI-touched work at team or value-stream level. Pair it with cycle time, deployment frequency, change failure rate, defect trends, and rework. Faster code generation has little value if review queues or production fixes rise.
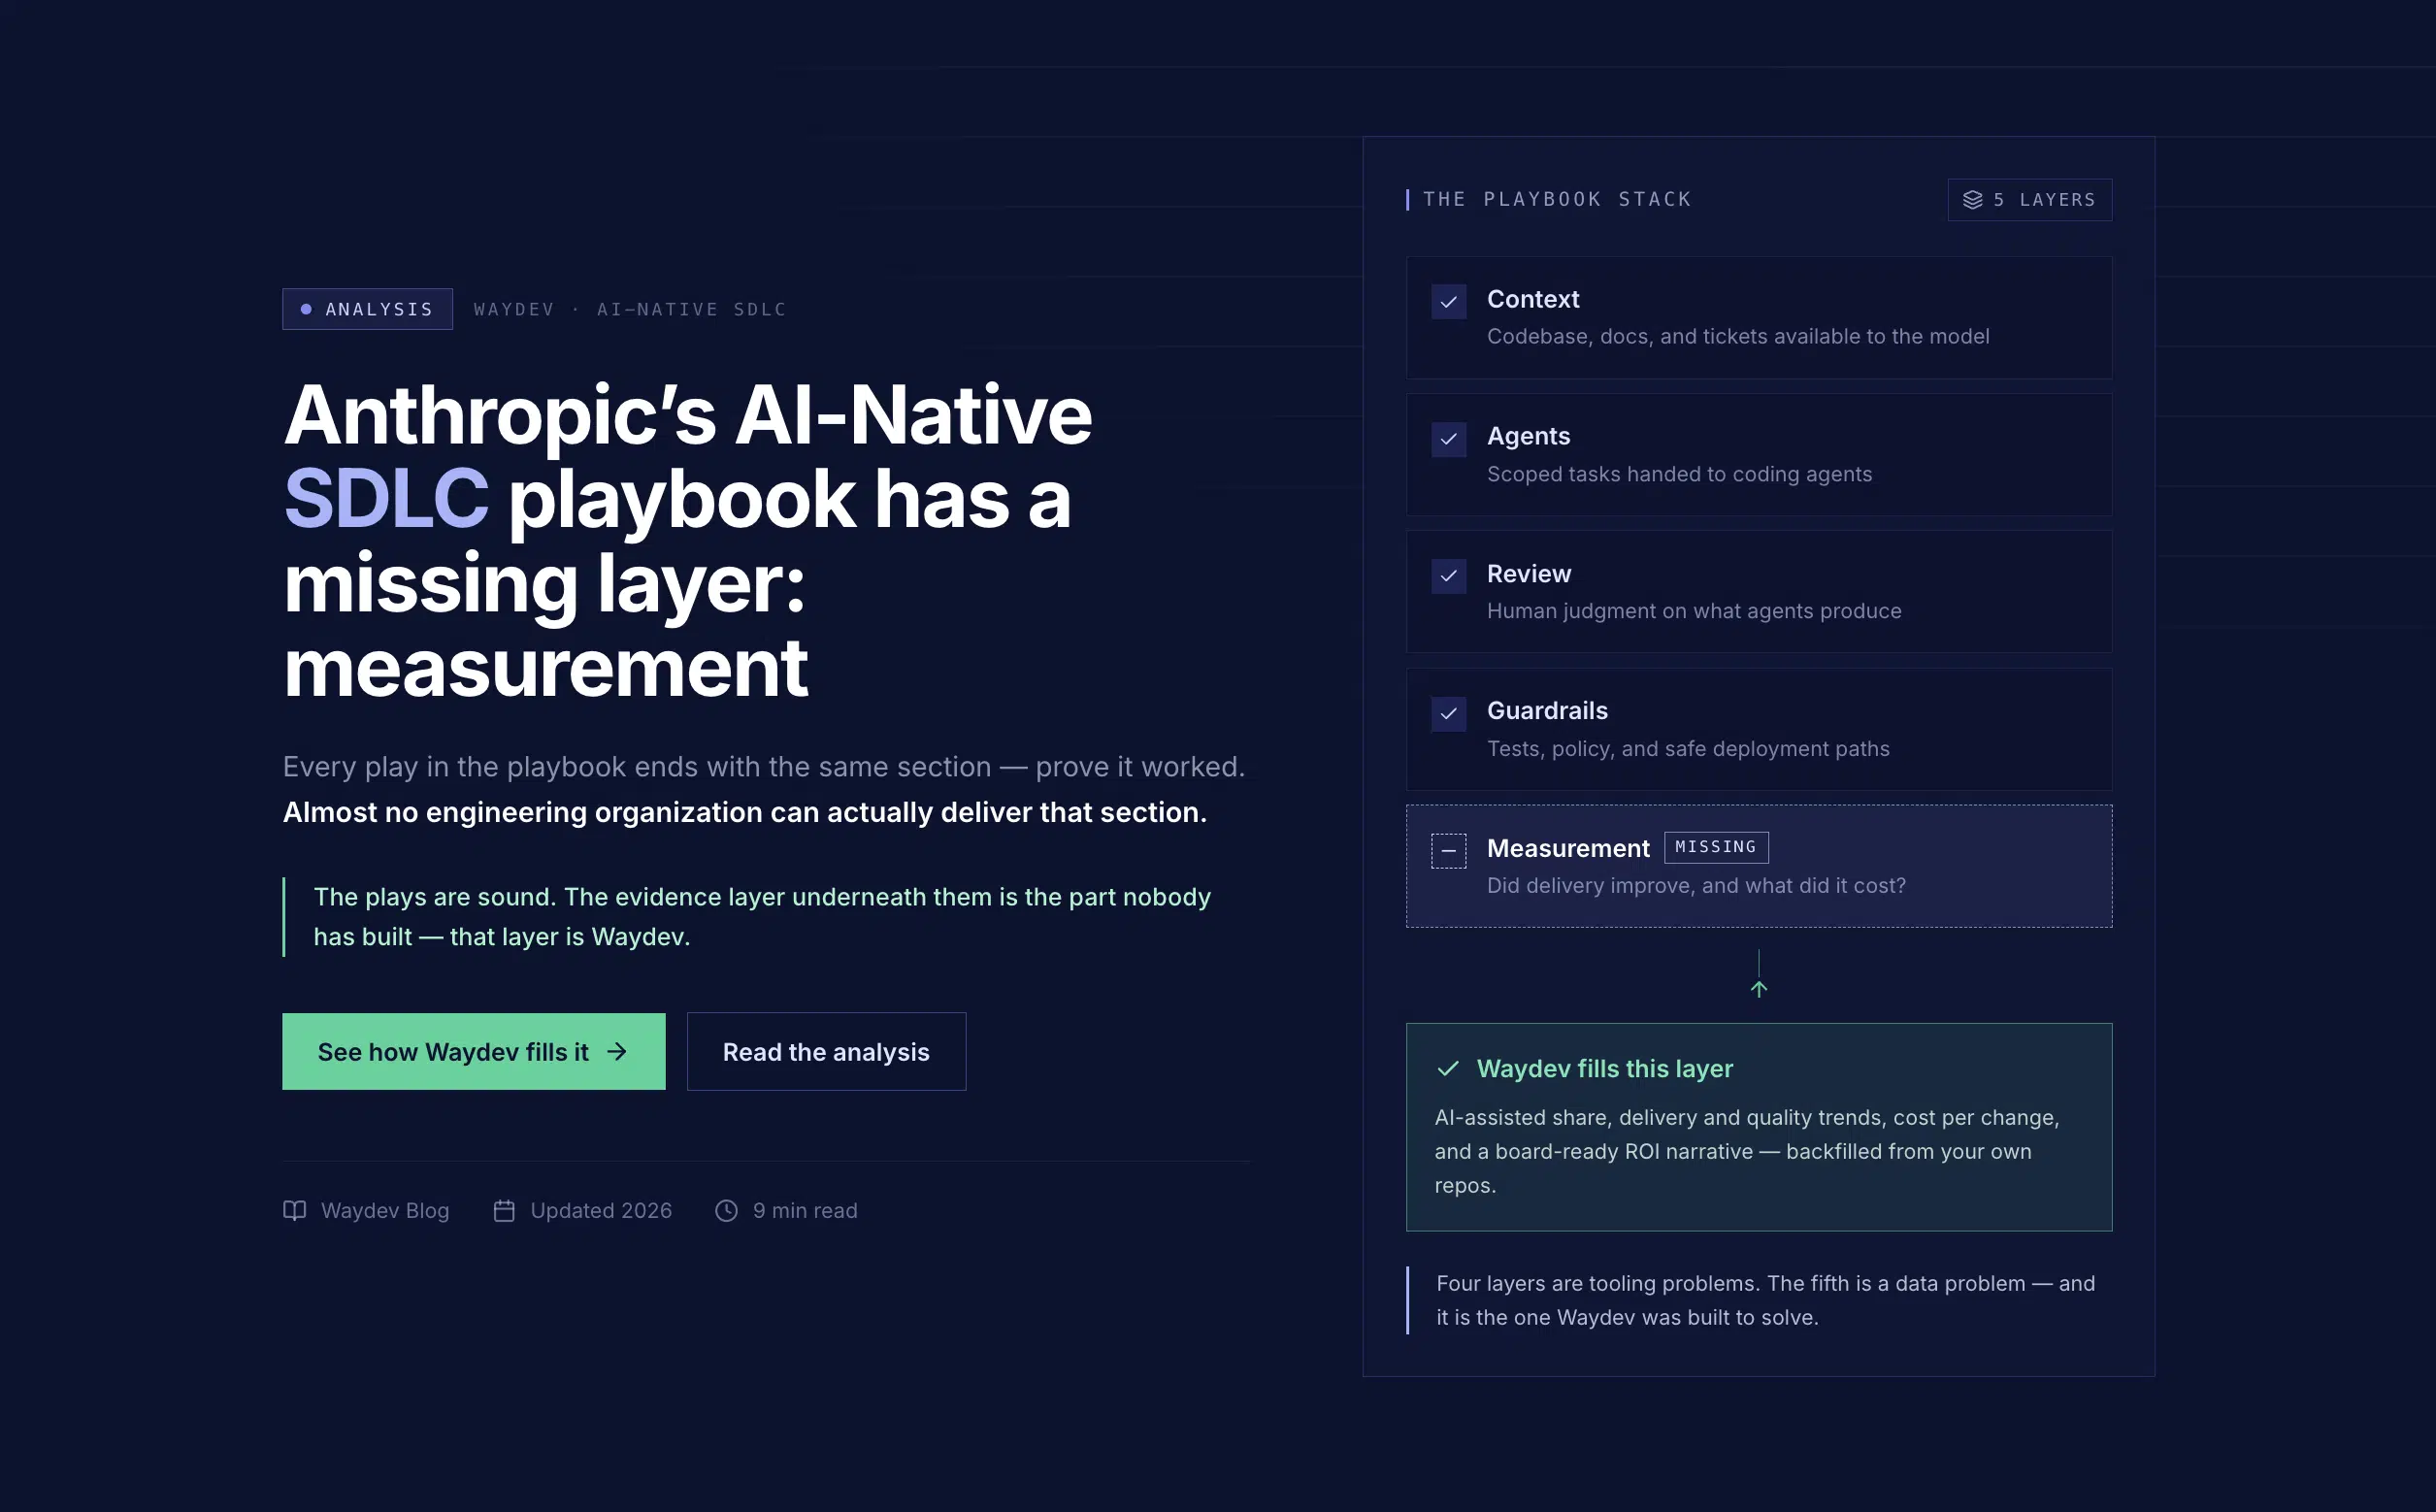
Waydev’s AI-native engineering intelligence platform gives leaders a way to connect adoption with delivery and cost. Ask Waydev lets executives query engineering signals in plain language. AI Checkpoints mark review points. Signals and Predict and Improve help teams watch trends. MCP integration connects engineering intelligence to approved workflows.
For a board discussion, show the baseline, the current result, the total cost, the confidence level, and the next decision date. A portfolio view is stronger than one company-wide AI number because it shows which teams and use cases produce value.
Approve more work when measured value beats full cost and quality stays within the agreed guardrails.
FAQ
What is the formula for cost per feature?
The formula is feature hours multiplied by the fully loaded hourly rate, plus allocated shared and non-personnel costs. When you calculate cost per feature for large teams, apply the formula by team first, then add the results. This keeps different salary rates and shared services visible instead of hiding them inside one average.
Should story points be used to calculate feature cost?
Story points are useful for relative planning, but they should not be treated as dollars. Their meaning varies between teams. To calculate feature cost with better accuracy, convert the feature into observed hours or capacity share. If you must use points, calibrate them against historical team data and label the result as an estimate.
What costs should be included in a large feature?
Include engineering labor, management time, product and design effort, security review, cloud use, tools, equipment, meetings, and AI charges when they support the feature. The right cost boundary depends on the decision. A delivery report may use direct work, while a CFO case should include the full investment cost.
How do AI tools change cost per feature?
AI tools add license fees, token or usage charges, setup work, training, review effort, and possible rework. When measuring cost per feature for large teams, compare AI spend with cycle time and quality at the team level. A lower coding cost is useful only if delivery improves without adding defects or support work.
Conclusion
Use one shared cost boundary, a finance-owned rate card, linked delivery data, and a clear value case. Start with a small set of completed features, calculate the low and likely cases, then review the results in Waydev or your existing engineering intelligence system. Give your CFO the source records and the next decision date.