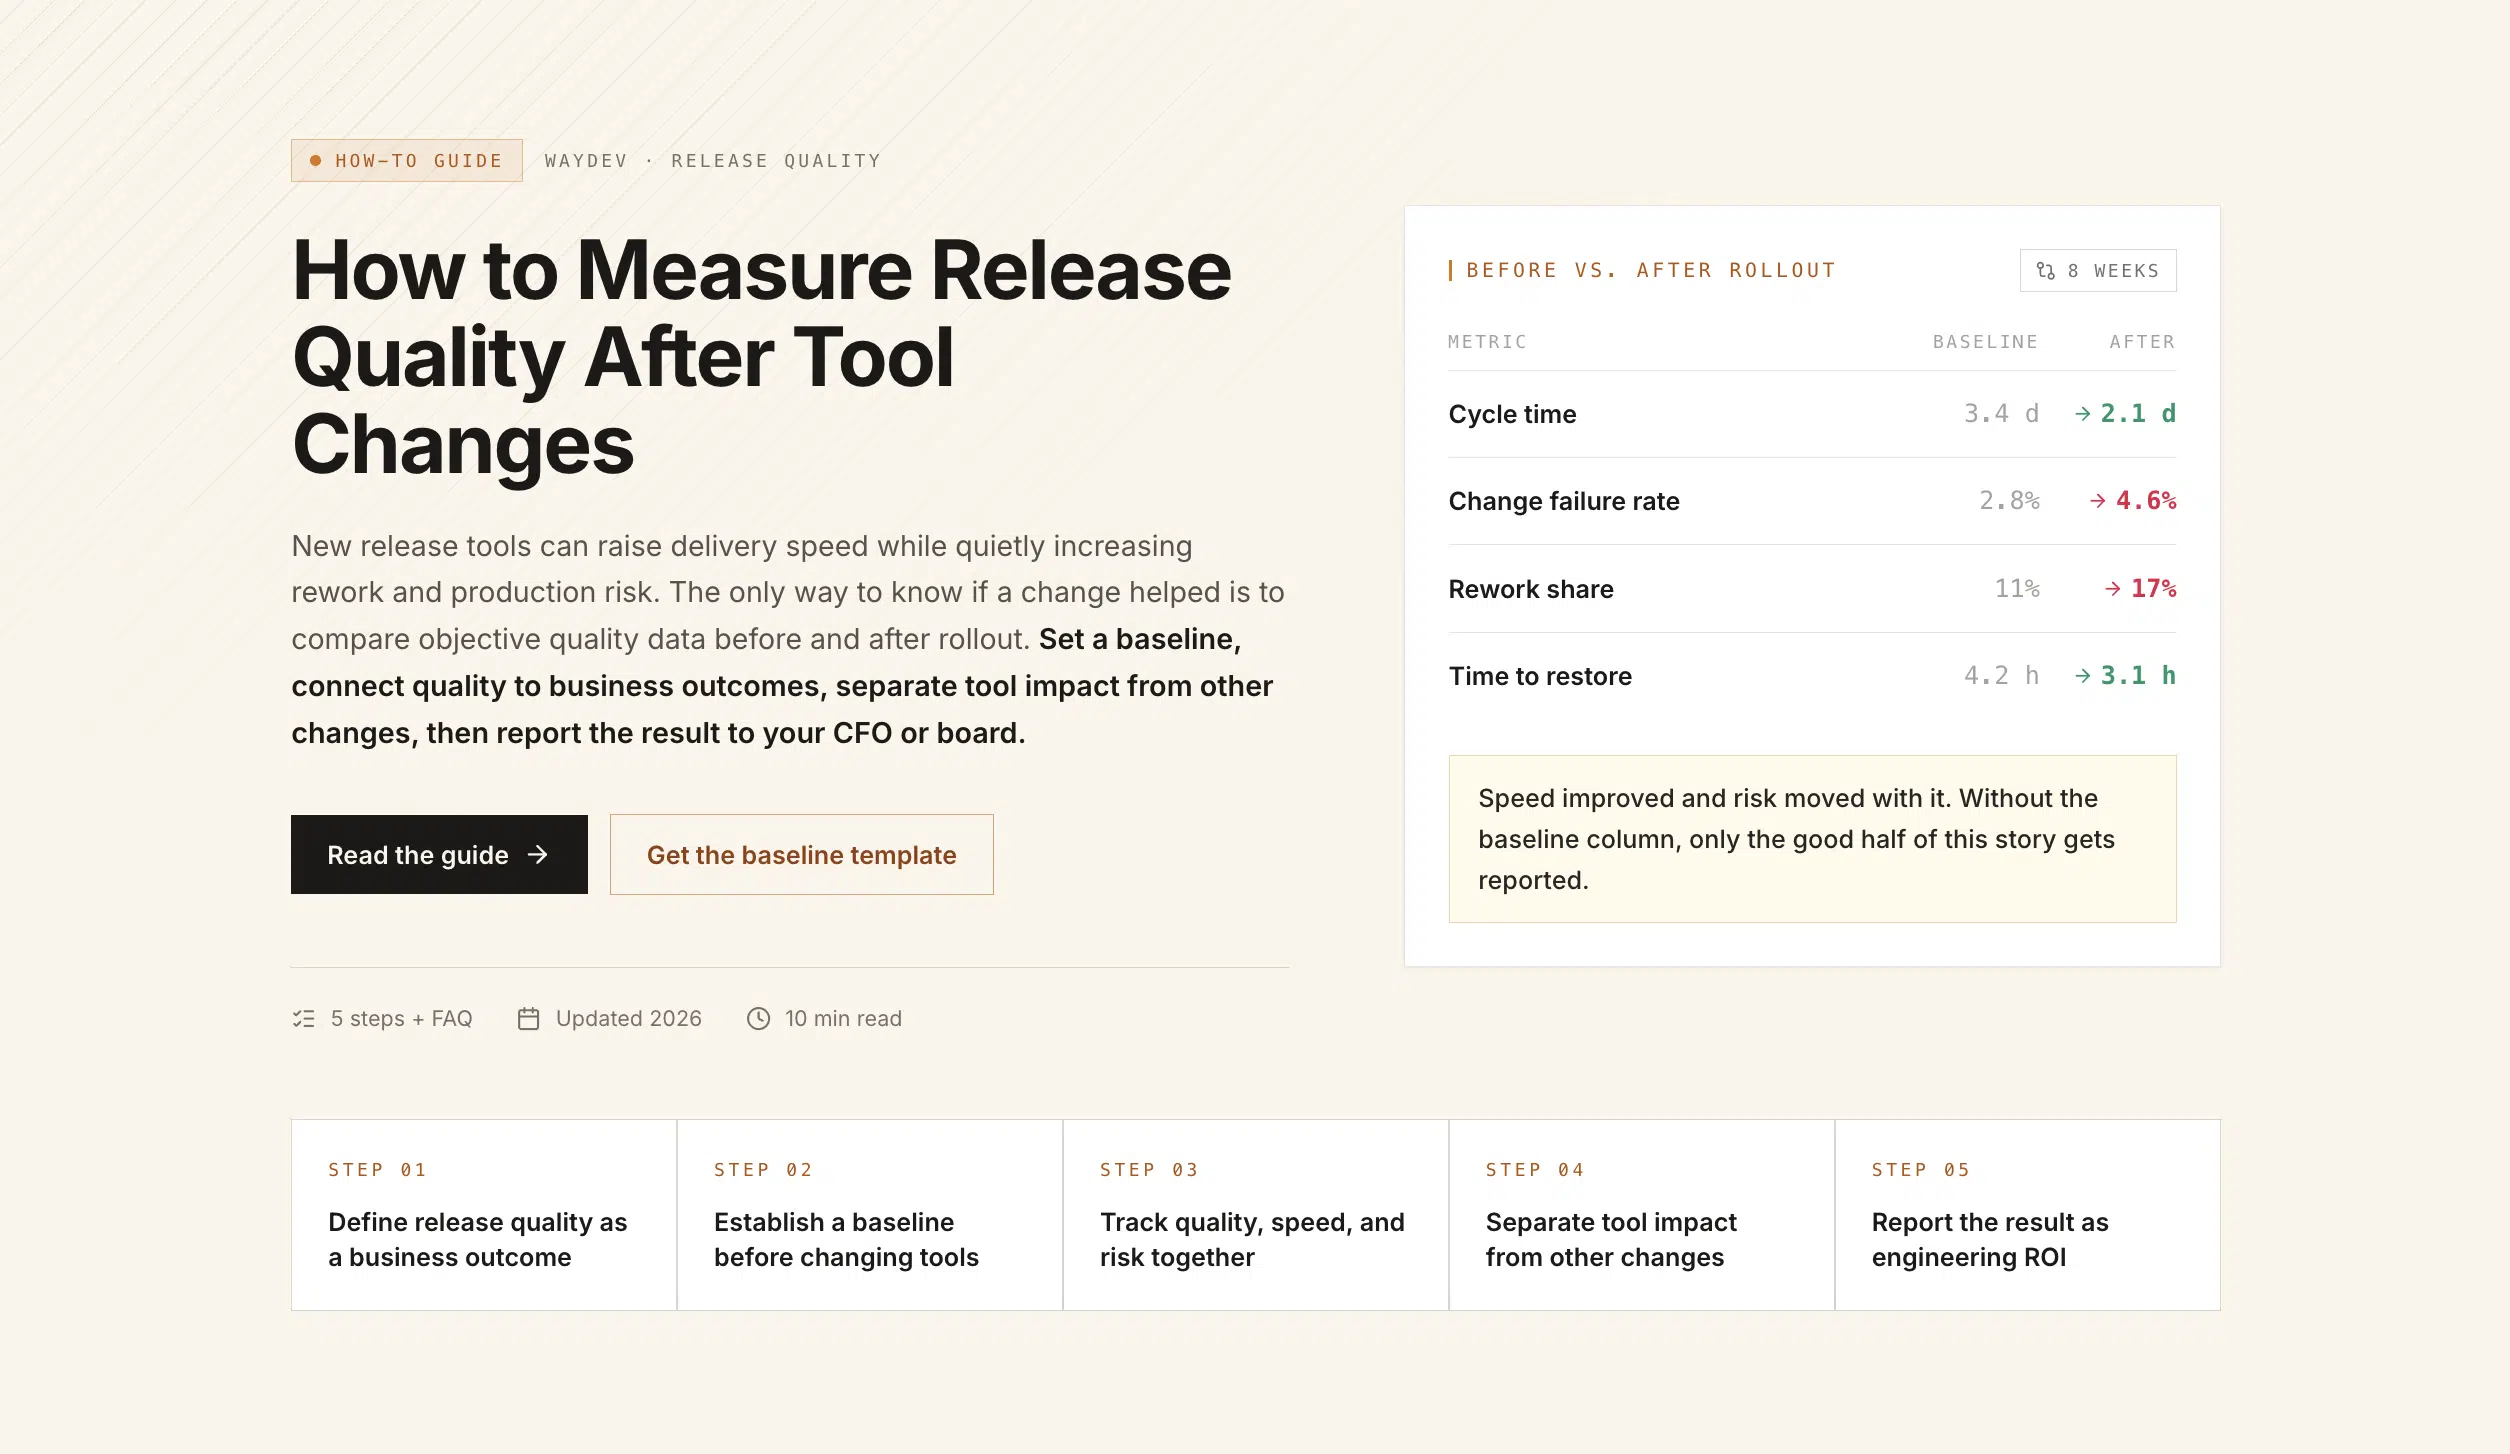

Use these five steps to set a baseline, connect release quality to business outcomes, separate tool impact from other changes, and report the result to your CFO or board.
Define release quality as a business outcome
To measure release quality improvements after tool changes, first define what better means for the business. A release is not higher quality because it shipped faster. It is better when customers get useful changes with fewer failures and less recovery work.
Write a short measurement brief before you touch the tool. Name the release process in scope, the teams affected, and the business result you expect. A new AI coding tool may aim to shorten lead time without raising escaped defects.
Keep the unit of analysis at the team, product, service, or organization level. Do not turn release data into a ranking system for individual engineers. That approach creates fear and weakens the data, because people change behavior to protect a score.
Start with four outcome measures
Delivery
Lead time for changes and deployment frequency.
Release
Change failure rate and mean time to recovery.
Quality
Escaped defects, support cases, and severe incidents.
Engineering
Rework hours, review delay, and tool spend.
Pair each metric with a decision. If change failure rate rises, who reviews the release gate? If lead time falls but review wait grows, who owns that bottleneck? Use plain definitions. A metric that different teams calculate in different ways cannot support a board-level decision.
Waydev helps leaders connect DORA, SPACE, work type, and AI signals in one view. AI Checkpoints can surface quality risks in AI-assisted work, while Signals can flag unusual changes before they become incidents.
Establish a baseline before changing tools
A baseline gives you the before picture needed to measure release quality after a tool change. Without one, teams often mistake normal variation for improvement.
Choose a fixed window before rollout. Several weeks can work for steady release cycles. Use a longer window when teams ship monthly, handle migrations, or face seasonal demand. Record the cutoff date and keep the metric formulas unchanged after adoption.
Capture the same measures you plan to review later
- Median lead time for changes
- Deployment frequency by service or team
- Change failure rate
- Mean time to recovery
- Review wait time
- Rework, churn, and escaped defect signals
- Tool cost and enablement cost
Use medians for time measures when possible. A single emergency release can distort an average. Keep the raw event data too, because executives may ask why a result changed.
Segment the baseline before you roll it up. A company-wide result can hide a split outcome. One platform team may improve while a customer-facing team takes on more review work. Break results down by team, service, product area, work type, and release path.
Also record context. Note major migrations, changes in team size, new approval rules, incidents, and shifts in product scope. Those facts will not replace the metrics. They explain them.
Treat risk management as a continuous process rather than a one-time check. That principle fits release measurement well. Review quality before rollout, during adoption, and after the new workflow settles.
Waydev pulls data across source control, issue tracking, and delivery systems, which reduces the manual work of building a baseline across a large engineering organization. It also lets leaders filter results by team and application instead of relying on one broad average.
Freeze your baseline definition in the scorecard before launch. Include the time window, teams, systems, exclusions, and formulas.
By now you should have a dated baseline that another leader could audit without asking the original analyst for help.
Track quality, speed, and risk together
To measure release quality improvements after tool changes, read speed metrics beside quality and risk signals. A faster pipeline is a weak result if it produces more failed changes.
| Metric | What it tells you | What to check beside it | Decision signal |
|---|---|---|---|
| Deployment frequency | How often changes reach production | Change failure rate | More releases are useful only when stability holds |
| Lead time for changes | How long a change takes to reach production | Review wait and rework | A shorter path may hide work pushed into review |
| Change failure rate | How often releases cause production failure | Defect severity and rollback data | A rise calls for release or test review |
| Mean time to recovery | How quickly teams restore service | Incident count and impact | Faster recovery does not excuse more failures |
Software quality includes more than release speed. It also covers reliability, maintainability, and suitability for use. For an executive scorecard, translate those ideas into signals your systems can actually record.
Track AI-assisted work with care
Useful signals may include active use, AI-touched pull requests, acceptance or rejection patterns, cycle time, rework, and incidents. Lines of code generated is a weak outcome measure. More code can increase review load or technical debt.
Review quality for at least 30 days when delayed defects are a concern. Some problems appear after merge, during integration, or after customers use the feature. Compare AI-touched work with similar work that did not use the tool, but avoid claiming causation from a simple correlation.
Signals and AI Checkpoints help leaders watch for anomalies in delivery and quality. Ask Waydev a question such as “Did cycle time improve for teams using the new tool while failure rates stayed flat?” The answer should show the time range, the teams, and the data behind the result.
In a review, show the baseline beside the current period, on the same chart scale. Otherwise a small improvement can look dramatic simply because the visual changed.
Call a tool change successful only when delivery improves without an unacceptable rise in failure, rework, or customer harm.
Separate tool impact from other changes
Tool impact is difficult to measure when several process changes happen at once. To isolate the result, document what changed and compare similar groups during the same period.
Build a simple change log. Record the rollout date, tool scope, team scope, training period, policy changes, and major releases. Include changes to CI rules, approval steps, staffing, and incident response. These events can affect release quality even when the new tool has no effect.
Use cohorts when you can. Compare teams that adopted the tool with similar teams that have not adopted it yet. Match them by product area, work type, team size, service criticality, and delivery process. Then compare how each group changed over the same period.
In this example, the rollout group cuts median lead time by 18% while its change failure rate stays stable. A similar group without the tool cuts lead time by 7% during the same window. That pattern supports a stronger case than a simple before-and-after chart, though it still does not prove the tool caused every point of change.
Watch for selection bias. Teams that volunteer first may already have better processes. They may also have leaders who are more willing to test new workflows. State that limitation in the report instead of hiding it.
Run a sensitivity check. Remove an unusual incident week and recalculate the result. Split small releases from large releases. Review the outcome by service. If the finding disappears after one extreme event is removed, report the result as uncertain.
Traditional DORA dashboards often show what changed but not why. Waydev adds team, work-type, and AI adoption context so leaders can test competing explanations. That granular view matters when a CFO asks whether a new license caused the improvement or whether the market simply gave teams less work.
By now you should have an impact estimate with clear limits. Confidence grows when the result appears across comparable teams and several review windows.
Report the result as engineering ROI
The final step is to turn release quality data into an investment decision. Executives need more than a dashboard with green arrows. They need to know what changed, what it saved, what risk moved, and what should happen next.
Use four blocks in the report
- Usage: which teams adopted the tool, and how deeply
- Delivery: whether lead time or deployment frequency changed
- Quality: whether failures, defects, rework, or recovery time changed
- Finance: what the program cost, and what value it produced
Calculate capacity value with finance. A simple model is verified hours saved per week multiplied by loaded hourly cost, working weeks, and a realization rate. Subtract the full program cost afterward.
Include license fees, usage fees, integration work, training, security review, administration, and ongoing evaluation. Deduct quality costs tied to extra review or rework. Do not count the same recovered time twice as both labor savings and added output.
Report ranges when the data is uncertain. A cautious estimate is easier to defend than a precise number built on weak assumptions. Show the assumptions beside the result.
Set a review rhythm. Engineering teams can inspect workflow signals each week. Leadership can review delivery and quality each month. Finance and the board can review spend, capacity value, and risk each quarter.
That is the standard to aim for. Tie every investment claim to an outcome, a time window, and a next decision.
Waydev’s real-time insights and dynamic reports support these review cycles. Leaders can use Ask Waydev to generate a report by team, metric, or time period, then inspect the SQL behind an insight when they need transparency. Predict and Improve can also help identify likely delivery risks before the next funding review.
FAQ
How long should you measure release quality after a tool change?
Measure release quality for several weeks after rollout, then review again after at least 30 days when delayed defects or rework matter. Use a longer period for monthly release cycles, migrations, or seasonal work. Keep the same metric definitions across the baseline and post-change windows so the comparison stays fair.
What metrics show that release quality improved?
Release quality improves when failure and rework signals fall or hold steady while delivery gets faster. Track change failure rate, mean time to recovery, escaped defects, lead time, deployment frequency, and review wait time. Read the metrics together. A shorter lead time alone does not prove that a tool improved quality.
How do you measure the impact of an AI coding tool?
Measure AI tool impact through four layers: adoption, delivery, quality, and cost. Compare AI-touched work with similar work that did not use the tool. Review cycle time, deployment frequency, rework, incidents, and usage cost. Avoid using generated lines of code as the main result, because output volume can increase review burden.
How can you separate tool impact from normal team changes?
Use matched cohorts and the same review period to separate tool impact from normal change. Compare adopting teams with similar teams that have not adopted the tool. Record staffing changes, major migrations, policy updates, and unusual incidents. State the limits of the analysis when several factors changed together.
Can Waydev measure release quality improvements?
Yes. Waydev connects delivery, quality, work-type, and AI adoption data for team and organization-level analysis. Leaders can use DORA and SPACE metrics alongside AI Checkpoints, Signals, and custom reports. That helps answer whether a tool improved release outcomes instead of merely showing that people used it.
Conclusion
Start with a fixed baseline and judge the tool against speed, stability, quality, and full cost. For a large engineering organization, use Waydev to connect those signals across the delivery pipeline, then run a matched-cohort review before expanding the investment. Set the next review date now, while the rollout details are still fresh.