Guide · Engineering Metrics
Lines of code and commit counts were never great measures of engineering work. In the AI era, they’re actively misleading. Here’s how modern teams measure what actually matters.
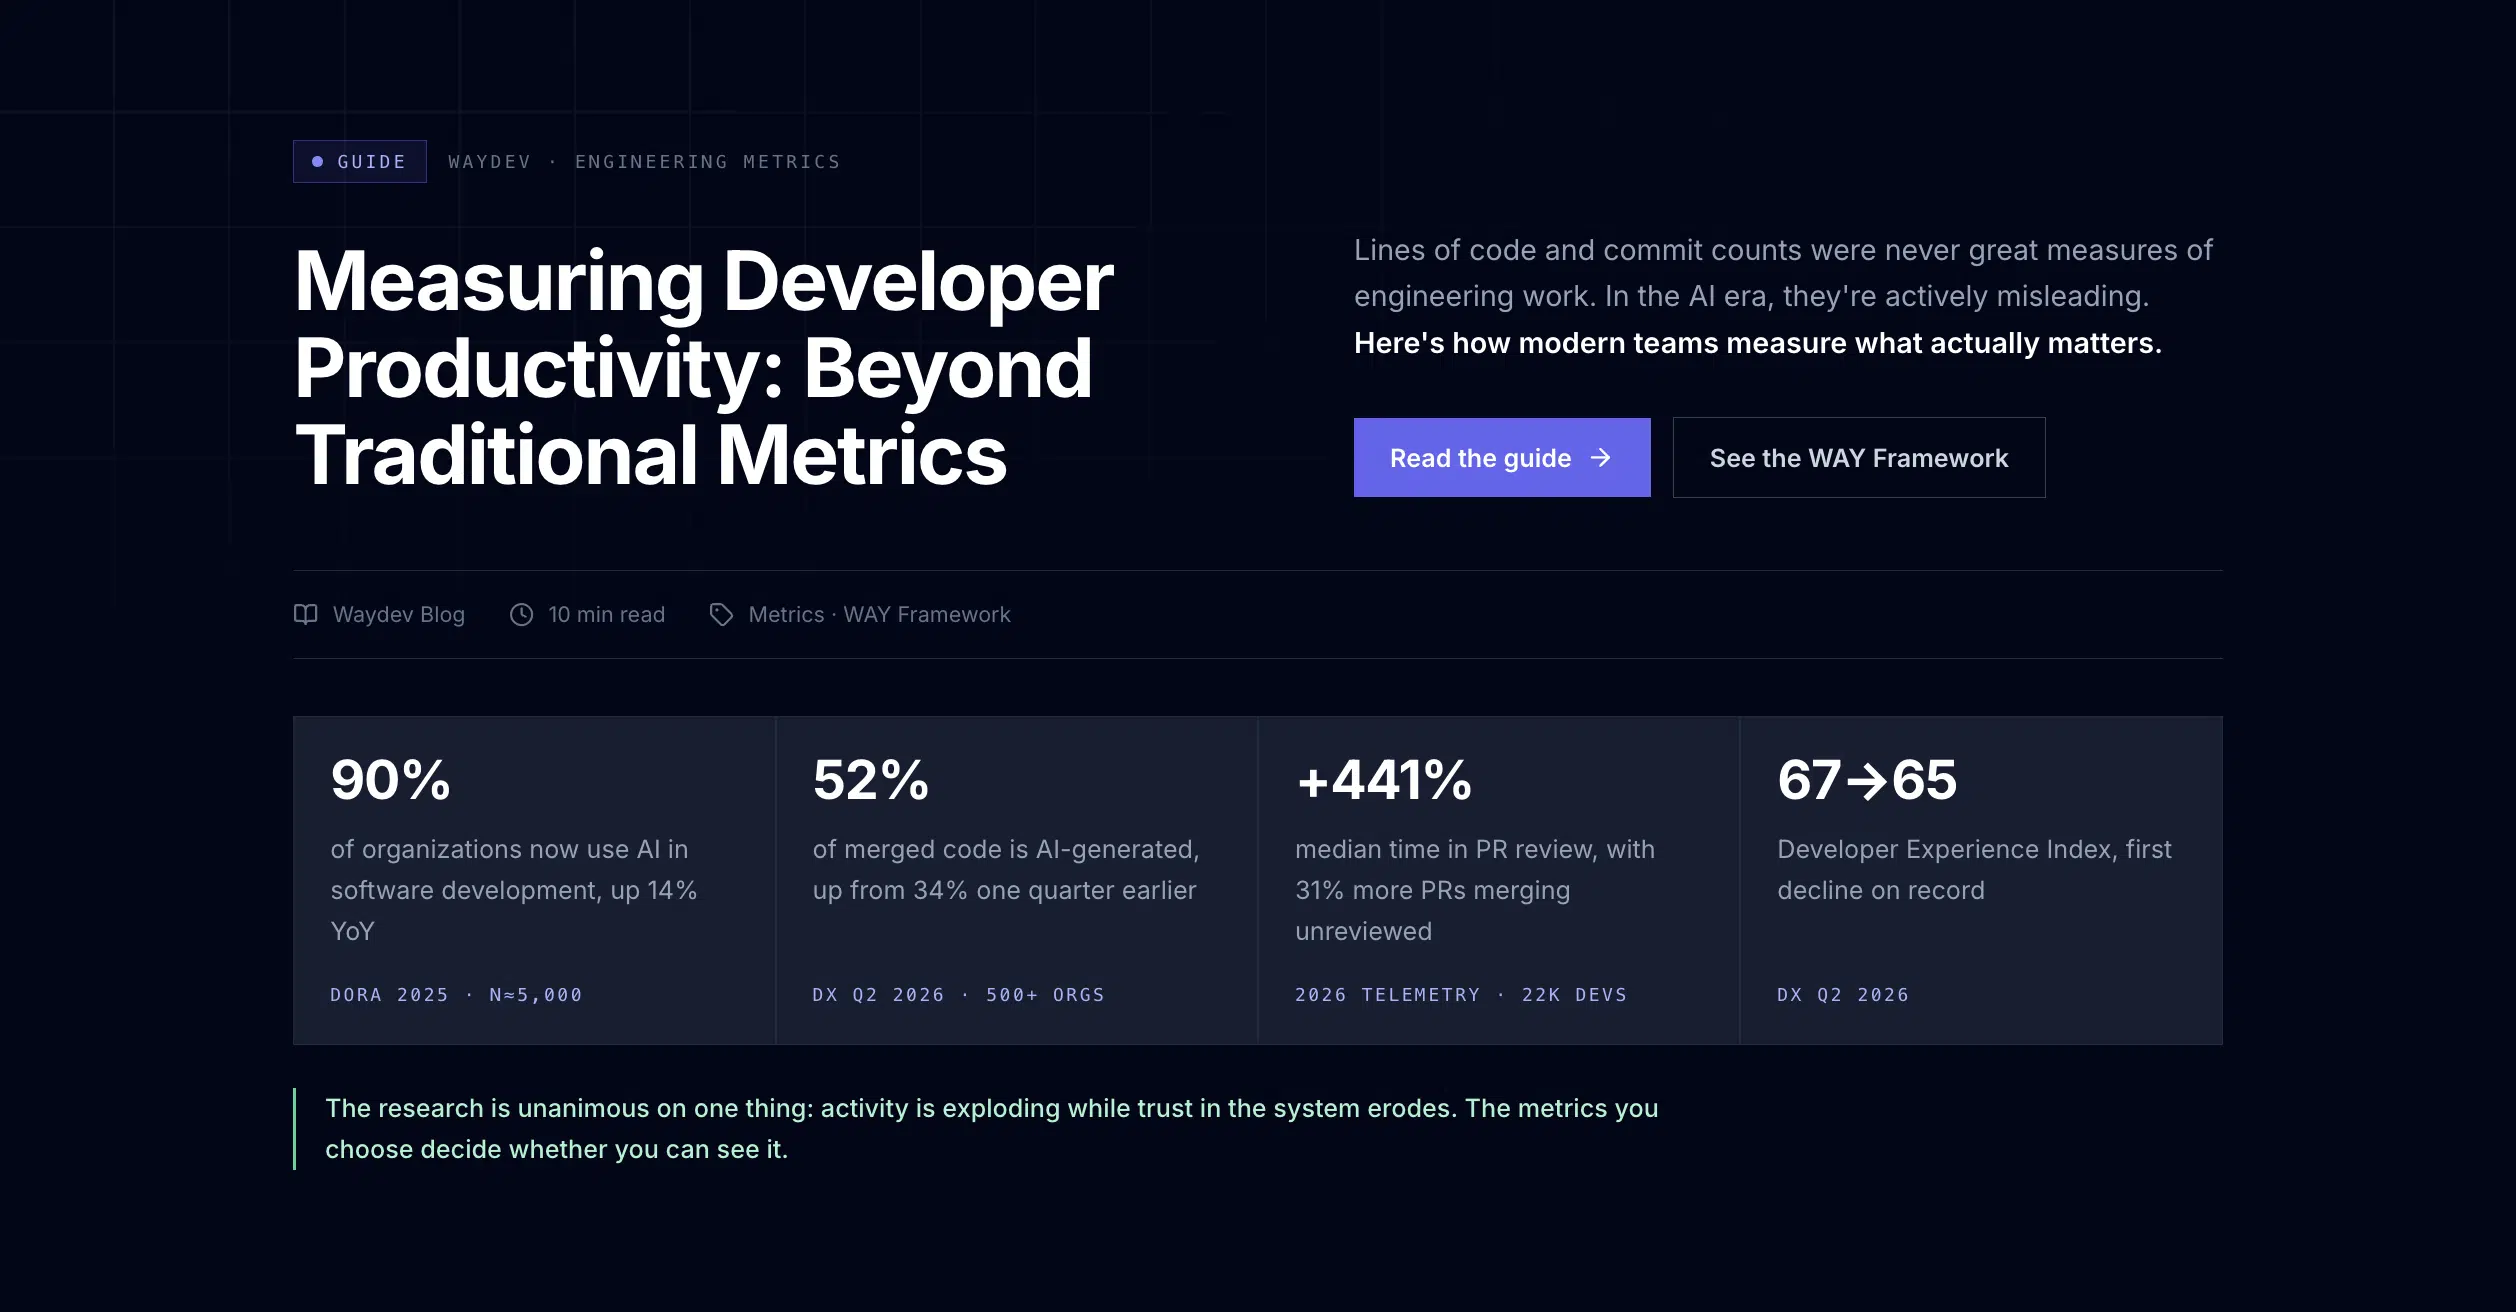
The research is unanimous on one thing: activity is exploding while trust in the system erodes. The metrics you choose decide whether you can see it.
For most of software engineering’s history, productivity measurement borrowed from the factory floor. If you can’t watch the work, count the output. Traditional developer productivity metrics grew from that instinct: lines of code written, commits pushed, pull requests merged, story points completed, velocity per sprint, hours logged.
These metrics became standard for a reason. They’re easy to collect, easy to chart, and easy to explain to a board. They give leaders a baseline where none existed, surface teams that are completely stalled, and create at least some shared vocabulary between engineering and the rest of the business. For capacity planning and spotting extreme outliers, they still have a role.
The problem is what happens when they become the goal. Every traditional metric measures activity, not outcomes, and activity is trivially gamed, by humans and now by machines:
Much of the research on this topic reaches the same conclusion. Google’s 2025 DORA report, drawing on nearly 5,000 technology professionals and over 100 hours of qualitative interviews, found that AI amplifies whatever system it lands in: strong teams get stronger, struggling teams struggle faster. Activity counts can’t see that difference. Even more striking, a 2025 randomized controlled trial by METR found that experienced developers were actually 19% slower when using AI assistants on familiar codebases, while believing they were about 20% faster. Perception, activity, and value are three different things, and traditional metrics only capture the middle one.
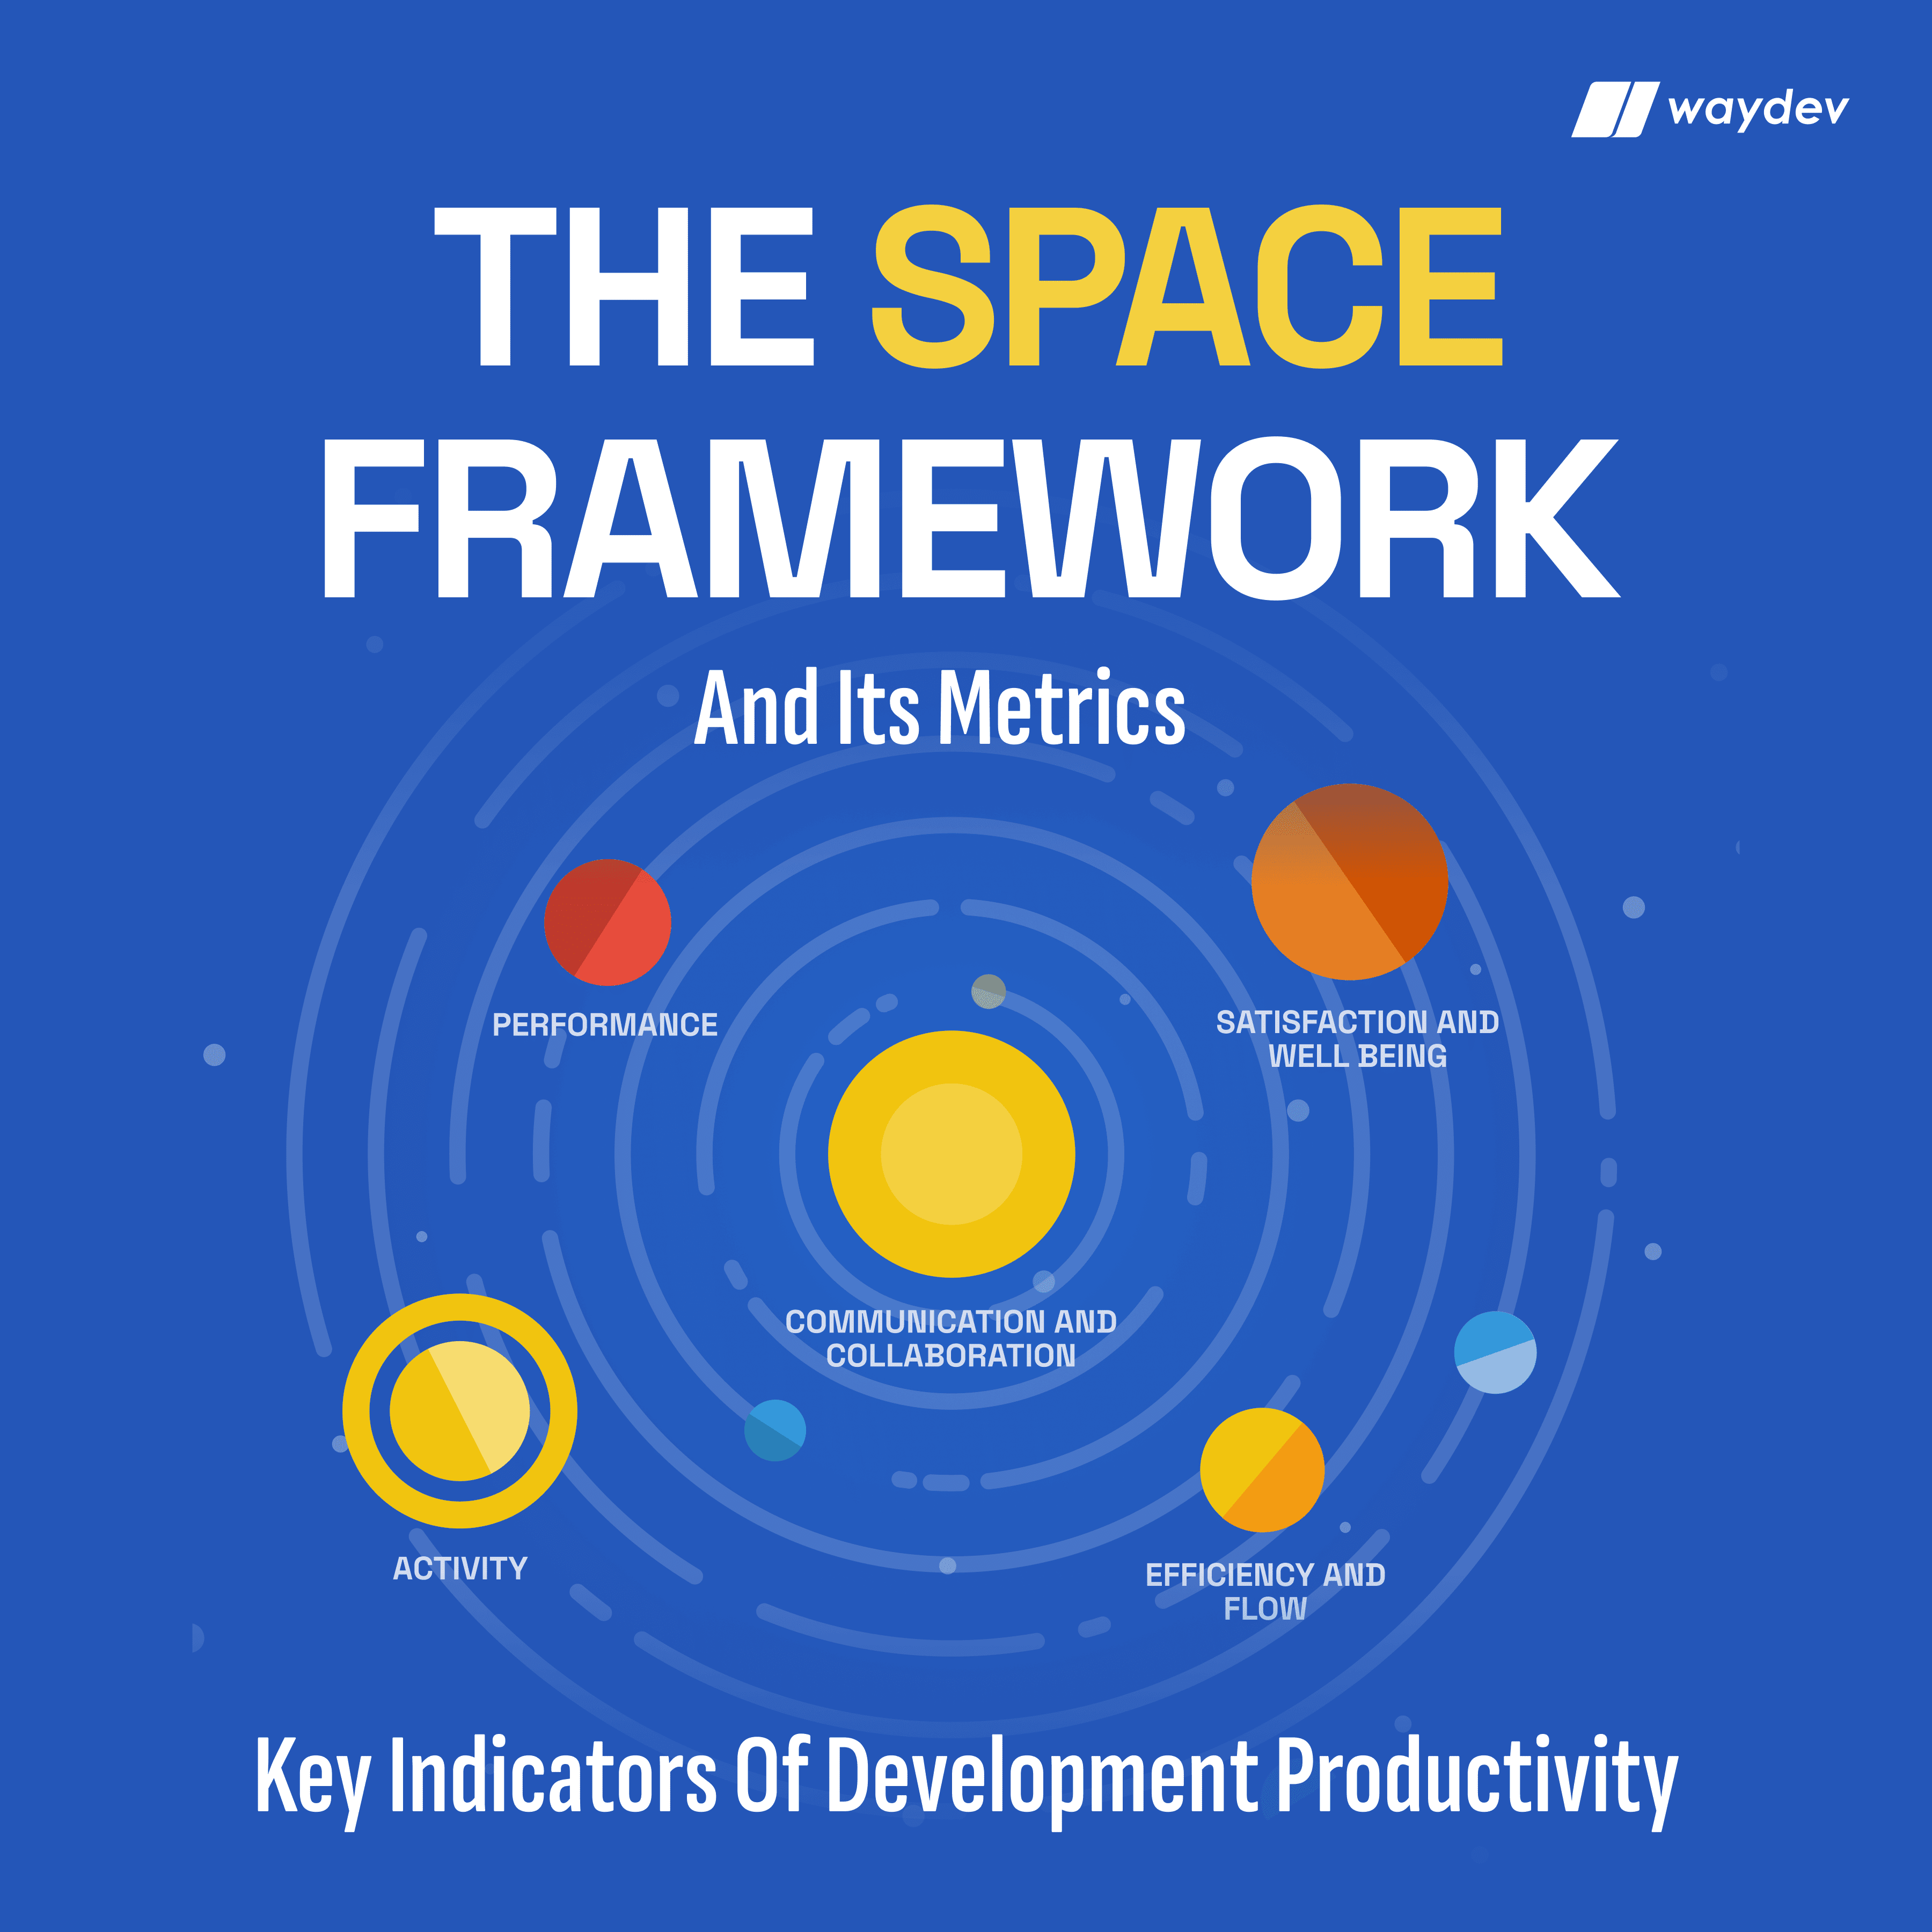
The research behind DORA and SPACE, and the industry conversation around developer experience, converges on one point: no single activity metric can represent something as multidimensional as engineering work. We’ve argued the same across the Waydev blog for years, including in our guides on DORA metrics and on building a shared AI measurement baseline. Counting output made some sense when humans typed every line. Now that they don’t, it makes almost none.
Modern measurement shifts the question from “how much did we produce” to “how well does our system turn effort into shipped value.” That reframing produces a different set of metrics:
The research explains why these system-level metrics matter more every quarter. DORA 2025 found that AI adoption now correlates positively with delivery throughput, a reversal from the prior year, but continues to correlate with delivery instability. In other words, teams learned to generate faster, but their pipelines haven’t evolved to absorb the volume. The 2026 telemetry data across 22,000 developers shows exactly where it breaks: median time in PR review is up 441%, PR size is up 51.3%, and 31% more PRs are merging with no review at all. Speed without stability instrumentation is just deferred incident cost.
Here’s how this plays out in practice. One pattern we see repeatedly in Waydev data: a team adopts an AI coding agent and raw output jumps 40%, but cycle time doesn’t move. Traditional metrics say the tool is working. The modern metrics show why nothing is shipping faster: review turnaround doubled because PRs got bigger and reviewers became the bottleneck. The fix wasn’t more AI. It was smaller PRs and a review SLA. Output metrics could never have found that; system metrics found it in a week.
Another real-world example comes from the broader industry research: one organization discovered that reducing unnecessary meetings produced roughly twice the throughput gains of AI tooling alone. Innovation ratio and cycle time surfaced that. Commit counts never would.
Every metric above is quantitative: it comes from the work itself, from Git, CI, and project systems. But numbers only tell you what is happening. They rarely tell you why. That’s the job of qualitative measurement: developer experience surveys, satisfaction scores, team morale signals, and structured feedback on friction.
| Dimension | Quantitative | Qualitative |
|---|---|---|
| What it captures | What happened: cycle time, deploy frequency, AI code survival, cost | Why it happened: friction, morale, cognitive load, tool sentiment |
| Source | The work itself (Git, CI/CD, PRs, tickets, AI agents) | The people (surveys, DevEx indices, retros, interviews) |
| Cadence | Continuous, real time | Periodic (quarterly surveys, pulse checks) |
| Failure mode | Gaming, measuring activity instead of outcomes | Survey fatigue, recency bias, small samples |
| Best used for | Finding bottlenecks, defending budgets, tracking trends | Explaining trends, catching burnout early, prioritizing fixes |
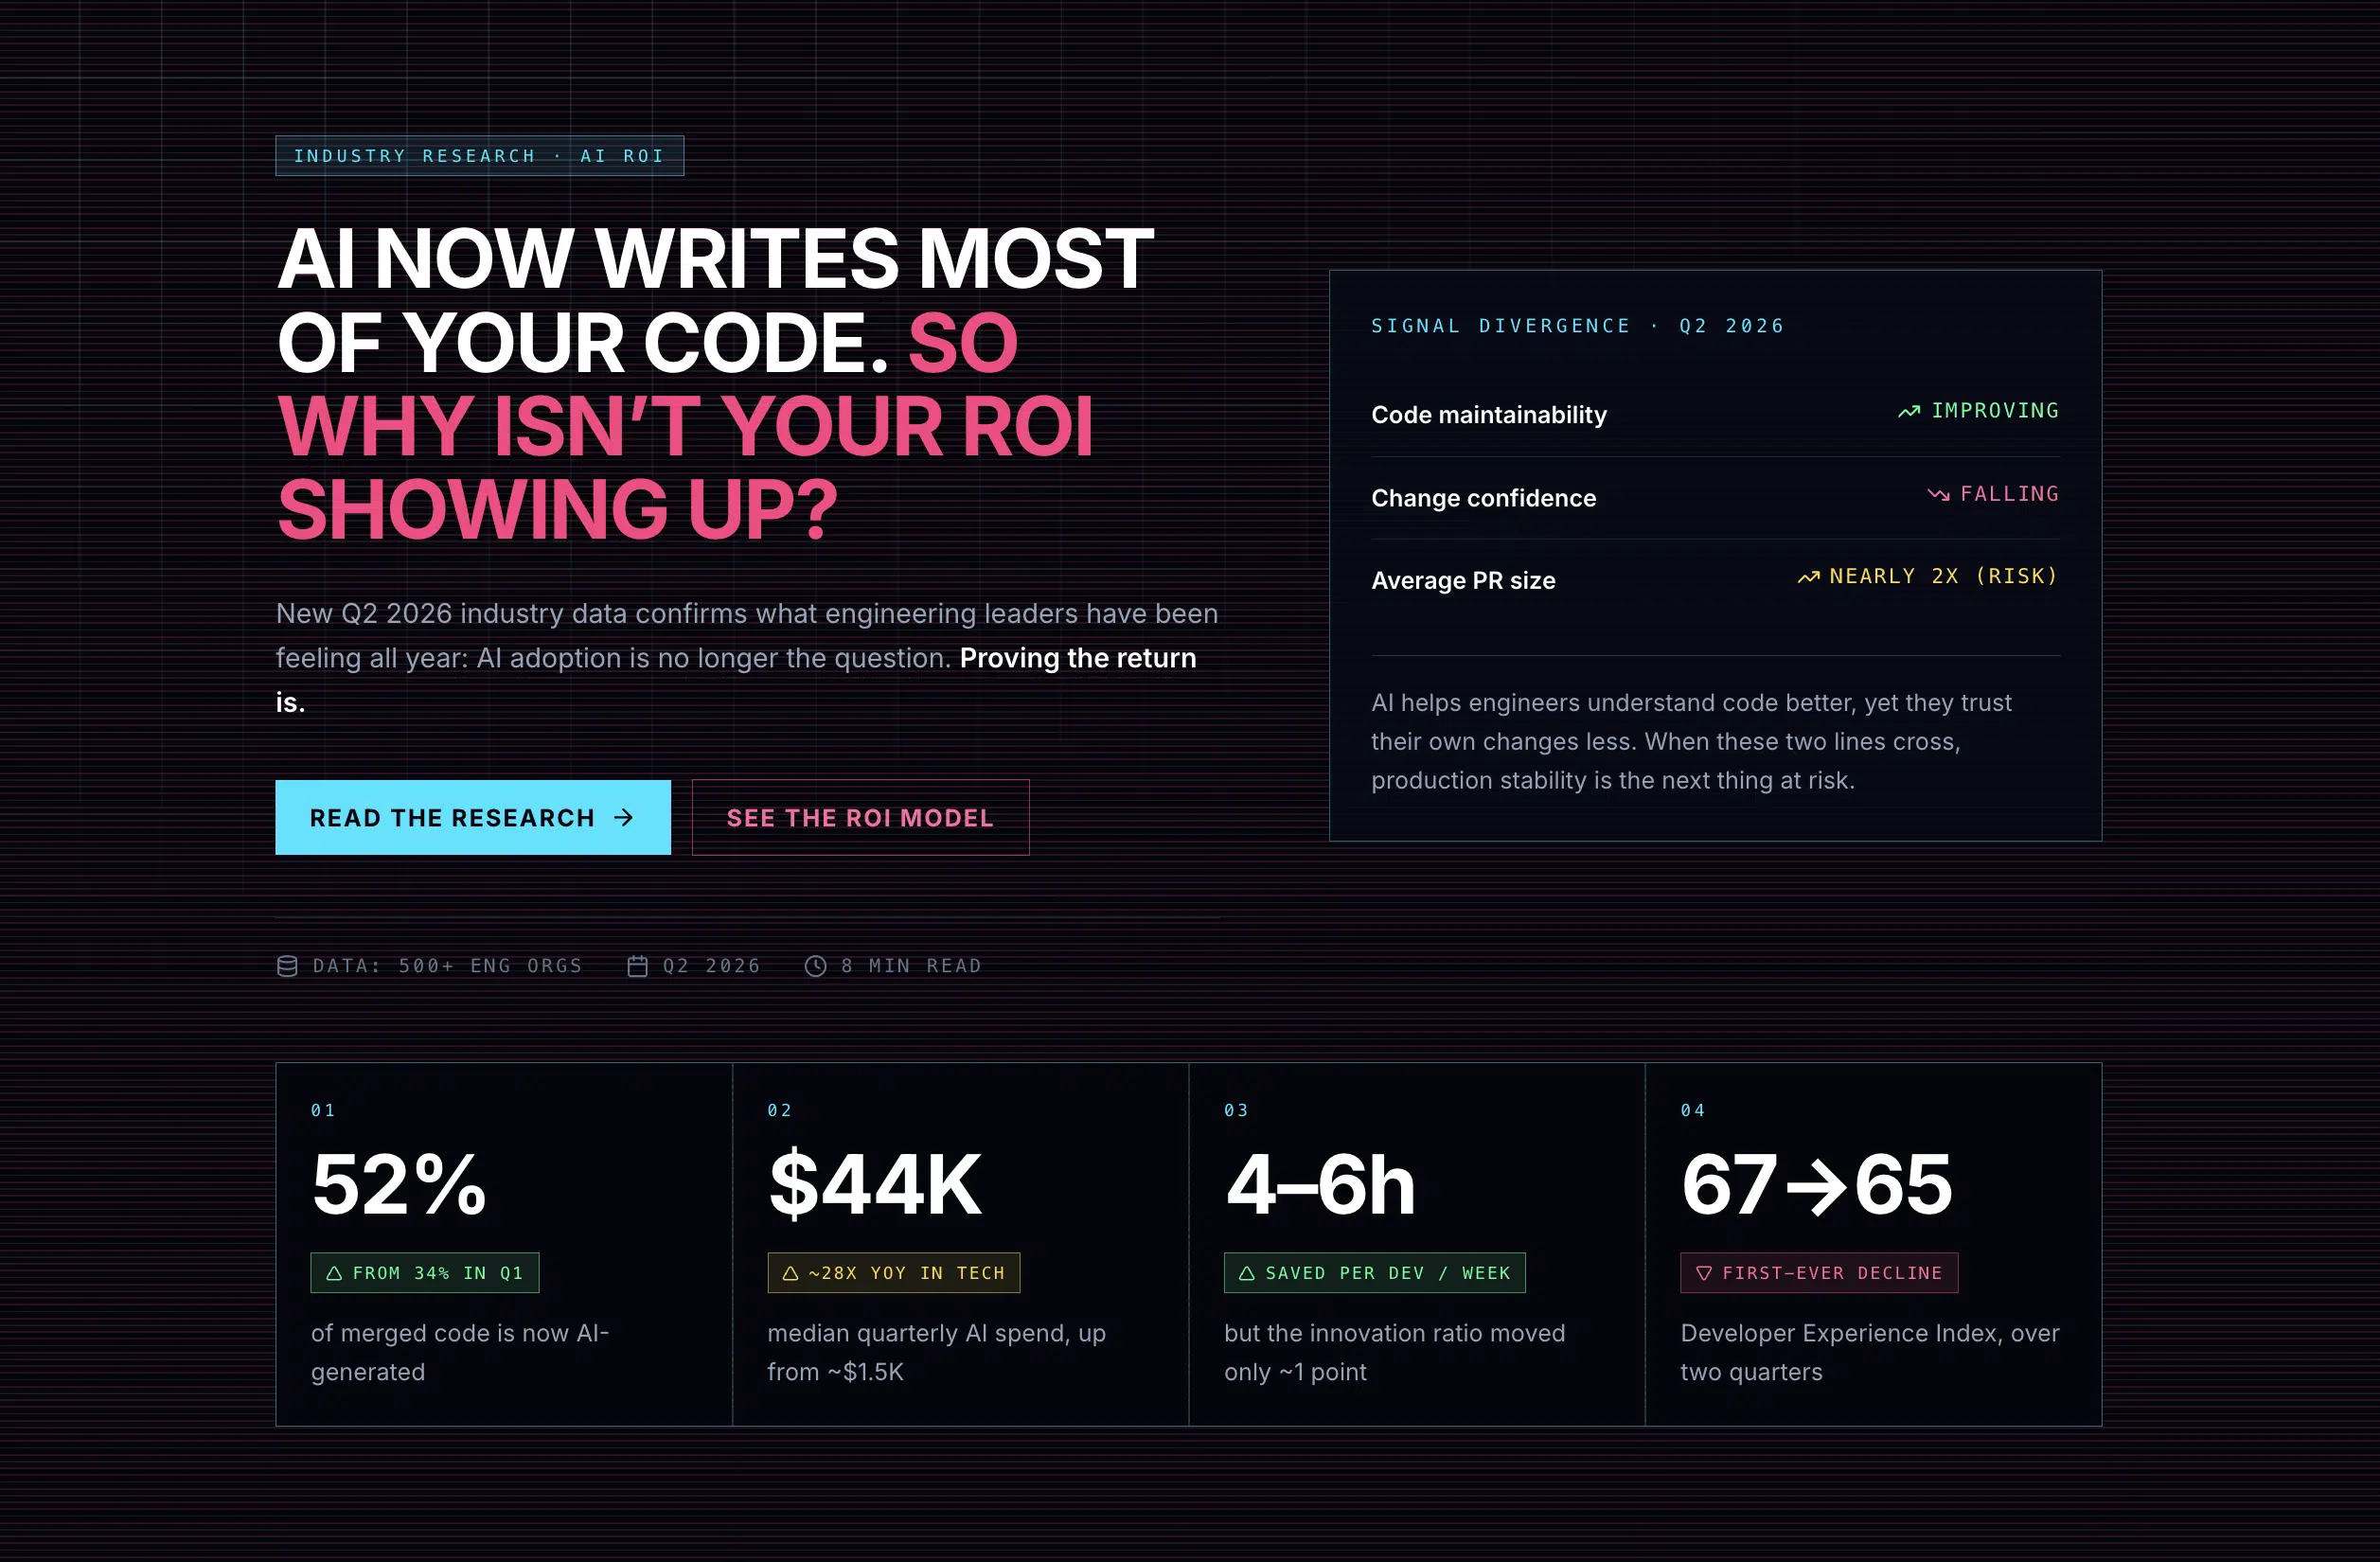
The strongest signal comes from combining them. This year’s industry data offers a perfect illustration: the aggregate Developer Experience Index declined for the first time on record, from 67 to 65, during the largest AI investment wave in history. Quantitative output is up and qualitative experience is down. Either signal alone paints a false picture. Together, they describe a system producing more while its people trust it less: larger PRs, heavier review loads, and falling change confidence.
When quantitative and qualitative signals diverge, that divergence is the finding. It’s usually the earliest warning you’ll get.
DORA’s 2025 findings sharpen the point. Across ten measured outcomes, higher AI adoption improved almost everything: individual effectiveness, throughput, code quality, organizational performance. The two things it did not improve were burnout and friction, which stayed flat. Machines are absorbing the typing; they are not absorbing the frustration. Only qualitative measurement can tell you where that frustration lives.
Teams that incorporate developer experience alongside delivery data consistently catch problems earlier: burnout that hasn’t yet hit cycle time, tooling frustration that hasn’t yet hit attrition, and confidence erosion that hasn’t yet hit production. This is why Waydev combines DORA, SPACE, and developer experience signals in one place rather than treating them as separate disciplines.
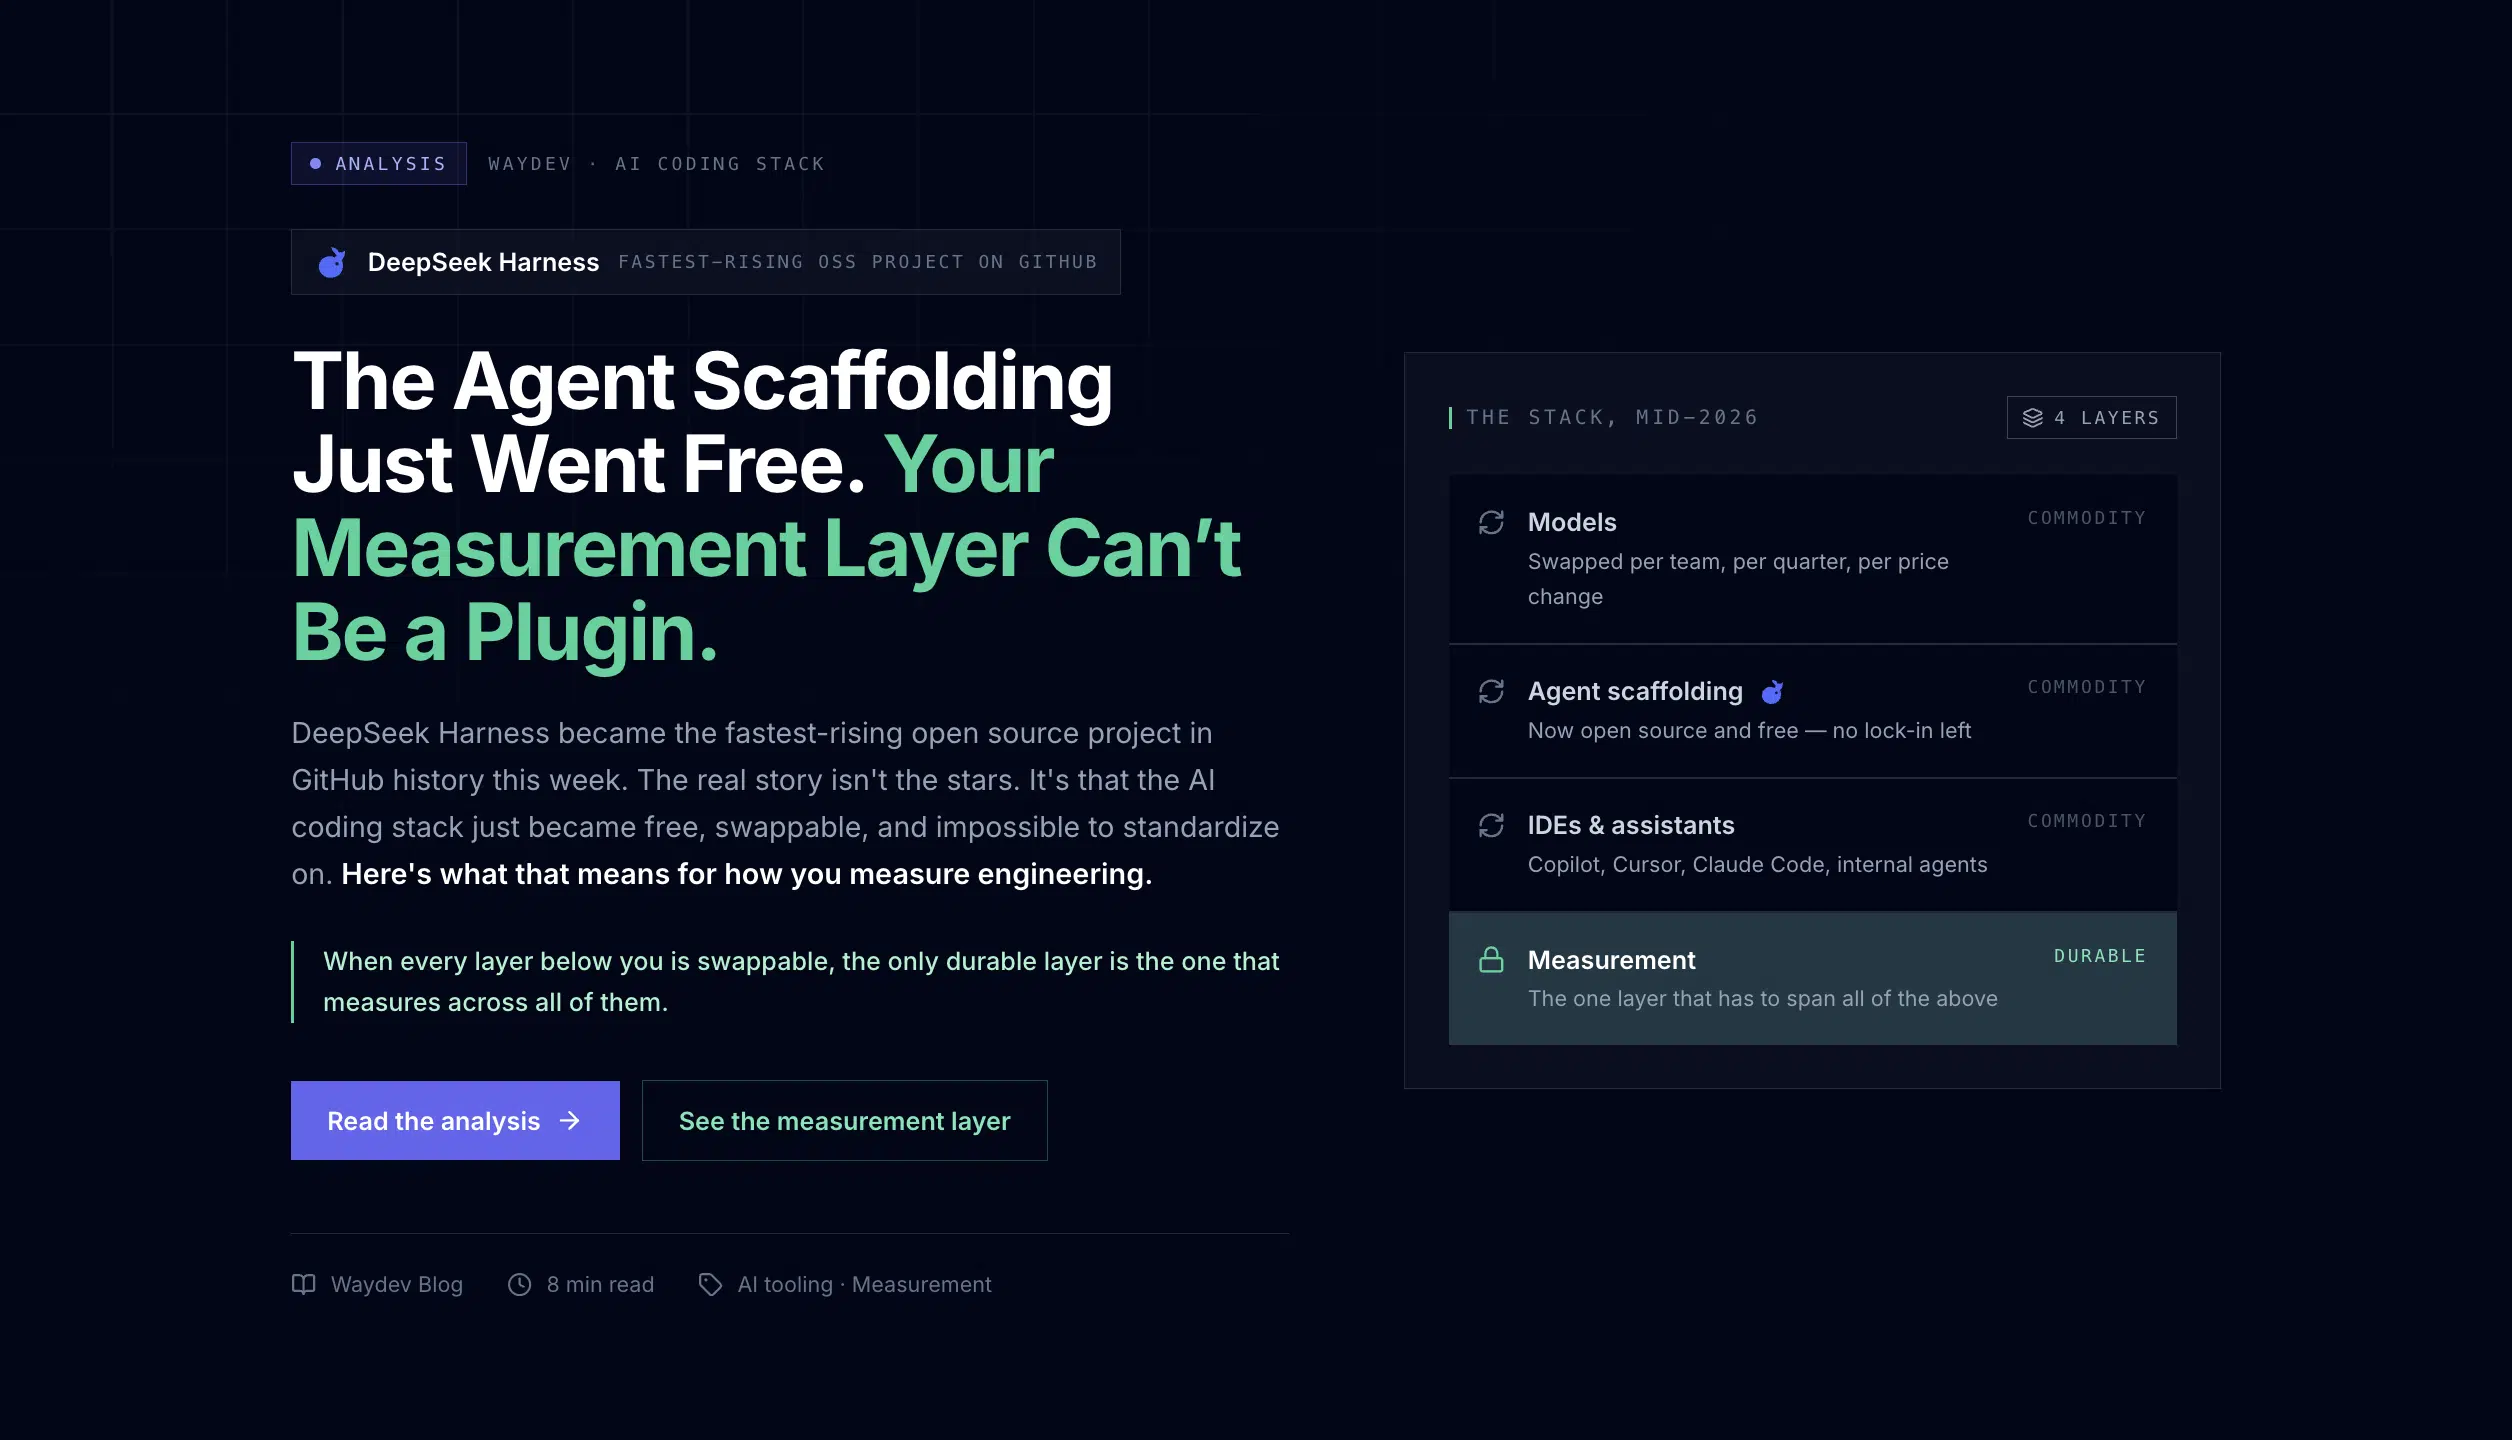
All of this research points to the same conclusion: the AI era needs a measurement philosophy, not another dashboard. DORA 2025 says AI success is a systems problem, not a tools problem. The DX data says gains evaporate in organizational friction. The 2026 review telemetry says the human verification layer is buckling. At Waydev, we distilled our answer into the WAY Framework, the set of principles behind how our platform measures engineering work:
WAY is also the lens that makes the qualitative-quantitative debate practical. Work-first data gives you the trend, human signals explain it, and because the record is agnostic and yours, the conclusion survives tool churn, vendor claims, and audit scrutiny alike.
Moving from traditional to modern measurement is as much a change-management problem as a data problem. Here’s the sequence we recommend to the engineering organizations we work with, with the WAY principles as the backbone:
The most common challenges in this shift are predictable. Teams fear surveillance, which step two addresses. Leaders miss the simplicity of a single velocity number, which step one addresses by replacing volume with relevance. And data lives scattered across Git, CI, ticketing, and AI tools, which is an integration problem, not a philosophy problem. The refinement path that works is always the same: narrow scope, prove value on one question, expand.
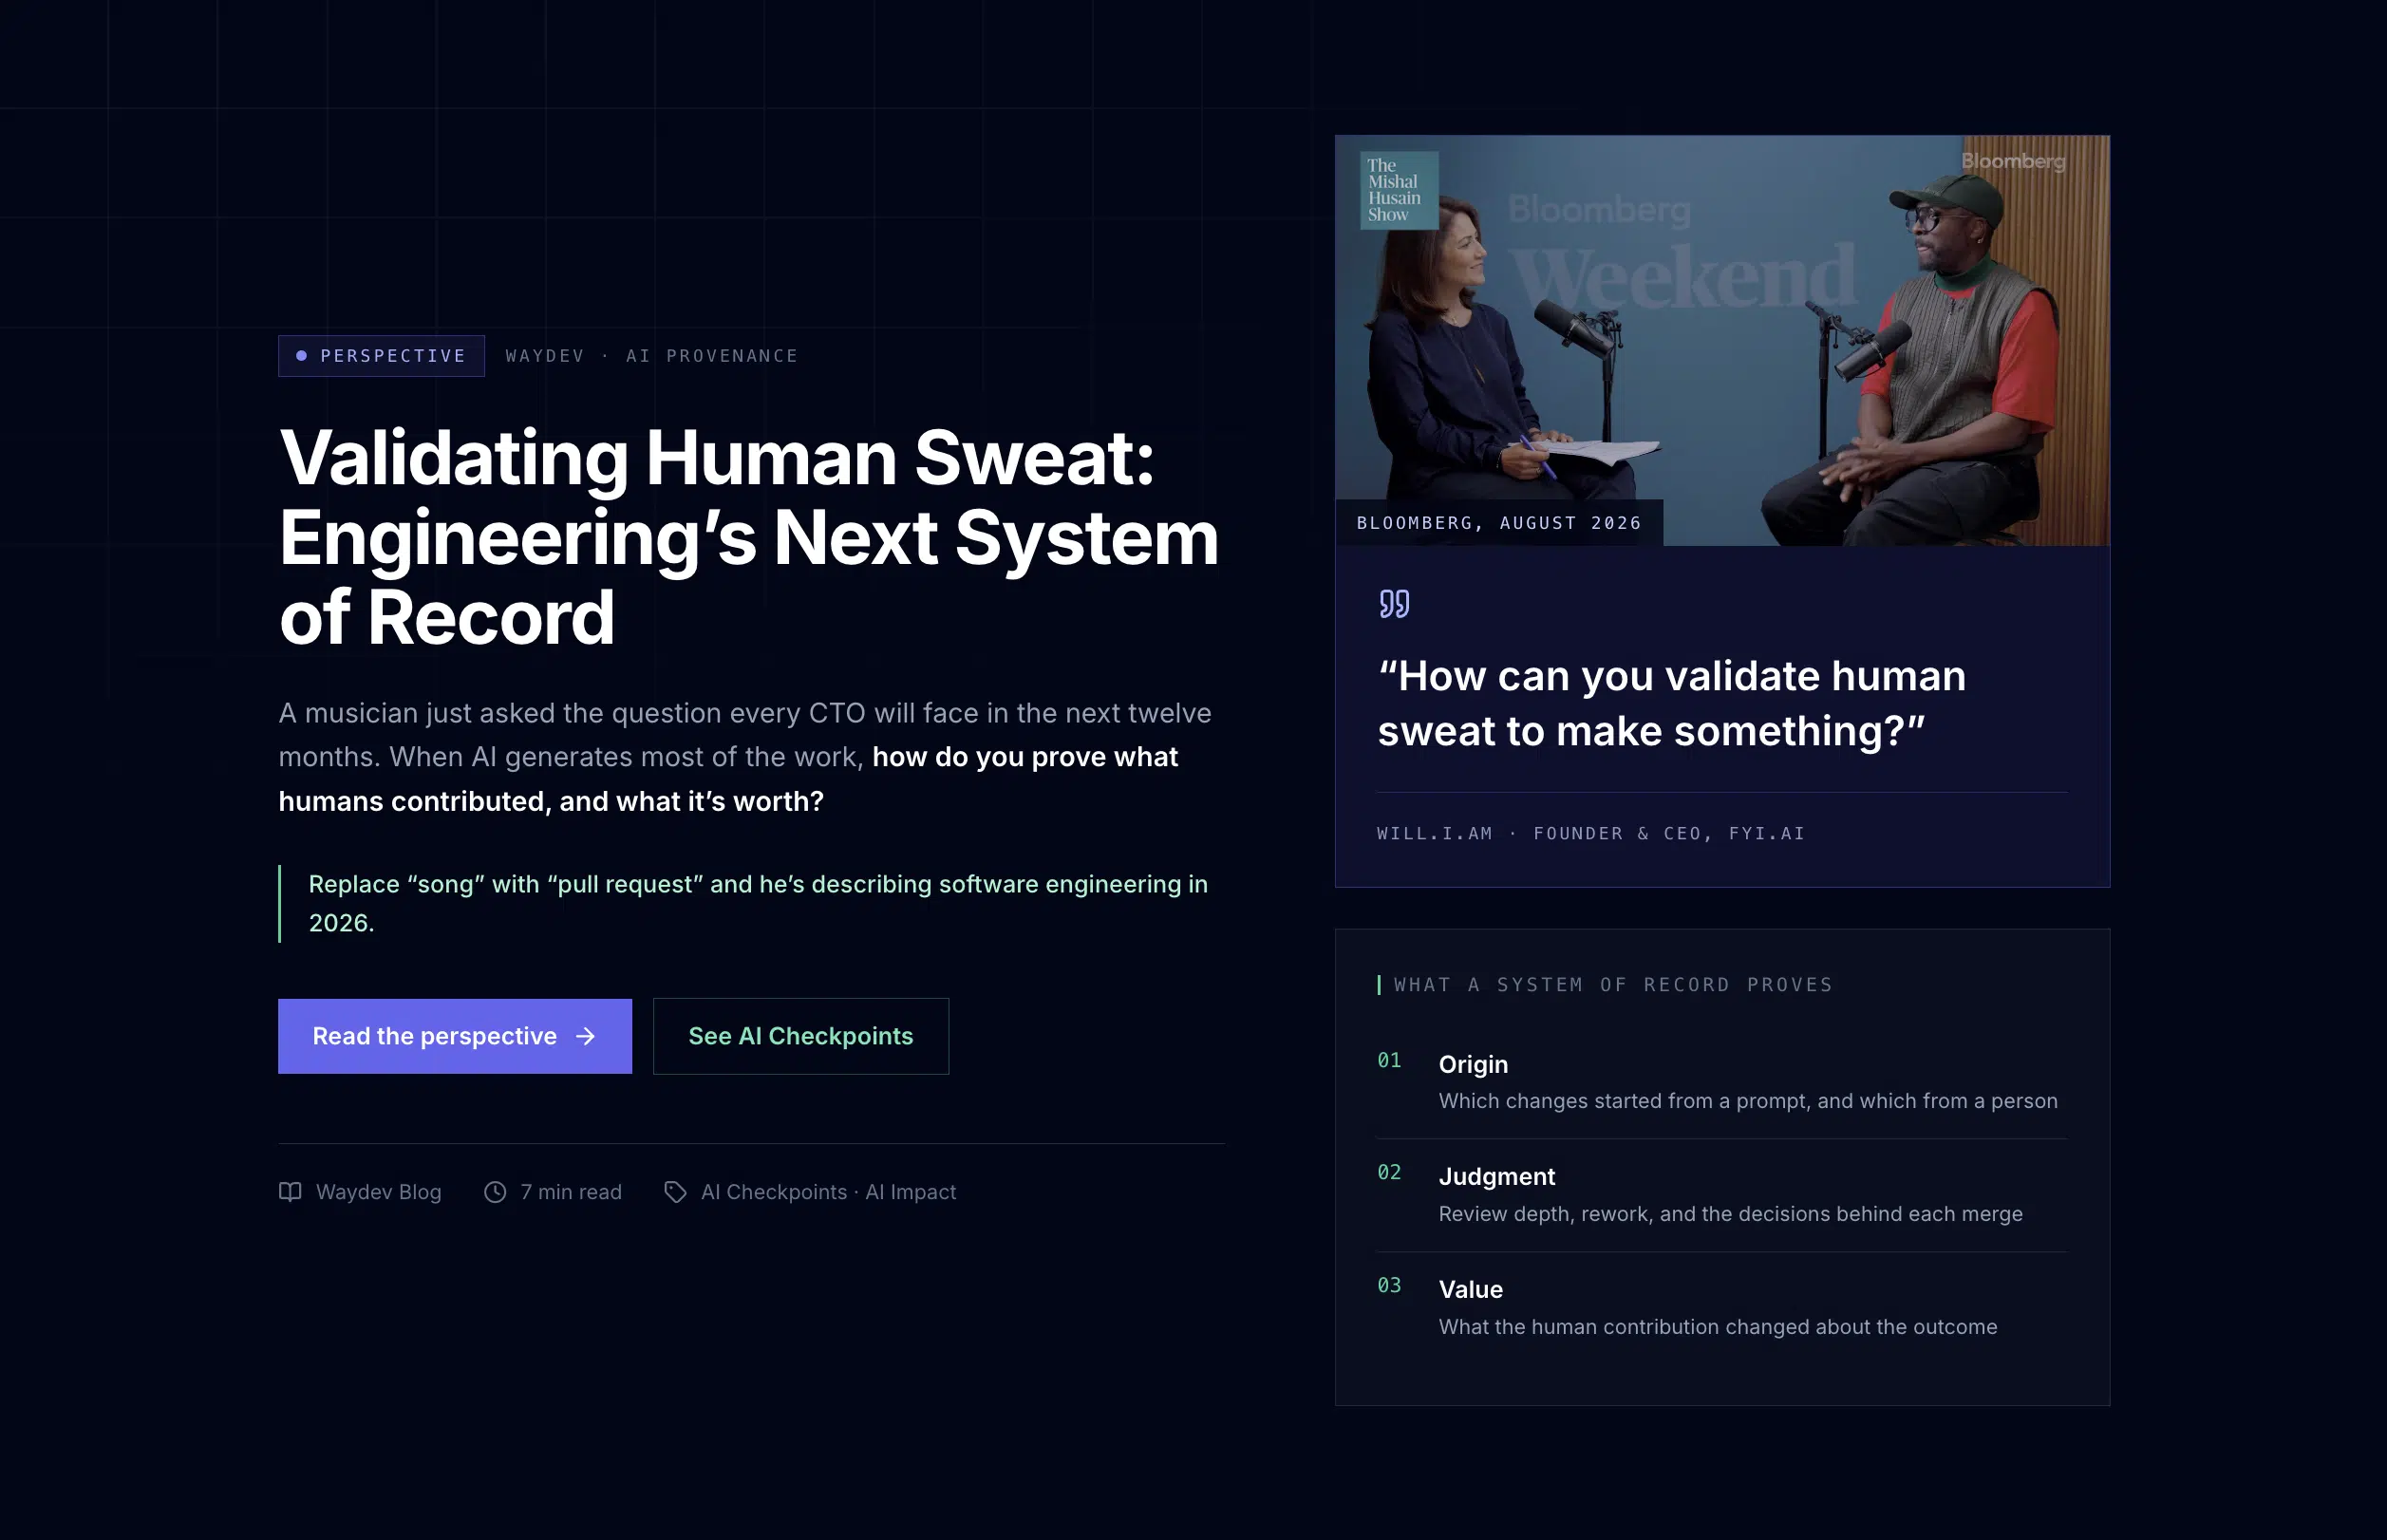
Measuring developer productivity was never really about counting what developers do. It’s about understanding whether your engineering system converts talent, time, and now tokens into value your customers receive. Traditional metrics counted the typing. Modern measurement watches the whole system, asks the people inside it, and in the AI era, keeps an auditable record of who and what contributed along the way.
Waydev combines DORA, developer experience, and AI adoption, impact, and ROI in one platform, measured on the work itself. See your real productivity picture in days, not quarters.
Book a demoSources: Google Cloud, 2025 DORA Report: State of AI-assisted Software Development (≈5,000 respondents); DX, State of AI Impact in Engineering, Q2 2026 (500+ organizations); Faros AI 2026 telemetry (22,000 developers); METR, 2025 randomized controlled trial on AI and developer productivity. Waydev scenarios are drawn from anonymized platform patterns.
Ready to unlock your SDLC productivity?