
Developer Experience refers to how developers feel about the tools and platforms they use to build, test, and deliver software. Measuring DX matters because it’s one of the clearest levers you have on productivity, quality, and retention, but it’s also easy to measure badly. Surveys alone give you a read on sentiment. They tell you a developer is frustrated, but not whether that frustration is showing up in the delivery data yet.
To get a complete picture, pair that sentiment data with software engineering metrics pulled from your actual tools: the repo, the CI/CD pipeline, the ticketing system. Together, they show whether the tools and workflows you’ve given developers are translating into real output, or just into more noise.
Waydev pulls DX-relevant metrics like deployment frequency, lead time for changes, and code churn directly from your engineering systems, alongside a Slack-based survey tool for the sentiment side. Used together, they give you a view of Developer Experience that isn’t just a once-a-quarter opinion poll.
The importance of DX in software development
Delivering software well requires the right tools, processes, and technology to take an idea from a business requirement to something a customer actually uses. How developers experience all of that, day to day, is what DX describes.
Giving developers tools that fit how they actually work, and workflows that don’t fight them at every step, has a direct effect on morale and output. Get it right and the effects compound.
A strong DX tends to show up as:
- Faster delivery of quality code, because less time is lost to friction
- More willingness to try better solutions instead of the fastest workaround
- Better collaboration between developers, which shows up as faster fixes when something breaks
9 essential metrics to measure Developer Experience
No single metric on this list tells the whole story on its own. Read in isolation, most of them are misleading. Read together, they show you where DX is actually breaking down.
Lines of Code (LOC)
Lines of code is a simple, quantitative count of how much code a developer writes, including comments and rewrites. It was never a quality metric on its own, and that’s even more true now: a large share of code in most repos is AI-suggested or AI-generated, so raw LOC increasingly measures how much a developer accepted, not how much they authored.
Used carefully, alongside other metrics, LOC can still surface trend changes worth investigating, like a sudden drop that might indicate someone is stuck. Used alone, it’s one of the easiest metrics to game and one of the least useful for judging DX.
Code Churn
Code churn measures how often recently written code gets modified again. Some churn is normal. Developers refine their own work, and a first draft rarely survives untouched.
Churn becomes a signal worth acting on when it’s consistently higher than the norm for a project. In the AI era, churn needs a second read: a human editing AI-suggested code within the same day is a healthy review pattern, not waste. The pattern to watch for is churn on already-reviewed and merged code, which usually means something got approved that shouldn’t have.
Commit Risk
Commit risk estimates how likely a given commit is to introduce a bug or other problem, functioning as an early quality signal rather than a post-release one. As more commits include AI-generated code, commit risk models are one of the more useful places to look for a leading indicator of whether AI-assisted output is holding up under real usage, not just passing review. Paired with a Merge Quality report, it’s a good check on whether faster output is coming at the cost of clean merges.
Impact
Impact measures the complexity of a code change well beyond what LOC can capture: how many files were touched, how severe the changes were, and how wide their surface area extends. It’s a closer proxy for how much a change actually moves the product forward, and tracking it over time can surface productivity issues that a simple commit count would miss entirely.
Activity
Activity tracking shows whether a developer is committing code regularly or going quiet for stretches at a time. It’s a useful early signal for blockers, but it needs more care now than it used to: AI-assisted coding can inflate raw commit counts without a corresponding increase in real progress. Pair activity data with review depth and impact, not with commit count alone.
Lead Time for Changes (LTTC)
Lead time for changes is one of the original DORA metrics: the time between committing code and getting it into production. That bottleneck has shifted in the last two years. It used to sit mostly in CI/CD and testing. Now, with AI agents producing a growing share of first-draft code, the slow point is increasingly the human verification step: reviewers reading, testing, and validating AI-generated changes before they’re comfortable merging them.
Automation and Collaboration
Automation reduces the manual burden on developers so their time goes toward harder problems instead of repetitive tasks. That still means CI/CD and automated testing, but it now also includes how well AI coding agents are integrated into the actual workflow, and how much of the review burden shows up in pull request insights, rather than bolted on as a separate tool developers have to context-switch into.
Velocity
Velocity reports show how many story points a team completes per sprint, and can help forecast future sprints. Velocity has always needed context to be useful. That’s more true now, since AI-assisted work can shift how teams size and estimate tickets in ways that make sprint-over-sprint comparisons less reliable if the estimation process itself hasn’t adapted.
Deployment Frequency (DF)
Deployment frequency measures how often your team successfully ships to production, and it’s long been one of the clearest single indicators of delivery health.
For a decade, DORA’s research gave the industry a shared external benchmark for this: elite teams deploy multiple times a day, lower performers deploy monthly or less. That framing is worth using with more care today.
twelve years of an annual public benchmark, then a pause. no fresh external dataset arrives this year.
DORA’s 2025 report retired the four-tier elite-to-low model in favor of seven performance archetypes that combine delivery and human factors, and in 2026 DORA paused its annual public survey entirely. That doesn’t make deployment frequency less useful. It makes your own trend line, tracked on your own DORA metrics dashboard, more important than the external comparison. For the fuller argument on what this means for the four keys specifically, see DORA metrics in the AI era.
What AI changes about measuring DX
The metrics above still work. What’s changed is that several of them can no longer be read the same way they were even two years ago, because a meaningful share of the code and commits behind them didn’t originate with a human typing at a keyboard.
Conflating AI adoption with AI impact is how organizations end up rewarding AI usage instead of outcomes.
A team that’s using AI tools heavily isn’t necessarily shipping better or faster. Waydev measures these as three separate layers, a model laid out in full in our playbook on measuring AI adoption, impact, and ROI:
This is also why an external, single-vendor DX scorecard is worth being cautious about. Frameworks like DORA and SPACE are portable because no single company owns their definitions. Proprietary scoring systems tied to one platform can lock your team’s vocabulary to that vendor. Waydev’s WAY Framework is built to combine DORA, SPACE, and Core 4 style thinking without introducing another proprietary index on top of them, and pairs with a Benchmark view so your DX metrics stay something you can explain and defend without needing a login to any one tool.
Optimizing Developer Experience
Developer Experience is worth the attention because it’s directly tied to retention and output in an industry where both are expensive to lose. A few practices consistently move it in the right direction:
- Give developers the right tools. Project management tools and IDEs, and increasingly, well-integrated AI coding assistants that fit the existing workflow instead of adding a second one.
- Invest in growth and training, especially around new AI tooling, so developers keep pace with a fast-changing stack instead of learning it ad hoc under deadline pressure. Our engineering leaders handbook covers this in more depth.
- Build a collaborative environment where communication is easy and decisions don’t get stuck waiting on one person.
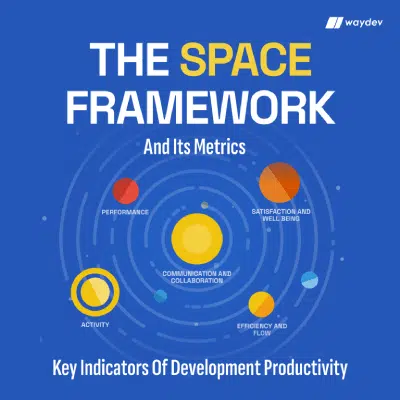
- Track the metrics above continuously, not as a one-time audit, and read them in combination rather than individually. See our DX best practices, DORA Metrics Playbook, and SPACE Framework Playbook for the fuller versions of each.
Schedule a demo
See how Waydev tracks these metrics, separates AI adoption from AI impact, and helps you build a DX baseline that’s yours to keep, no matter what happens to any single industry benchmark.
Request a demo