Managing large teams is hard. The amount of activity is overwhelming. But, great engineering managers can solve these challenges by knowing what to measure – the software development metrics.
By getting a crystal-clear picture of the delivery process from idea to production, looking at what and how it was built, you can spot bottlenecks or process issues that, once cleared, increase the overall health and capacity of your engineering team.
That’s why development analytics platforms are becoming more and more essential to effective processes and data-driven teams.
Waydev, for example, analyzes your codebase, PRs and tickets to help you bring out the best in your engineers’ work. By automatically measuring performance, our dev analytics tool helps you to improve efficiencies, reduce cycle time, and increase development velocity.
In this guide, we’ll share what software development metrics to measure and how to use analytics to track development processes for better performance + as well as 15 process metrics examples for engineering teams to guide your process.

There are different types of software metrics used in software companies: code, productivity, quality and testing, and even customer satisfaction metrics. In addition to traditional metrics, agile metrics focus on outcomes such as story points completed and customer satisfaction, providing a more comprehensive view of development progress.
Oftentimes, engineering managers and tech leaders look at more sets of specific metrics – you can see which ones in our 40+ examples of engineering KPIs and metrics.
Most are software development performance metrics – or progress metrics – that measure key aspects of software. Within the right context, they help managers follow the progress and alignment of work with business initiatives.
They provide an accurate overview of key aspects of development: resource allocation, project planning and management, quality assurance, debugging, maintenance, performance. Nonetheless, they can also speak about****engineers’ performance, work trends, and patterns.
Let’s take daily standups – they’re great as check-ins to see the status of a sprint or the work in progress. With Waydev, you can run even more productive daily stand-ups. By tracking the commit and pull request activity, and velocity sprint over sprint, you spot roadblocks and work dynamics quicker. Then, you can start conversations on collaborative solutions to those issues.
That is why software engineering metrics – and analytics of the development process – are essential in tracking and improving the performance and quality of the software development process.
Waydev helps engineering managers ensure code quality and real-time access to practical insights into the entire development process. See how it works here.
Using data across the development life cycle is one important way to enable your software development team to innovate and grow, and the software to perform better.
A good starting point is comparing your team’s recent sprint against the previous one. This can also bring up an essential question: What do software developer performance metrics usually look like for an engineering team like mine?
Managers need to take a look at the team’s baseline data, in order to understand the starting point. And then, to experiment with the workflows and processes and notice trends.
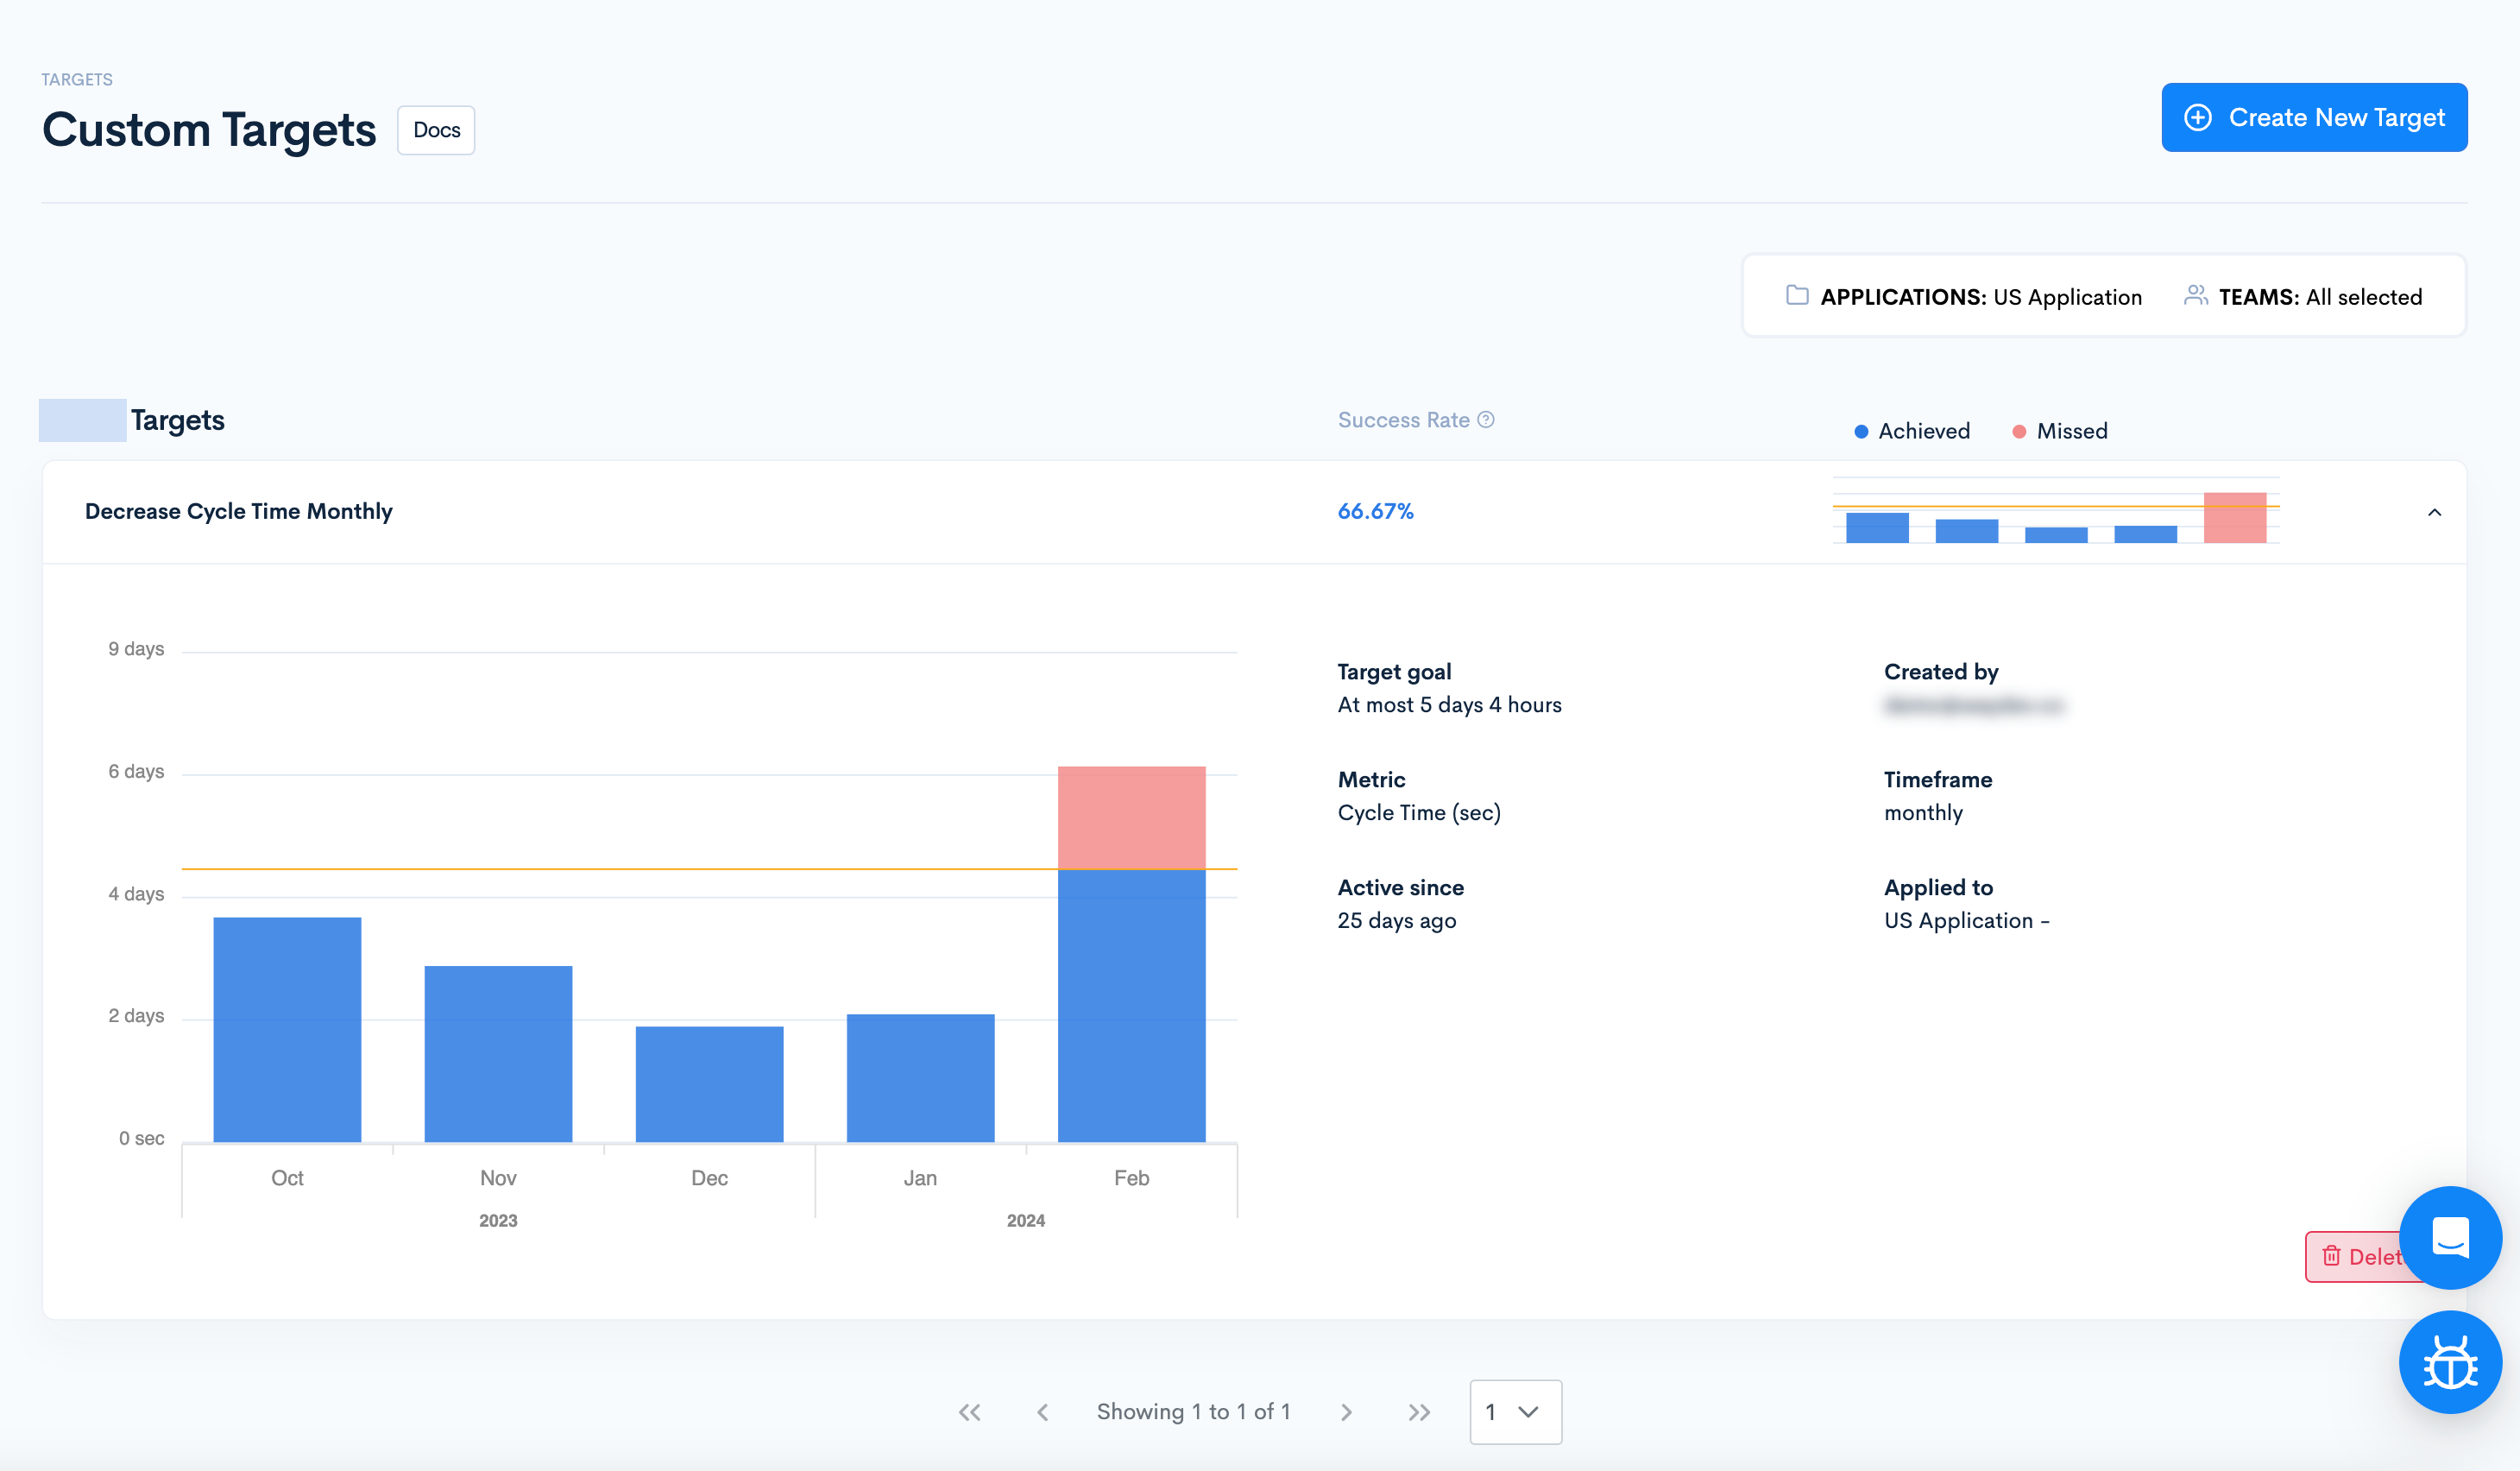
This can be more easily done by looking into certain process metrics that measure the development process, such as those in the Waydev’s Project Timeline feature (we’ll get to that in the examples section).
To elaborate, leaders use software development metrics:

Before diving into the software developer productivity metrics examples, let’s first see how you can best decide on which ones to use for effective management.
Developers shouldn’t be burdened with performance reporting. On the contrary, they should feel supported in their work and have the right processes in place to progress and deliver quality software.
Here comes the development analytics’ role. With Waydev, for example, you can access real-time data and automatic reports on performance. You can set, track, measure and visualize metrics, KPIs and reports that are relevant to your team, without their manual input – which save you time and boost the well-being of your engineers.
Waydev is already helping over 1,000 engineering leaders track development processes and deliver better products faster. Learn how it works.
Leading tech organizations across the globe use metrics to support the setting and achieving of their engineering goals and OKRs. After all, it’s about what you want to achieve and how you’ll measure the success of it.
What’s more, software developers feel the best when they work with hard data, concrete targets, and measurable results. That is why software engineering metrics – and analytics of the development process – are essential in tracking and improving the performance and quality of software development.
Waydev helps you measure organization-level efficiencies to start optimizing your development process. You can track software metrics that measure vital aspects of quality development projects – reliability, performance, security, maintainability to name a few.
We emphasize the importance of deciding on key metrics for software development – or any measurements – that help you spot and analyze trends and work patterns. Agile teams use these metrics to enhance decision-making and planning, ensuring that their efforts are aligned with project goals. It is not the numbers per se that are useful, but what insights they reveal in a certain context, over a certain period of time
It is the process, the direction of the developers’ efforts, the velocity and the impact of improvements along the way, that matter to the quality and delivery of software projects.
We’ve talked about metrics being easy to measure, linked to goals, and insightful. This has to be done over a specific time period, in order for managers to be able to implement incremental improvements and see their impact.
So, another key aspect to consider is to measure these process metrics over short periods. For example, from one sprint to another or any agile data-driven approach.
This leaves room for work iterations and changes that allow for more releases, more stable software, less expensive troubleshooting, and higher customer satisfaction, to name a few.
Working remotely? Waydev can help. Learn how to gain visibility into your engineering team’s activity with Waydev’s features and software metrics
As we emphasized before, software development metrics mean different things to different teams, since they depend on the context of organizational goals and team OKRs.
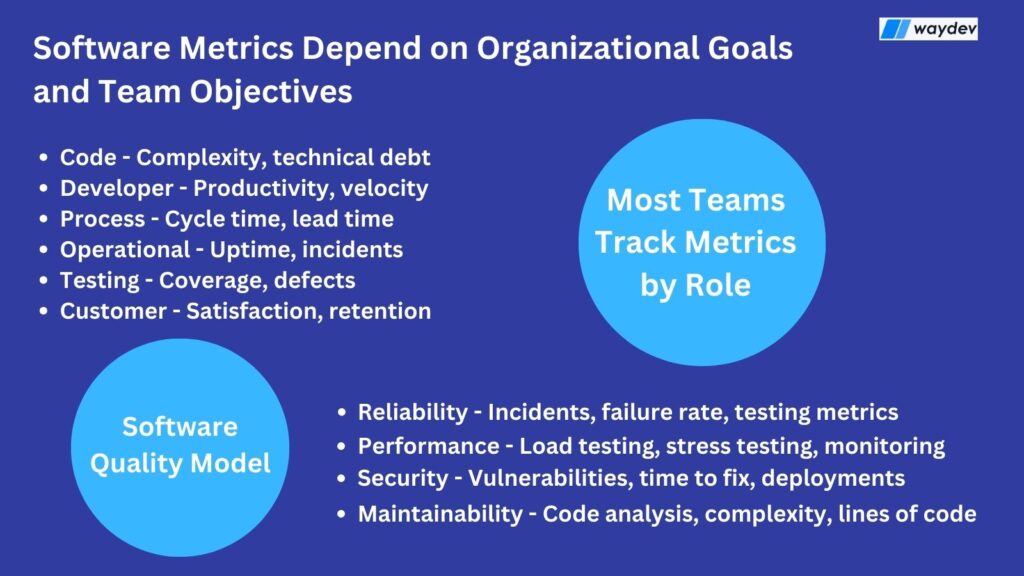
You will find classifications depending on role, function or model. The following examples of process metrics are based on the Consortium for IT Software Quality model (CISQ):
The majority of these software development metrics are hard to quantify and have to be taken into a specific context, as they need help to provide the full picture.
Most development teams measure process metrics based on their role or function, such as code metrics, developer productivity metrics, agile process metrics, operational metrics, test metrics, even customer satisfaction metrics.
At Waydev, we aim to track metrics based on what usually engineering teams and managers need. This is what we’ll try to show you with the next examples.
Here are a few examples of software quality metrics that measure the development process and software performance in engineering. You can automatically measure these software metrics with our dev analytics tool.
These process metrics and sets of agile metrics can help you measure the quality of the software deployment. These metrics help ensure that the team is shipping quality software features efficiently, meeting user needs and expectations. They track the progress of a software development team in producing functional, high-quality features ready to be shipped.
The Lead Time metric measures how much time passes between task creation and work completion. It gives you a larger perspective on how long it takes for a client’s requested feature to be completed.
It can help you identify potential issues that happen between task creation and the moment a developer starts working on it, to understand if you follow an Agile methodology.
You can identify and unblock those issues that can lead to friction and frustration for end-users (or customers). Consider this a “user point of view”.
The Cycle Time metric measures the time spent on starting and completing a task. It is important in assessing an organization’s development velocity.
It is actually composed of several Agile process metrics corresponding to a stage in the software development process: coding, pickup, review, deploy:
You May Also Like: Lead Time vs. Cycle Time in Software Development
It gives you an overview of the types of work in which your team is spending effort. Knowing when there are unusual churn spikes or code blockers can help you quickly address these issues – for example, if a development timeline needs to be pushed out an iteration or two.
In Waydev, check these metrics that indicate the types of work engineers focus on:
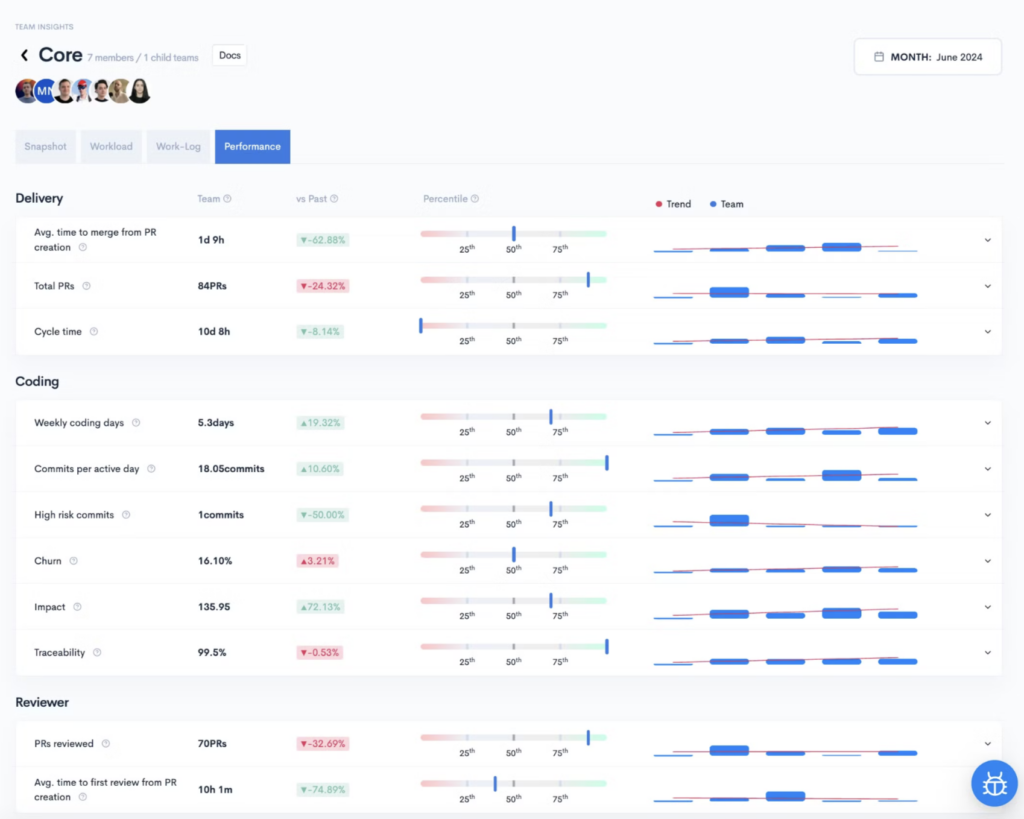
A Project Timeline report shows you the most actionable metrics in code-based activity. It helps engineering leaders see what their teams are working on during a sprint, over a week, a month, or a custom time frame.
This is an aggregation of multiple software metrics, such as:
When you look at these process metrics, you can see if the results are aligned with what you’d expect, relative to prior periods and current priorities. Depending on the situation, it might mean it’s possible for the team to build better features faster or, on the contrary, to ask for additional resources, or adjust the delivery dates.
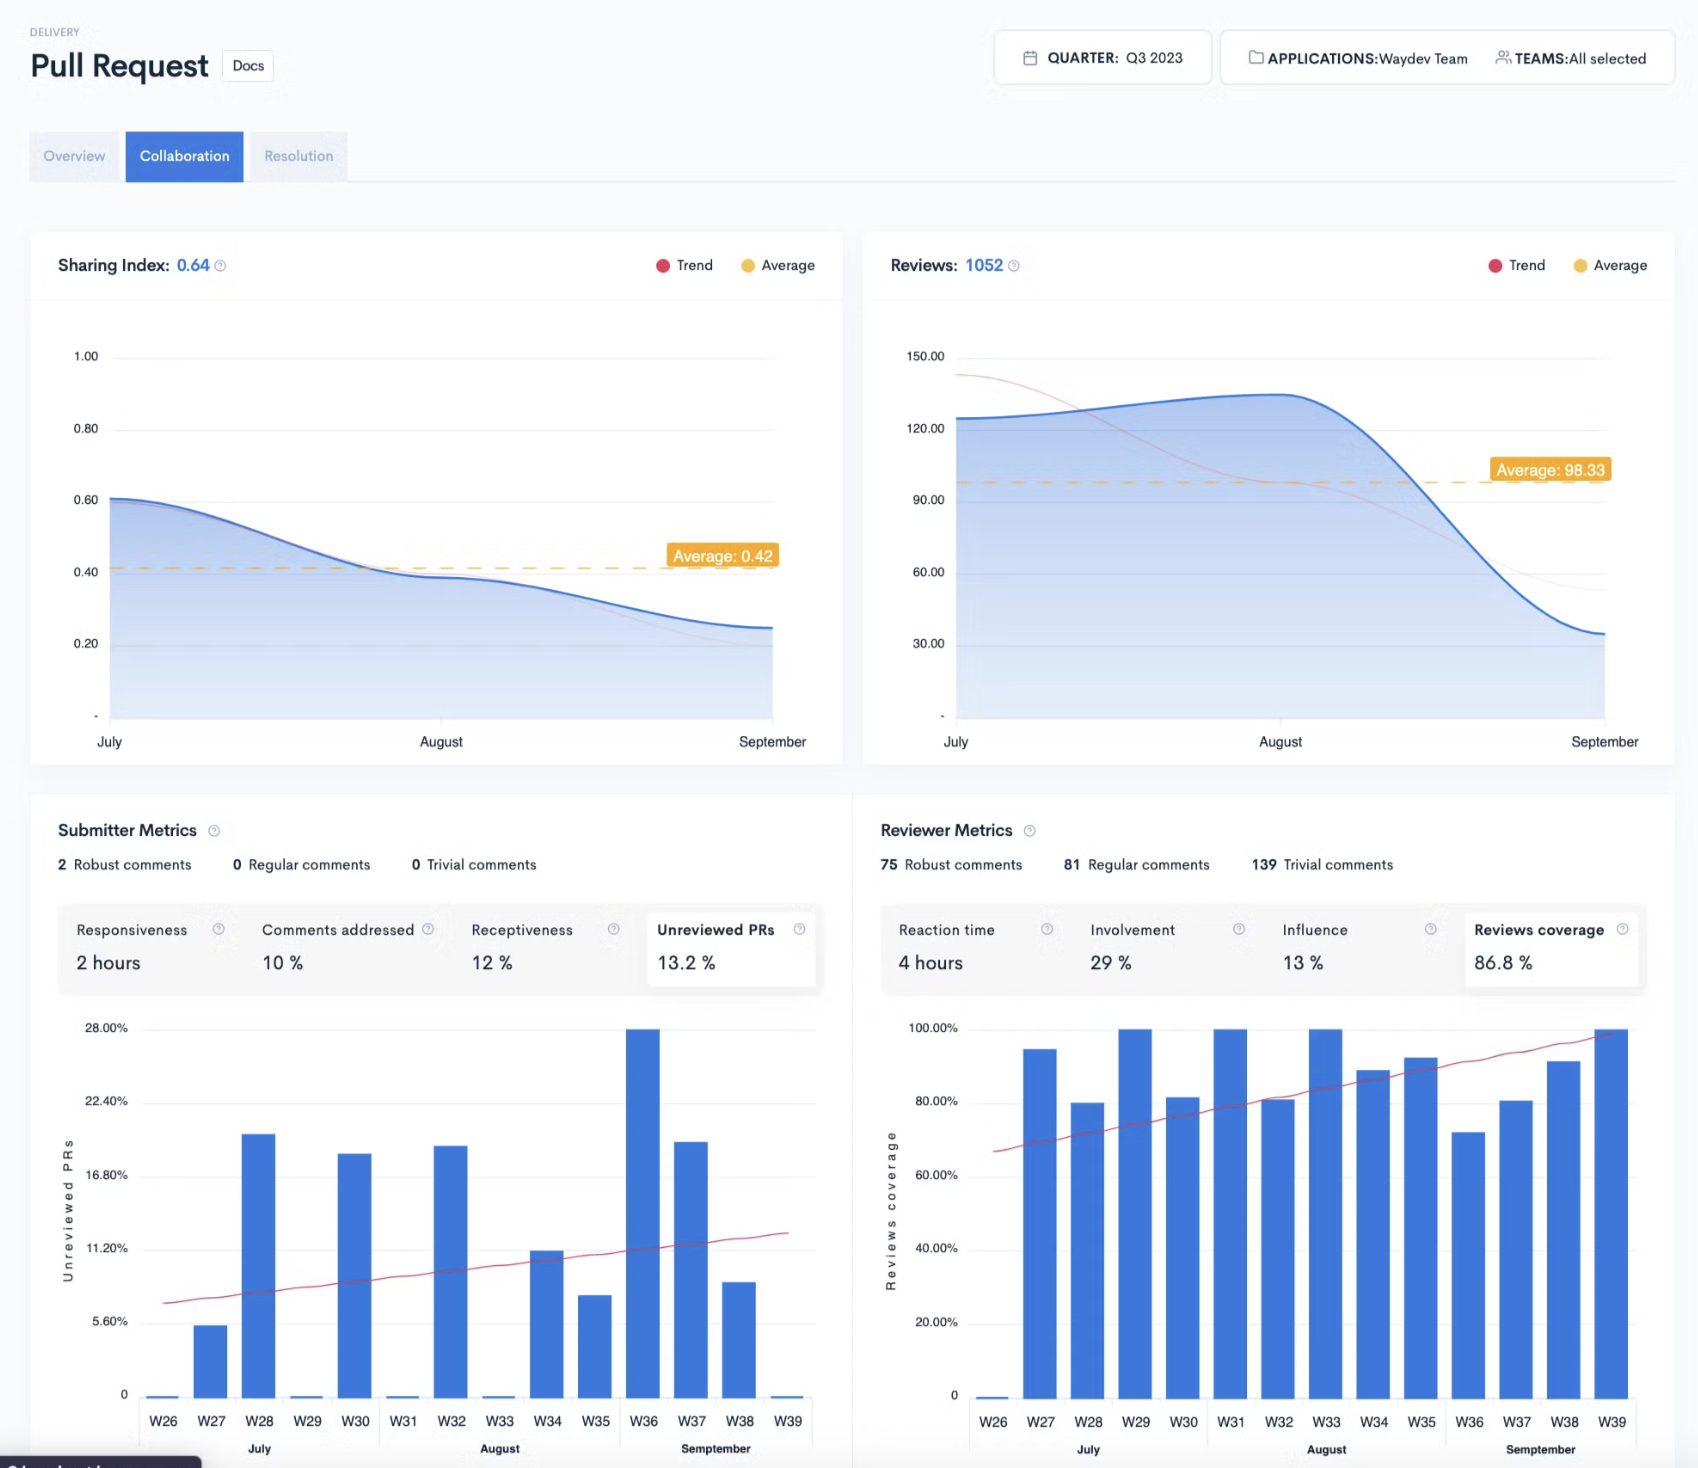
Another important question that is likely to come up frequently after a sprint is, how long did it take for the team to complete the code review?
To answer this particular question, we built the Code Review workflowreport in Waydev. This focuses on six core PR cycle metrics:
While agile scrum and other methodologies can help engineers iterate easily and ship faster, hidden issues and bottlenecks can disturb the development process.
By having an overview on the bottlenecks or outliers in your team’s PR cycles over a sprint, you can help your team work better with a healthier and more collaborative and productive code review process.
These software developer performance metrics measure and highlight how software is running in production and how effective the development team is at maintaining it.
It represents any day where an engineer contributed code to the software project.
Work Log is one of Waydev’s features that is relevant here as well, since it offers a comprehensive view of your engineers’ contributions and work habits.
It brings in valuable data based on software metrics, such as code commits, merge commits, open/closed/merged PRs, PR comments. You can more easily notice when something might be off, when teams are backloading release, or what release might be at risk. At the same time, it helps you understand when to experiment with processes or find a healthier distribution of work.
This code metric is a quantified representation of when engineers rewrite their own code too soon after it has been checked in (less than 3 weeks old). A certain amount of churn code can be expected for any developer.
But unusual churns should be discussed with your engineers: did something change? Were the specs unclear? These answers will let you know how to support your team.
The proportion of code without churn.
This software development metric helps you speak towards the survivability of output into the product. It measures the percentage of a developer’s contributed code that’s productive, which involves balancing coding output against code longevity.
The Efficiency metric is independent of the amount of code written. The higher the efficiency rate, the longer that code is providing business value, and a high code churn rate reduces it.
This software development metric speaks towards the complexity of output into the product. To be more precise, it measures the amplitude of code changes happening in a more complex way than measuring LoC.
Impact helps you find out an approximate value of how much cognitive load engineers carry when implementing changes. This set of software production metrics takes into account:
Impact comprises data points that we, at Waydev, improve continuously on a monthly basis to provide a metric that translates engineers’ output into business value and cognitive load.
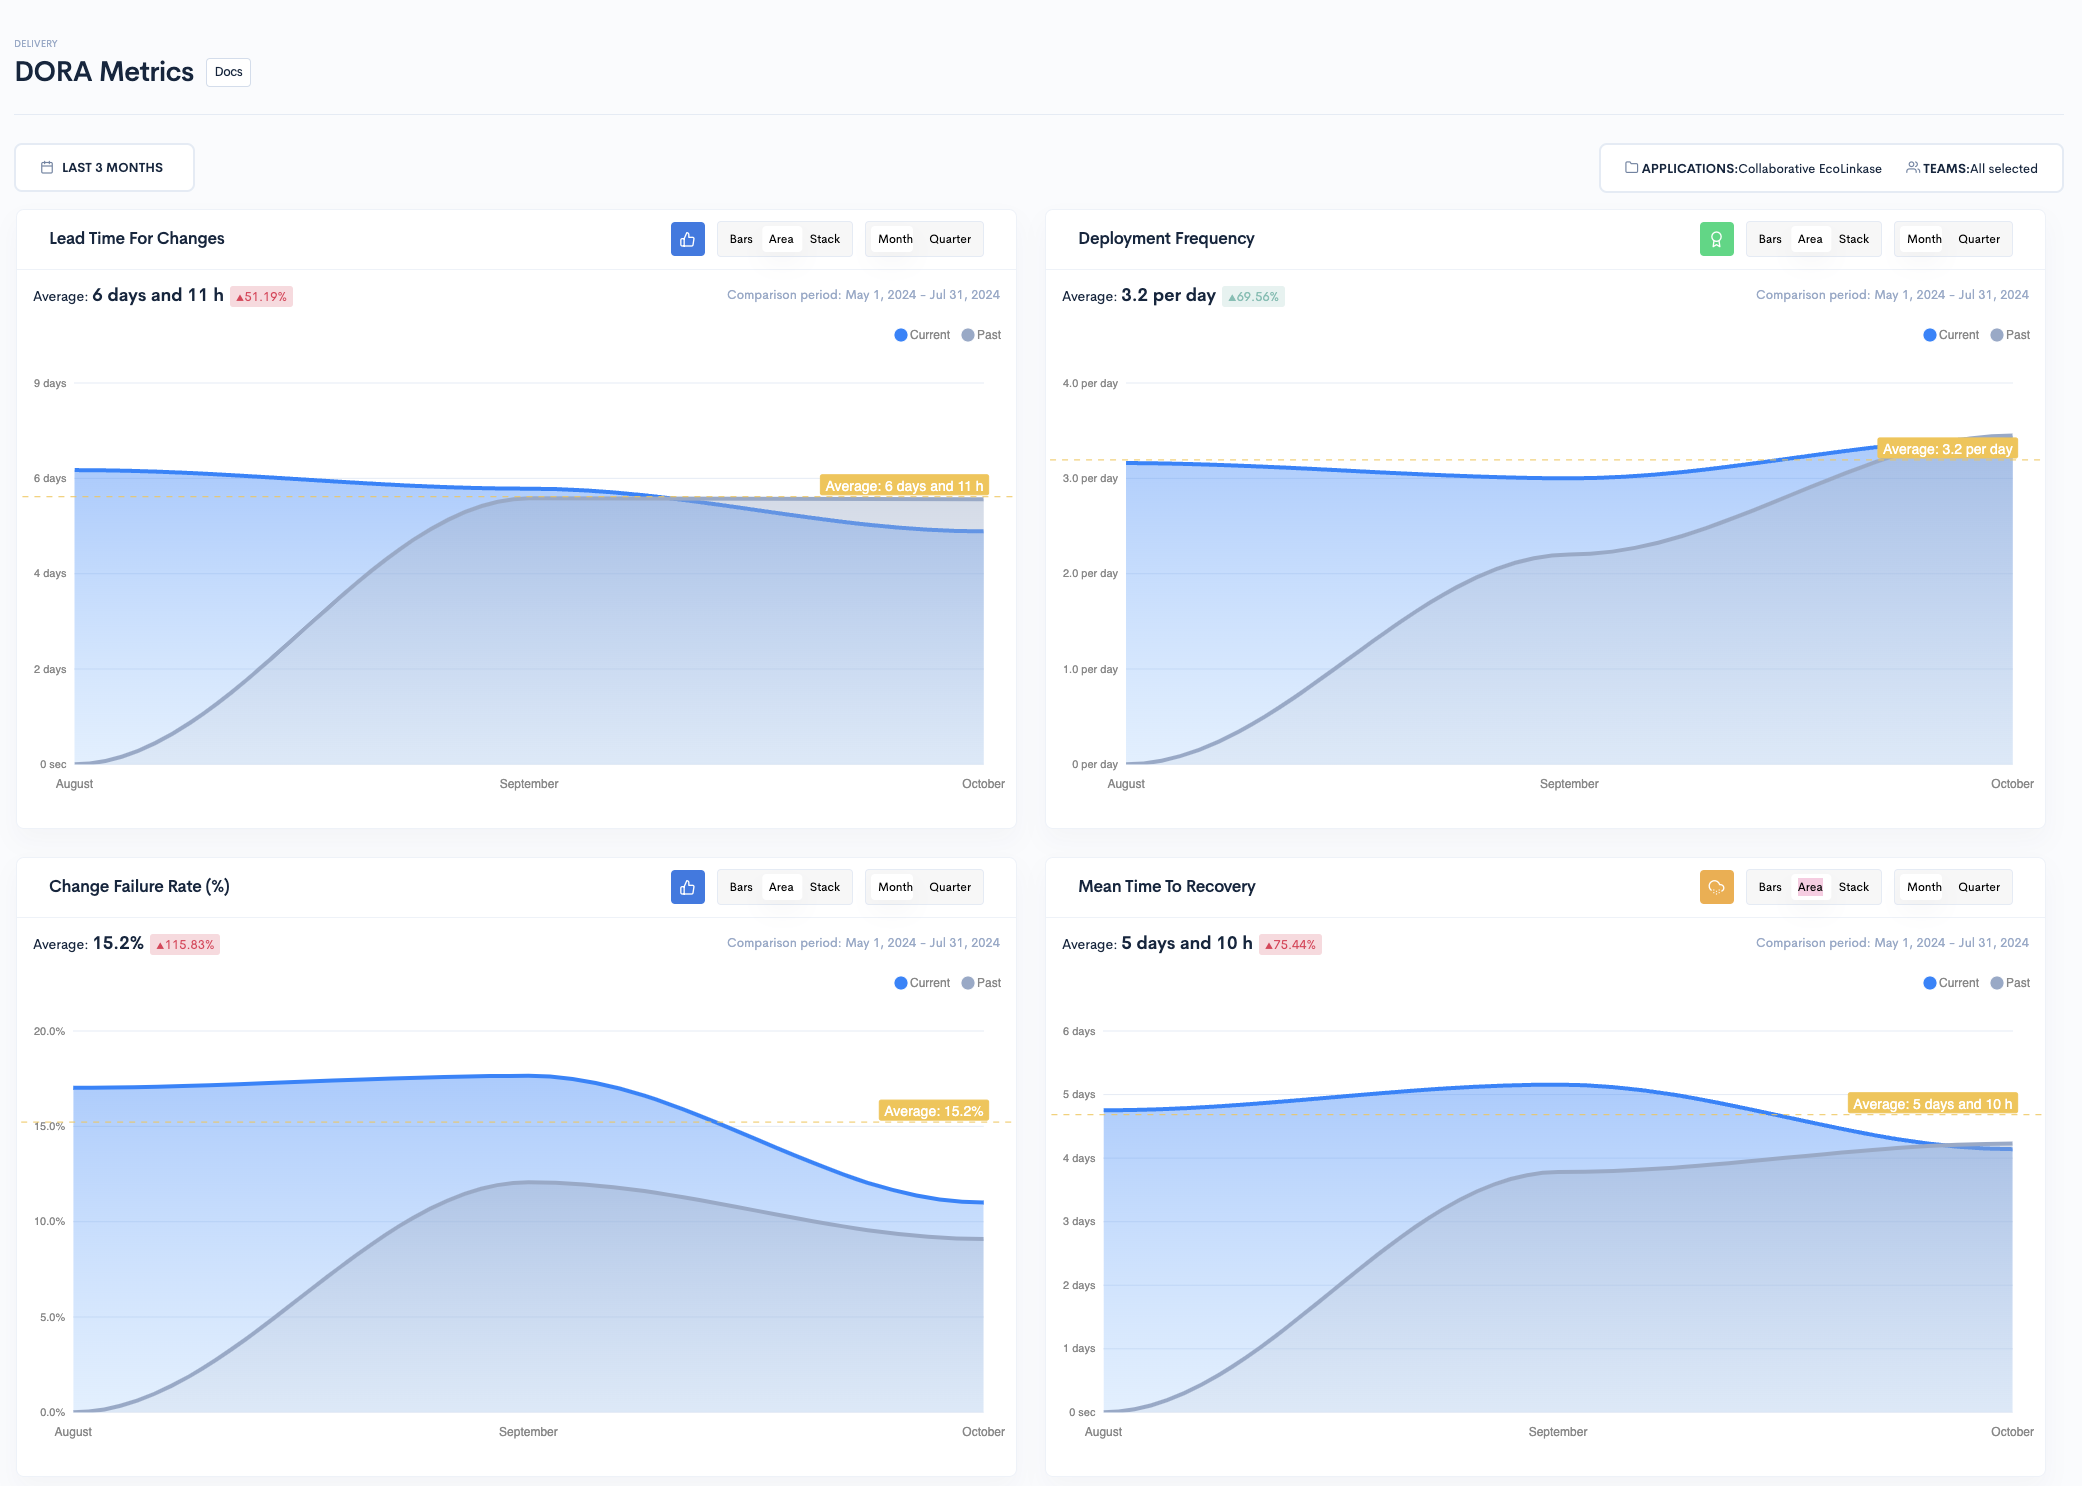
This is an incident metrics that indicates the average time between repairable failures of a software or tech product. The longer the time between unexpected issues or outages, the more reliable the software produced.
It is another technical incident metric that refers to the average time it takes to recover from a product or system failure. Use it to calculate the time spent during an outage – from the moment it fails to the time it becomes operational. Also, it’s usually relevant in assessing the stability of a software development team.
The following software metrics measure how thoroughly something was tested, which reflects in the software quality. Automated tests are crucial for maintaining high software quality, as they provide a measurable factor in evaluating the thoroughness of a system’s testing. Without a focus on quality, teams could miss delivery dates, high-risk work and code rework, iteration interruptions, and frustrated clients, engineers and stakeholders.
This type of metric determines the percentage of lines of code successfully validated under a test procedure. This, in turn, helps in determining how well a software is verified and if the code is readable and maintainable. Pair it with other software developer productivity metrics to fully understand how likely the software is to contain errors or undetected bugs.
The Risk metric measures how likely it is for a particular commit to cause issues. Clearing any risks means more quality, stable code for end-users. You can think of it as a pattern-matching engine, where Waydev is looking for anomalies.
This set of metrics looks at the following data points:
Code health is a crucial metric that measures the overall quality and maintainability of the codebase. It encompasses various aspects, including code complexity, duplication, and adherence to coding standards. A healthy codebase is essential for ensuring the long-term sustainability and scalability of the software. By tracking code health metrics, development teams can identify areas that require refactoring, optimize their code, and improve the overall quality of the software.
For instance, tools like static code analyzers can help you measure code complexity and identify duplicated code. Regular code reviews and adherence to coding standards also play a significant role in maintaining code health. By focusing on these aspects, development teams can ensure that their codebase remains clean, efficient, and easy to maintain, which ultimately leads to higher software quality and reduced technical debt.
Test effectiveness measures the efficiency and efficacy of the testing process. It evaluates the ability of the tests to detect defects, ensure code coverage, and validate the software’s functionality. By analyzing test effectiveness metrics, development teams can identify gaps in their testing strategy, optimize their test suites, and improve the overall quality of the software.
Enhancing team collaboration is essential for ensuring the success of software development projects. Collaboration metrics measure the effectiveness of communication, coordination, and cooperation among team members. By tracking collaboration metrics, development teams can identify areas for improvement, optimize their communication channels, and foster a more collaborative and productive work environment. Common collaboration metrics include team velocity, lead time, and cycle time.
For instance, team velocity measures the amount of work a team can complete in a given iteration, providing insights into their productivity and capacity. Lead time and cycle time, as discussed earlier, help in understanding the efficiency of the development process. By regularly reviewing these metrics, development teams can identify bottlenecks, improve their workflows, and enhance overall team collaboration. Tools like Waydev can provide real-time data and insights into these metrics, helping teams to stay aligned and work more effectively together.
Improving software development quality metrics combines technical, process-based, and artistic strategies. Automating build, test, and deployment steps boosts reliability by minimizing the chance of manual errors. Here are some key strategies:
Define clear metrics: Select relevant software metrics like defects, technical debt, cyclomatic complexity, maintainability index, etc., and define how they will be measured.
Automate tracking: Automated tools for code quality, testing, builds, etc., should continuously track KPIs. Manual measurement can be inaccurate.
Set realistic benchmarks: Based on previous performance and industry criteria, set achievable short & long-term goals for the metrics.
Monitor comprehensively: depth analysis, measurement, and tracking should include code, testing, architecture, release management, etc. – not just limited code metrics.
Perform root cause analysis: When metrics degrade, or goals are unmet, strictly analyze causes, identify process gaps, and address them through corrective actions.
Review periodically: Governance committees and leadership should frequently review metrics performance, trends, and actions taken. Course correct if needed.
Link to outcomes: Correlate software developer performance metrics with business outcomes, like production defects and system reliability, to spotlight areas needing attention.
More than measuring for metrics alone is required. Leverage quality metrics to govern, enforce accountability, and trigger appropriate action toward delivering better software.
Software metrics provide an accurate analysis of the results and the impact of decisions made during the software development process. They’re important to managers, teams, and clients.
By tracking relevant performance KPIs, you gain insight into your team’s performance and progress in delivering reliable software, while meeting business goals and engineering OKRs.
As you start to measure these meaningful software metrics, the first step for you as a leader is to educate your team on what you’re doing and why it will help them get better.
A dev analytics tool becomes more valuable than ever.
Trusted by 300+ companies around the world, Waydev gives you clear visibility into your team’s output and how engineers are working, while helping you make data-driven decisions.
You May Also Like: Top 11 DevOps Performance Metrics to Measure Team Success

Ready to unlock your SDLC productivity?