Estimated reading time: 9 minutes
In engineering organizations, growth is strictly related to producing fast and reliable software. In the software development industry, nearly everyone, from developers and engineering managers to C-level executives, wants to deploy software more quickly, write better code, and provide end users with greater value.
A key component of Agile software development is focusing on the right metrics. As an engineering team leader, it’s your job to increase velocity by constantly improving how your team works. Regarding accelerating the software delivery process, cycle time vs lead time are two essential velocity metrics to measure and monitor.
Although understanding the nuances between Lead Time vs. Cycle time is critical if you want to use their true potential, it’s just as important to have an overview of these two velocity metrics to reduce and optimize them.
At Waydev, we understand the challenge of accurately measuring these metrics. Our platform offers you instant access to this data so that you can assess DevOps velocity and performance in no time.
The article aims to clarify the differences and similarities between lead time vs cycle time, why it is essential to measure, and how to optimize DevOps processes by reducing the two metrics.
Lead Time is a term borrowed from the manufacturing method “Toyota Production System.” It calculates the time between a customer placing an order and the time the order was shipped and received by the customer.
Lead Time for Changes is specific to software development. It is a velocity DORA metric that measures the amount of time needed to implement, test, and deliver changes to the codebase. This metric measures the time between committing and sending the code to production processes.
In other words, Lead Time for Changes calculates the time elapsed between the identification of a requirement and its fulfillment. Simply put, it is an indicator of how long it takes for a client’s requested feature to be completed.
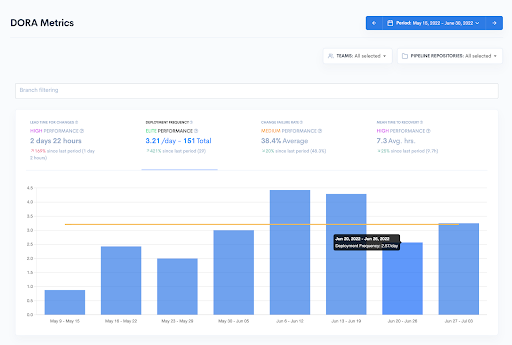
With Waydev’s DORA metrics dashboard, Lead Time for Changes and the other three metrics are pulled automatically in a single dashboard so you can make informed decisions based on actionable insights related to your team’s performance.
There are two ways to calculate lead time for changes vs cycle time to spot bottlenecks and assess areas for improvement.
The traditional way means asking your developers about their average Lead Time for Changes, manually checking Jira statuses, creating reports, and holding daily standups to gather all information to obtain a clear overview.
Lead Time for Changes is then calculated by comparing the time each revision was initiated with the time at which the same revision completed the deployment pipeline’s final action. You can only imagine that this is not only a tiresome process, but also an inaccurate one that is susceptible to flaws.
Nowadays, thanks to data-driven engineering management analytics platforms like Waydev, this metric is pulled automatically due to our CI/CD integrations, such as GitHub Actions, Jenkins, and CircleCI.
The benefit is that it reduces the deployment’s overall time by accelerating deployment through automation. With our development analytics feature, all DORA metrics, including Lead Time for Changes, are displayed and tracked automatically in an easy-to-read dashboard without requiring you to aggregate all this data manually.
Cycle Time is also a velocity metric in manufacturing and an important strategic tool for project management. Actual Cycle Time measures the time an engineering team takes to finish a project. Simply put, it reflects the time spent producing a feature until it is ready for shipment.
It is an indicator of development processes’ velocity, showing how fast an engineering team can deliver a product to customers, from when work has started until the moment it’s been delivered. It all comes down to the team’s development velocity.
As an engineering manager, you’re probably already using DevOps KPIs to measure your development pipeline and make informed purchasing and budgeting decisions.
However, your road to success is unfinished without something to link these important metrics together. To differentiate yourself from the competition, use a Cycle Time analysis to make the connections between your KPIs and improve your production process.
When calculating actual cycle time, you need to know your production time and how much of a product/feature is produced in this time. Target cycle time is calculated by dividing the total production time by the units produced.
You also need to consider the time when production was paused, meaning the waiting period between active production work.
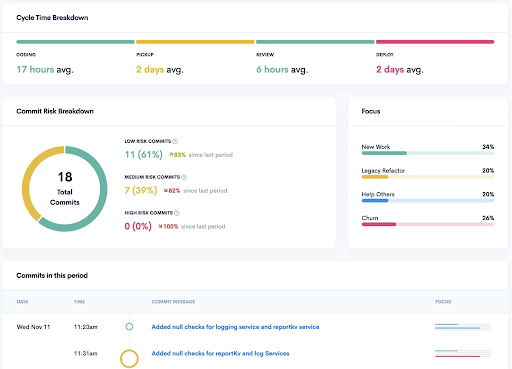
At Waydev, we measure Cycle Time from the first commit until that feature is deployed to production and made available to users. Thanks to our CI/CD integrations that pull DORA metrics automatically, you’ll have access to Cycle Time and gain insights about the development processes’ velocity with no manual input.
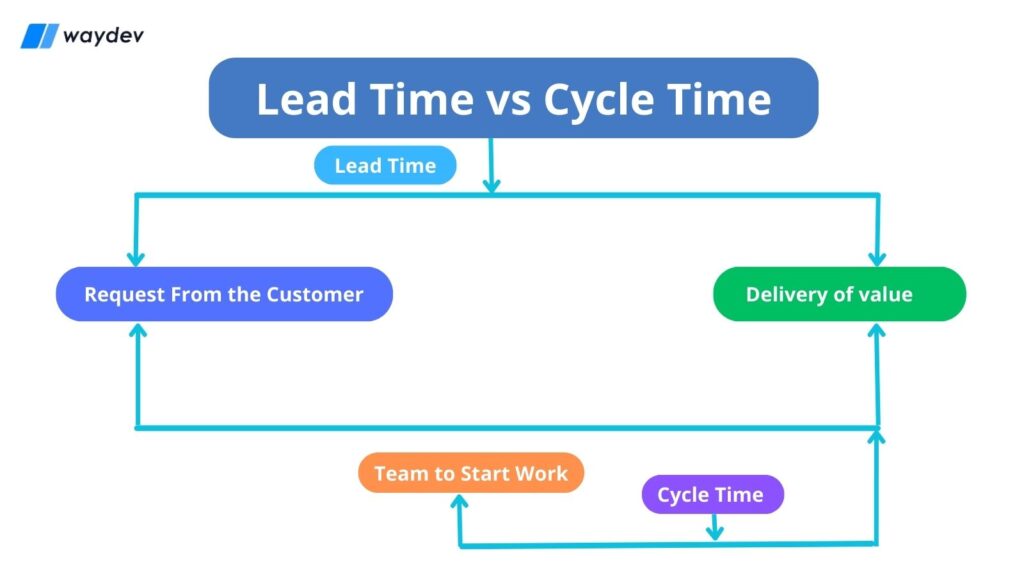
The core distinction in lead time vs cycle time comes down to where the clock starts. Lead Time for Changes begins when a requirement is identified or a ticket is created. Cycle Time begins when a developer makes the first commit. Everything that happens between those two start points, such as backlog refinement, prioritization, and waiting for sprint assignment, is captured by lead time but invisible to cycle time.
That distinction matters operationally. If a team’s cycle time is fast (say, three days from first commit to deploy) but their lead time is three weeks, the bottleneck is not in development. It’s in the pre-coding stages: unclear requirements, a crowded backlog, or slow stakeholder sign-off. Cycle time alone would never surface that problem.
Lead Time for Changes includes Cycle Time and depends on it, whereas Cycle Time does not have Lead Time for Changes. Another key difference is the units in which they’re measured: Lead Time is measured in elapsed time (weeks, hours, seconds), while Cycle Time is measured in time per unit or task.
The relationship between Lead Time vs Cycle Time is described by Little’s Law as follows:
Lead Time = Cycle Time x WIP (Work-In-Progress)
This formula has a direct implication for sprint planning. If a team’s average cycle time is two days per task and they carry 10 tasks in progress simultaneously, their lead time averages 20 days. Cutting WIP in half, even without speeding up coding, would halve lead time.
Consider a team shipping a payment-method update. The product manager creates the ticket on Monday morning. The ticket sits in the backlog for five days while the team finishes the current sprint. On Saturday, a developer picks it up, pushes the first commit, and the feature reaches production the following Wednesday, ten days after the ticket was created.
The six-day gap between those two numbers is entirely pre-coding wait time. A manager looking only at cycle time would see a healthy four-day execution window and have no signal that nearly two-thirds of the total delivery time was lost before a single line of code was written.
Now apply Little’s Law. If this team typically carries 8 items in parallel and their average cycle time is 4 days, their expected lead time is 32 days. Reducing WIP from 8 to 4 items would bring expected lead time down to 16 days without touching code quality or sprint velocity at all. That is the kind of decision these two metrics make visible together that neither surfaces alone.
This is also why engineering managers who track only one metric tend to address the wrong problem. A team with a slow cycle time needs to look at their review queue, CI build times, and deployment pipeline. A team with a slow lead time but fast cycle time needs to look at backlog hygiene, ticket refinement, and how priorities get assigned.
Lead Time for Changes vs Cycle Time are essential velocity metrics to track in DevOps, and they can help engineering managers understand the dynamics of their team’s workflow.
These metrics give insights into the relationship between an order being placed and completed. They’re also a good indicator of your engineering team’s capability to deliver value to your customers.
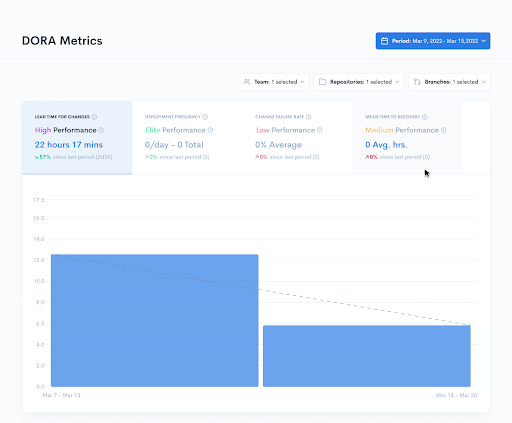
By measuring Lead Time for Changes, engineering managers can understand the average time their customers receive their orders. If the Lead Time is high, it can negatively affect customer satisfaction and the overall user experience.
By analyzing Cycle Time, engineering managers can determine the overall efficiency of their production unit. With this information, they can spot the inefficiencies and bottlenecks that may slow things down.
To increase productivity and cut costs, Lead Time for Changes and Cycle Time should be reduced as much as possible. In a competitive environment such as software development, customers expect valuable products delivered quickly and reliably. An engineering manager who tracks both metrics can pinpoint whether a slowdown originates before or after the first commit, which drives very different corrective actions.
Understanding lead time and cycle time is essential for increasing the efficiency of business functions and software development. While these terms are sometimes used interchangeably, they have distinctive purposes. Here are some key reasons businesses should monitor both lead and cycle time metrics:
Knowing the difference between these two metrics points directly to where the work is. The right reduction strategy depends on which number is improved and why.
When lead time is the problem: The bottleneck is typically upstream of the first commit. Start by auditing how long tickets spend in the backlog before anyone acts on them. If tickets regularly sit for more than a few days, the issue is usually one of three things: requirements are too vague for a developer to start, priorities shift too frequently, or the team is carrying too much WIP. Reducing backlog depth and setting explicit WIP limits will shrink lead time faster than any improvement to the deployment pipeline.
When cycle time is the problem: The bottleneck lives inside the development process itself. Common causes include long-running CI builds, pull requests queued for days without review, or test suites that block deployment for hours. A cycle time breakdown, visible in Waydev’s dashboard, shows exactly which phase (coding, review, build, or deploy) is consuming the most time. That narrows the fix to a specific workflow stage rather than a broad “go faster” directive.
When both are improved: This usually signals a systemic capacity problem. The team may be understaffed relative to demand, or a high-WIP culture has normalized long queues at every stage. In this case, tracking the ratio of lead time to cycle time over several sprints will show whether interventions are working. If cycle time drops but lead time stays flat, the pre-coding bottleneck has not been addressed yet.
One useful reference point: DORA research classifies “elite” software delivery teams as those achieving lead times of less than one day. Most teams starting this journey will see lead times measured in weeks. Moving from weeks to days almost always requires both WIP reduction and pipeline automation, not just one of the two.
Measuring Lead Time for Changes and Cycle Time metrics is vital in ensuring your work processes flow in the most efficient manner possible.
Understanding Lead Time vs Cycle Time will help you keep track of your team’s progress while ensuring that your customers are satisfied.
Reducing Lead Time for Changes and Cycle Time isn’t hard if you have the right tools on your side. The challenging part is realizing that, given the volume of issues and tasks a software development team typically handles, you need an automated measuring method.
Waydev offers different solutions to help keep track of the statuses of all your projects, orders, and tasks.
One of the biggest obstacles in reducing and improving Lead Time for Changes and Cycle Time is accurately measuring them.
With Waydev, you can measure both Cycle Time vs Lead Time and have a clear overview of all four stages of the development process. Speed up the velocity by receiving insights into the efficiency of your software delivery process, from the moment the first commit was created up until the moment it got deployed.
The next step is to optimize Lead Time for Changes and Cycle Time. As an engineering manager, you can use Waydev to benchmark your team’s results with the industry and ultimately improve your DevOps processes and your team’s productivity.
Ultimately, if you want to get more granular, you can use Waydev’s Project Timeline feature and analyze how your team’s work focus and volume modify over time.
Contact us to find out how Waydev can help you optimize your team’s Lead Time for Changes and Cycle Time!
Ready to unlock your SDLC productivity?