


Health
Insights
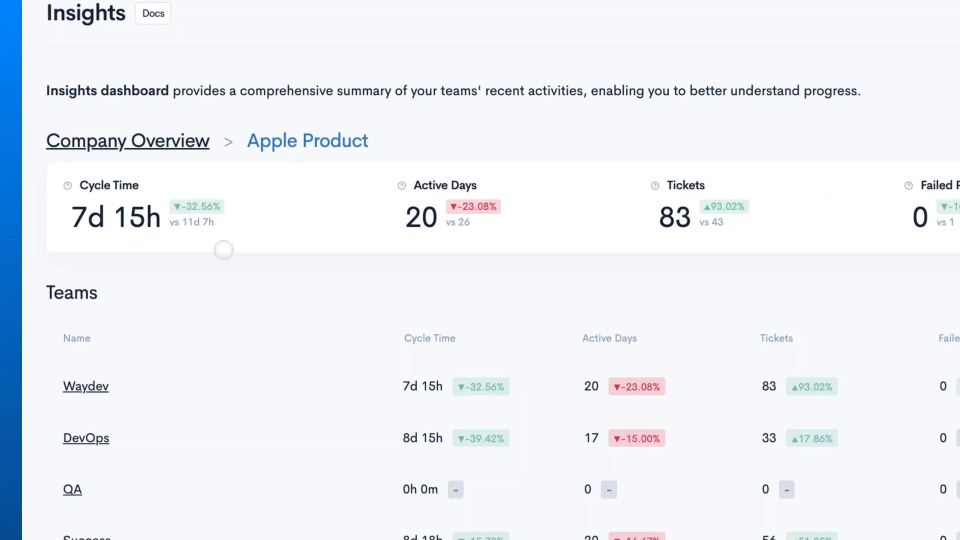
The Insights dashboard provides a comprehensive summary of your company and projects’ recent activities, enabling you to understand progress better.
With the Insights report, you can gain a better understanding of your company’s performance. Explore key performance metrics in all projects from your company to drive impactful outcomes.
Track Company Performance with Key Metrics
- Cycle Time: measures the time from the first commit made to production release.
- Active Days: represents the number of days a contributor was active, tracking code commited and pull request activity.
- Tickets: represents all tasks, issues, bugs, or any other work that needs to be tracked and resolved within a project.
Dive Deep into Project-Level Insights
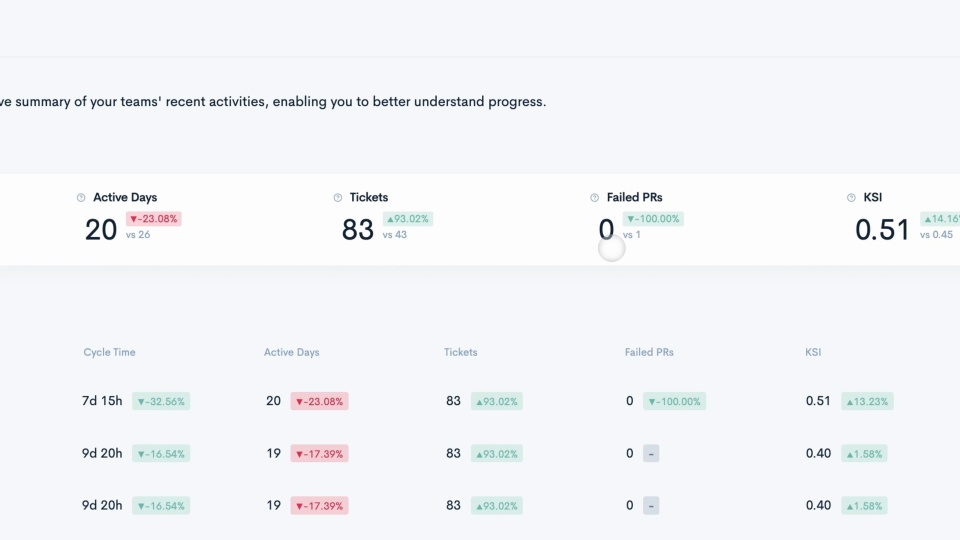
- Failed PRs: refers to the cumulative count of Pull Requests that have encountered issues or failures during the review and merging process.
- KSI: The Knowledge Sharing Index is a metric designed to assess how well your team collaborates on code reviews.
- Unplanned Tickets: represents the number of tickets that were added to the sprint after the sprint started.
Analyze Team Performance in Detail
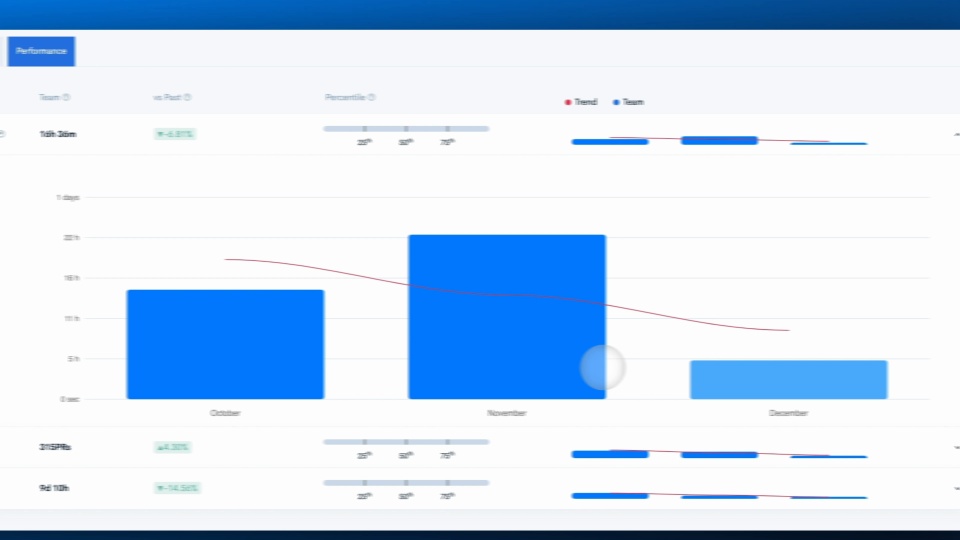
By clicking the team in any project you are zooming into, you’ll see the Perfromance of that team, right from the Team Inisghts report:
- The Performance tab provides an overview of a selected team’s performance over a chosen time frame, compared to the average of all teams in your Waydev account.
- It covers two metric categories—Delivery and Health. For each metric, you can view the current value, percentage change from the previous period, a percentile bar, and an evolution graph.
Trusted by FORTUNE 500 enterprise companies


READY TO ADOPT A DEVELOPER PRODUCTIVITY INSIGHT PLATFORM?