Tracking investments and their ROI is crucial for any successful organization. As a CTO, you have to prioritize assessing your department’s activity to pinpoint the added value your team brings to the table and how it translates into objective results.
In this context, measuring DevOps success is a must. Setting and following key performance indicators lets you understand how your team deploys DevOps principles daily and identify improvement opportunities that foster a more stable, collaborative, and innovative operational environment.
CTOs have to decide what key Devops metrics to monitor to showcase how the whole business benefits from the DevOps strategy. You need to start from the business requirements and translate them into DevOps KPIs. Next, monitor these KPIs with consistency and generate benchmarks. This approach will enable you to identify bottlenecks, process slowdowns, and improvement opportunities.
At Waydev, we understand how important it is for CTOs to measure key DevOps metrics and KPIs. Our solution enables you to assess essential key metrics for software development and analyze them automatically without requiring manual input from your team. This way, you have instant, easy access to data that you may explore and compare across different periods to make data-driven decisions that translate into scalability..
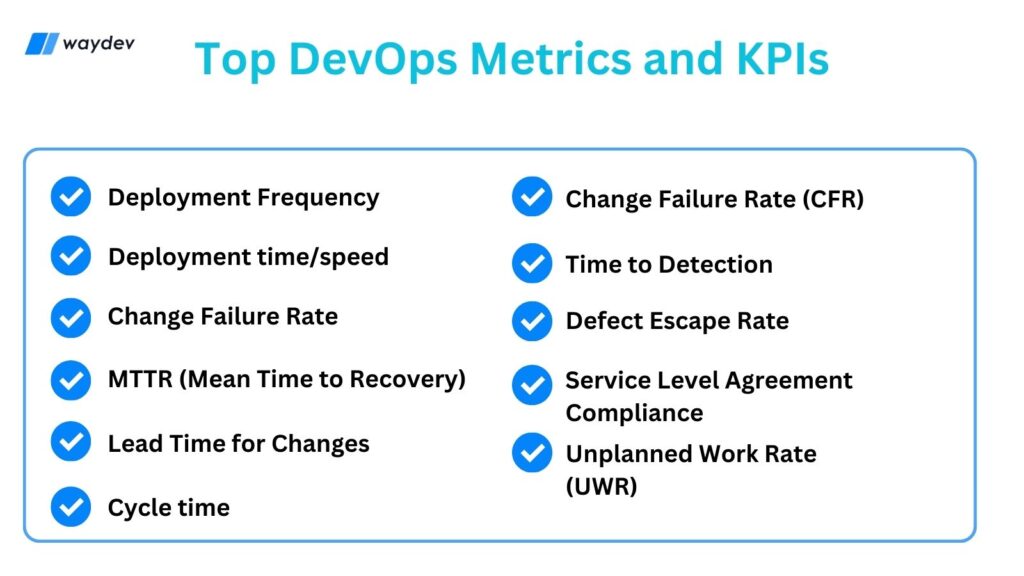
This article will focus on the top DevOps metrics successful CTOs track to deliver business results.
A software development team must measure and track the right DevOps metrics and KPIs. Accurate data and a set of DevOps metrics help developers perform more efficiently and effectively and specify areas needing improvement. You need to know how to gain valuable insights to make data-driven decisions by measuring the right metrics. Let’s discuss key reasons why every DevOps team prioritizes metrics.
The DevOps metrics fill the gap between the development process and providing a cooperative workflow that improves software quality, reduces deployment times, and improves the development process. DevOps Performance Metrics like lead time, deployment frequency, and mean time to recovery clearly show how efficiently you need to operate it. Are code changes being integrated and deployed quickly? How long does it take to recover from failures? From the above data, you can identify reasons for failure and take steps to optimize your processes accordingly.
Everyone wants to deliver high-quality software that performs effectively. DevOps metrics such as change failure rate, defect escape rate, and availability allow you to assess the quality and reliability of your software directly. If you notice an upward trend in failure rates, you can investigate the root causes closely before minor issues become major problems.
DevOps metrics help improve the software development process and teamwork practices. You can establish criteria by tracking metrics over time and setting goals for improvement. For example, if your deployment frequency is lower than expected, you can explore automation options or remove bottlenecks. Metrics deliver a feedback loop that fuels your ongoing improvement efforts.
DevOps teams show their efforts and costs to executive stakeholders in many organizations. DevOps performance metrics offer a valuable way to showcase the value you deliver during development. For example, your team has reduced lead times and increased deployment frequency, which helps deliver value to customers quickly and achieve a competitive advantage.
Whether assessing new tools, restructuring development teams, or changing procedures, DevOps metrics and KPIs provide insights you need to confirm you’re moving in the right direction. Effective use of DevOps metrics allows you to make data-driven decisions based on complex data rather than assumptions or subjective opinions.
A systematic data collection, analysis, and reporting practice is essential to ensure your metrics are accurate and actionable. The insights you’ll gain are invaluable for driving continuous improvement and indicating the real benefits of your DevOps efforts.
Deployment frequency calculates how often your team rolls out new features and is usually measured weekly or daily. This KPI is vital because it showcases the business’s pace and enables you to develop and deliver a strong deployment strategy.
An excellent approach successful CTOs use is to track production and non-production deployments separately, to have a clear view of the activity and actual deliverables.
Ideally, a DevOps team should target a higher number of deployments with reduced changes instead of the other way around.
By assessing deployment time/speed, you measure how much time it takes to roll out deployments once they are approved. The faster deployments are, the bigger the frequency, which means the two metrics impact one another.
While deployment time/speed is an essential key performance indicator, DevOps teams should understand that it isn’t everything. Targeting a short deployment time without focusing on accuracy is pointless because such a situation might generate high failure rates.
As an engineering manager, you should also pay attention to the evolution of DevOps performance metrics, as a sudden increase can suggest potential bottlenecks in the development process.
Several tools, like Jenkins and CircleCl, tools enable you to improve deployment speed. Waydev integrates with both to gather data from the CI/CD pipelines and analyzes it without requiring manual input.
Ideally, all deployments are perfect, as they don’t produce any issues for systems and users. Still, that rarely happens in reality. Deployment failure rate measures how many deployments generated problems from the total of those implemented.
This metric has to be as low as possible for DevOps teams because it might suggest dysfunctions along the pipeline.
Measuring the KPI isn’t where things end. To improve the deployment failure rate, managers should insist on automated testing using Jenkins and dedicated security plug-ins.
It is also vital to ensure you have a strategy for failed deployments, so the team knows what to do when worst-case scenarios occur.
Mean Time to Recovery (MTTR) showcases how much it takes to detect and restore a failure to bring the service to normal operations. This key DevOps metric, measured in business hours, assesses your team’s efficiency in solving issues while informing you how the outage affected users. By knowing how many customers had to deal with errors, were disconnected, or ended up abandoning the web page or application, you may understand the exact repercussions of each failure and its business impact.
By measuring MTTR, DevOps managers assess their teams and evolutions over time. The goal is that the Mean Time to Recovery decreases from one week to the other. The DevOps metrics and key performance indicators may have a higher value when professionals encounter a problem they haven’t encountered before. Additionally, the more deployments are implemented and the more complex the code, the more chances to have a bigger MTTR.
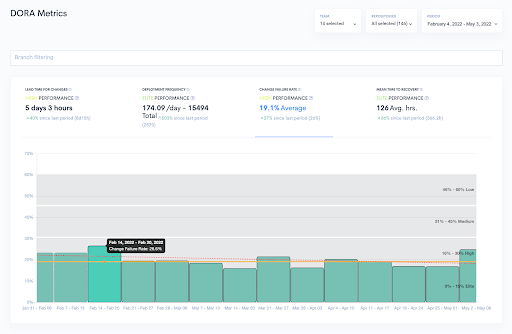
Lead Time for Change tells you how long is needed to implement changes and measures the time it takes to write and deploy code successfully. This metric is essential since DevOps focuses on supporting a continuous software lifecycle.
Keeping track of the KPI and its evolution enables DevOps managers to understand how their teams may adapt to the users’ everchanging needs. Moreover, it also helps them decide whether their internal processes need upgrading. A high number of requests which are not solved in time will increase the pressure on team members and cause delays that will later affect the user experience.
The key performance indicator is measured in hours. Its value should be as little as possible, ideally under one hour, so any number above that should raise some red flags and determine you to evaluate and optimize your processes.
Change Failure Rate measures how unexpected outages and other unplanned failures cause much release failure. The formula for this Dora metrics DevOps is the number of deployments that encountered issues divided by the total number of deployments from the same period.
Failures are defined as any situation where running a script doesn’t ensure deployment.
It is usually advisable to keep this KPI under 20% so that your project benefits from regular, fast deployments. A higher value would mean that the system lacks stability, impacting user experience.
The complexity of DevOps projects is imminent. The more complex the task, the more failures will arise. This is why teams need to detect problems quickly. Time to Detection measures how long it takes for a team to identify an issue.
By assessing this KPI, DevOps managers know if their application monitoring processes function at the best standards. Ideally, the value should be close to zero, but that depends on the protocols implemented and how efficient communications between DevOps team members are.
Software development processes are not free from errors, and professionals everywhere know this. The issue is that, sometimes, they are not noticed until later project stages, such as acceptance testing. Situations also occur when defects may pass acceptance testing and, thus, be discovered by end-users. This is, in fact, the worst-case scenario one could have.
CTOs use the Defect Escape Rate to measure how many defects are detected during and after deployment. The objective of this KPI is to contribute to assessing your processes and the team’s overall dynamic and identify weaknesses. This enables you to make changes where necessary and increase the quality of the delivered product.
Service Level Agreement Compliance help DevOps teams ensure that they respect the SLAs and meet expectations.
Since SLAs clearly state the providers’ commitments and responsibilities, operating per these agreements increases transparency and work efficiency. On the opposite spectrum, any disagreement to what is expressed in the documentation or even not having SLAs may lead to issues and a lack of consistency in client requests, which might affect the workflow.
The Waydev service level agreement states that Waydev will use commercially reasonable efforts to make our services available with a Monthly Uptime Percentage of 99.95%, minimum, during any monthly billing cycle. We guarantee you will experience no more than 21.56 min/month of unavailability.
Optimizing resources and efforts is crucial for efficient DevOps processes, so the Unplanned Work Rate (UWR) is an essential DevOps metric for many managers. The KPI measures the time dedicated to unexpected efforts which have not been budgeted.
The formula used is unexpected efforts divided by planned work.
Some engineering managers compare UWRs with the rework rate to understand how unplanned work is linked with accommodating feedback.
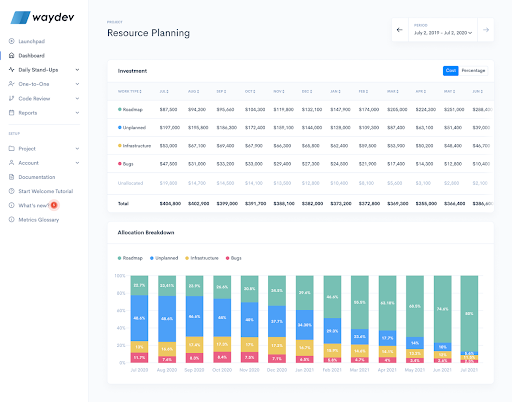
With Waydev’s Budgeting report, CTOs understand the costs behind unplanned work and bugs and visualize the progress of each of their key initiatives. This enables them to take measures accordingly.
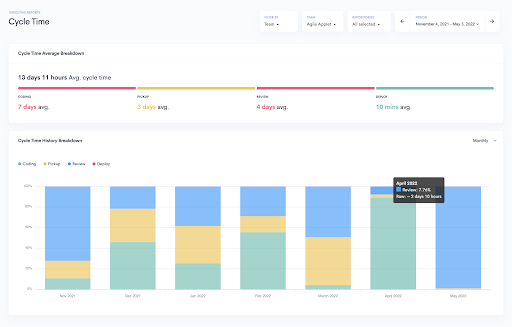
Cycle Time measures the process’s speed and how long it takes for code to go from the teams’ workstation to production. It shows the time between when work starts for a feature until it has been delivered, and users can start benefiting from it.
The engineering KPI showcases the organization’s velocity, focusing on the execution’s speed and quality.
According to research, measuring and improving Cycle Time fosters innovation and enables organizations to increase their teams’ morale and sense of ownership.
Read more about The importance of cycle time and the benefits of reducing it for software development in this article.
With Waydev, CTOs may easily monitor the most important DevOps metrics and have a clear view of their team’s progress and project development. Our solution collects and analyzes data and insights from your engineering stack to help you optimize your development process.
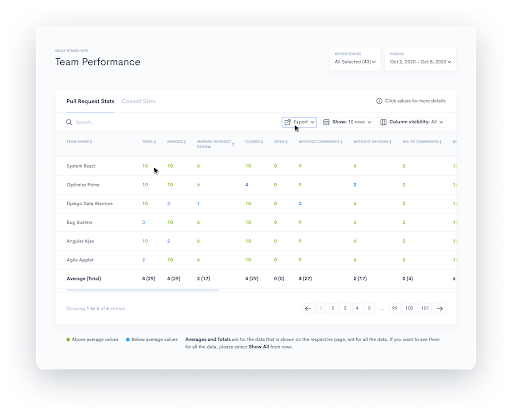
To ensure you align business initiatives with your team’s engineering work, Waydev brings you reports that increase visibility into remote work by analyzing important DevOps metrics and KPIs without any manual input. With Waydev you can gain visibility into your engineering teams’ code and PR metrics via our Azure DevOps Integration.
Request a free demo to see how Waydev can help you track and optimize important DevOps metrics and achieve Elite performer status.
Ready to unlock your SDLC productivity?