UnIntroducing Resource Allocation
Finally understand where engineering time and money actually go
Engineering leaders make hundreds of decisions every quarter. Yet one of the most critical questions has always been the hardest to answer:
Where are our people, time, and budget really going?
Most teams still rely on spreadsheets, gut feeling, or static reports that lag behind reality. By the time issues surface, it is already too late.
Today, that changes.
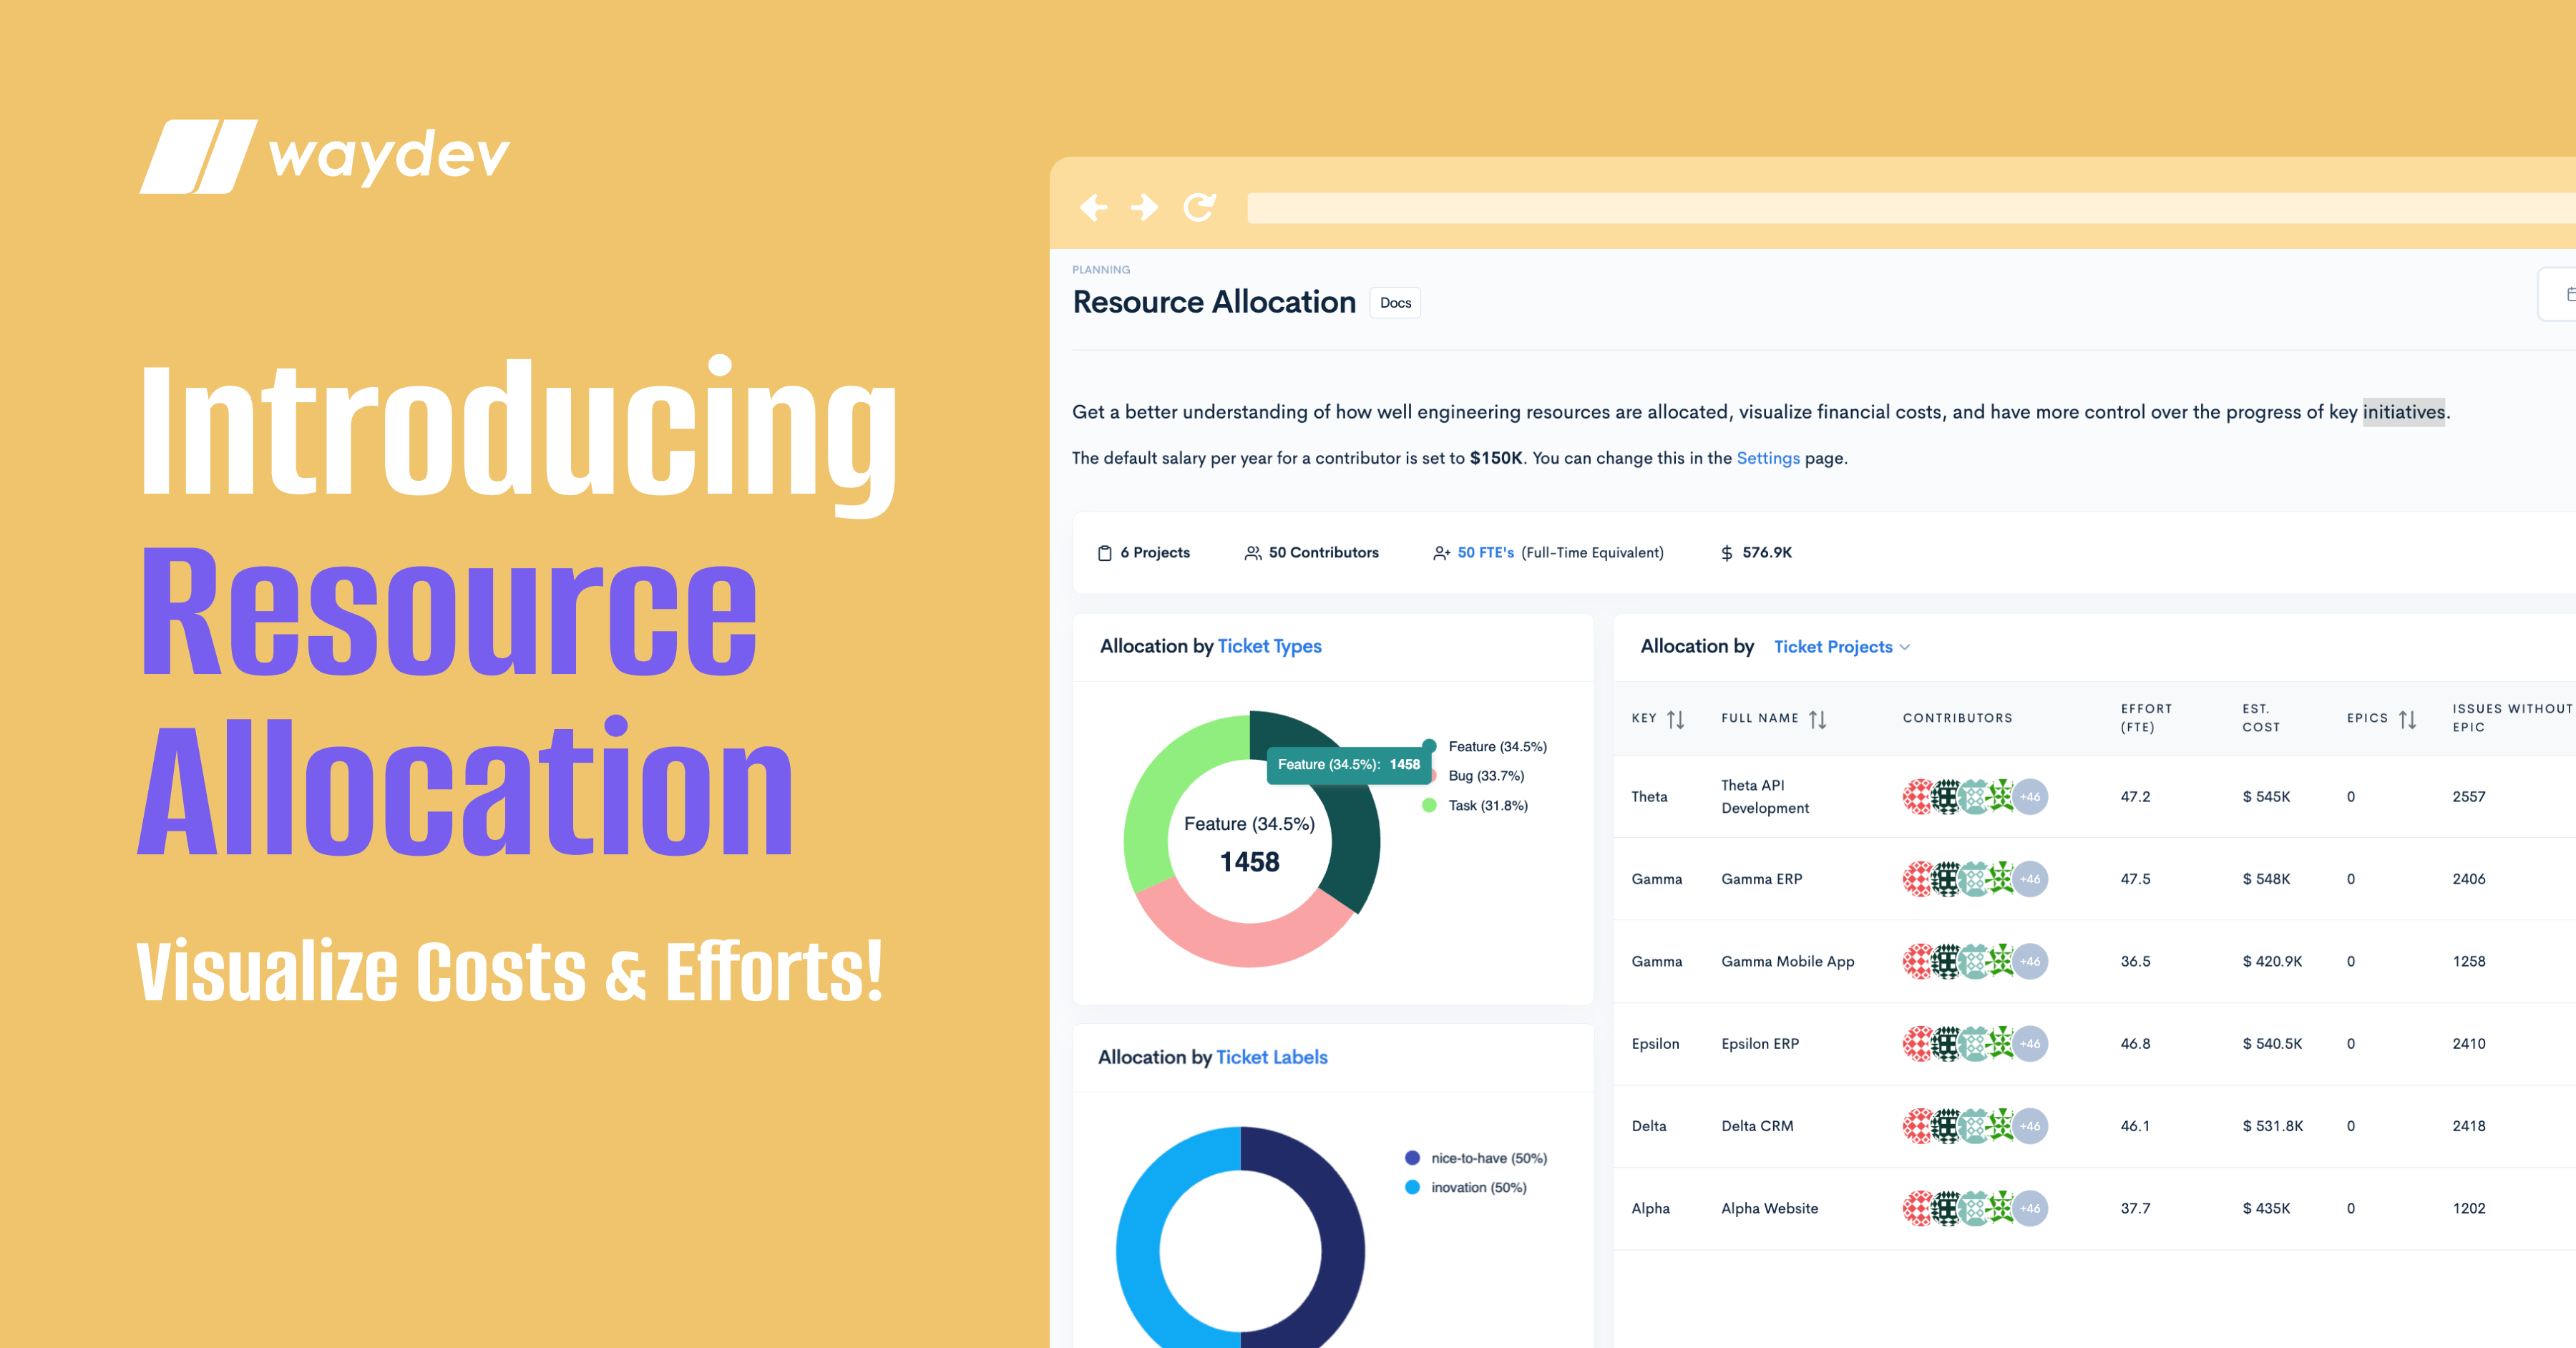
Waydev is introducing Resource Allocation, a new capability designed to give leaders a clear, real-time view of how engineering effort and cost are distributed across initiatives, products, and teams.
This is the missing link between strategy and execution.
Engineering is one of the largest investments in any organization, but it often operates as a financial black box. This creates serious blind spots:
Resource Allocation solves this by pairing effort visibility with cost transparency, in one unified view.
Waydev brings together data from your issue tracking tools, git systems, and contributor metadata to show where engineering investment actually goes.
No manual tagging.
No spreadsheets.
No extra work for engineers.
You can instantly see:
Understand how engineering time is distributed across initiatives, products, epics, and teams using FTE (Full-Time Equivalent).
Map real salary data to real work, turning effort into actual cost, not estimates.
Spot shifts early, such as increasing maintenance load, growing incident work, or initiatives expanding beyond scope.
Zoom from high-level allocation all the way down to individual tickets without losing context.
Everything updates automatically, using data you already have.
At a glance, understand the scope of work analyzed:
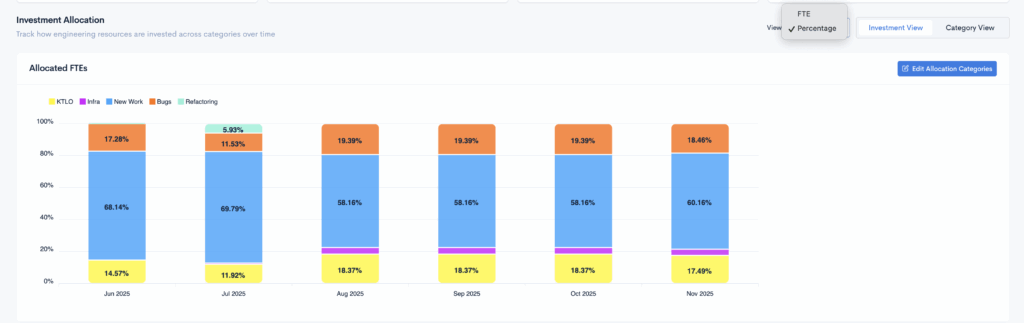
Track how engineering effort is invested across allocation categories over time.
Switch between FTE and percentage views to spot imbalances and shifting priorities.
Hover on any period to see the exact FTE split.
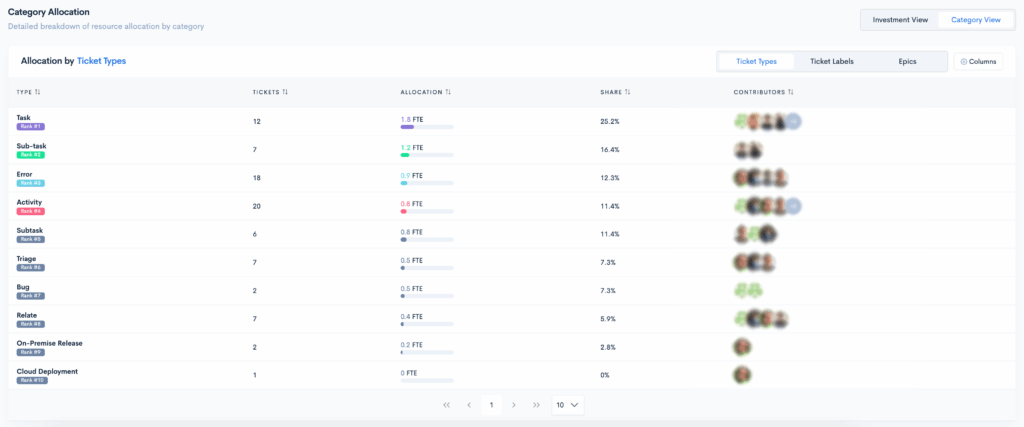
Drill into allocation by:
For each view, you can explore:
Every table is customizable, and every breakdown is explorable down to the ticket level.
Resource Allocation combines effort data with contributor salaries to show true engineering cost per epic, project, or initiative.
This creates a financial model of engineering that reflects real execution, not assumptions.
CTOs & VPs of Engineering
Get a financial view of engineering that matches how teams actually work.
Engineering Managers
Spot resource drains early, balance workloads, and justify resourcing decisions with data.
Product Leaders
Understand the true cost and effort behind roadmap items and initiatives.
Finance & Operations
Finally align engineering spend with business outcomes, transparently and continuously.
For the first time, engineering can answer the same questions Sales and Marketing answer every day:
With Resource Allocation, those answers come from real data, not guesswork.
Engineering is no longer just about delivery. It is about impact, efficiency, and accountability.
Resource Allocation is not just another report.
It is the foundation for better planning, faster decisions, and stronger alignment between engineering and the business.
Engineering, finally explained.
Ready to unlock your SDLC productivity?