




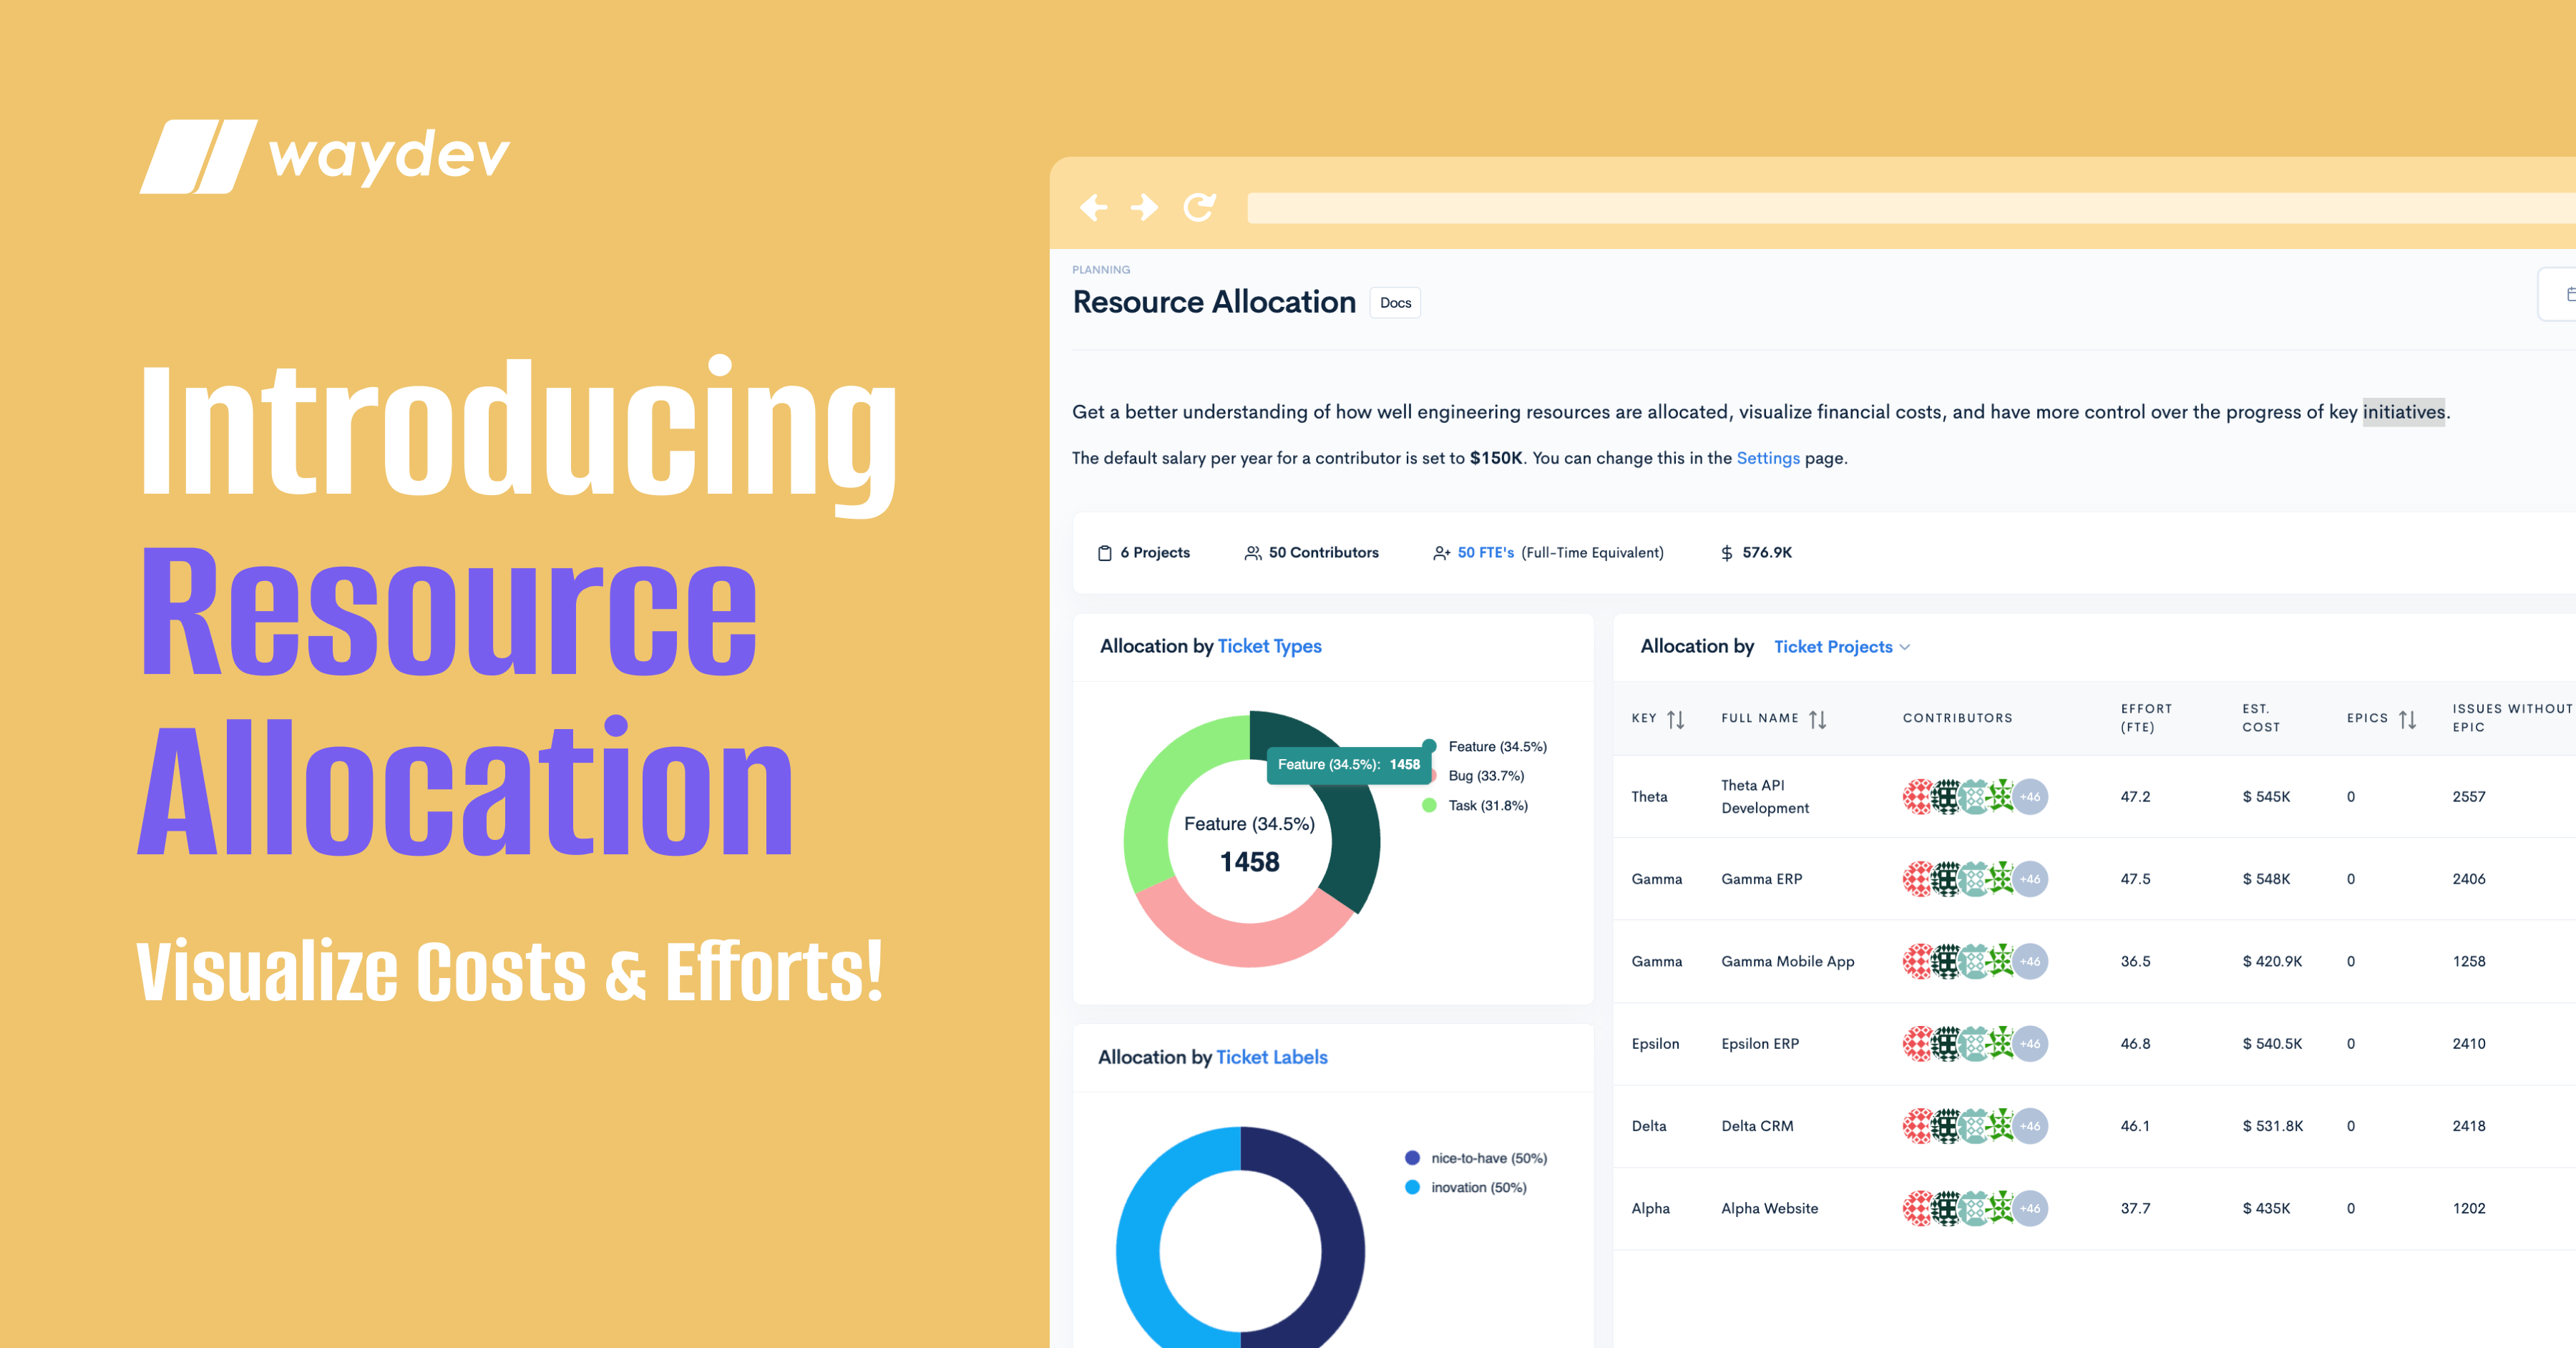

Engineering leaders make hundreds of decisions every quarter, and one of the most important questions has always been the hardest to answer. Most teams still answer it with spreadsheets, gut feeling, or static reports that lag a quarter behind reality. By the time the problem shows up in a report, the budget is spent and the roadmap has already slipped.
Today that changes. Waydev is introducing Resource Allocation, a capability that gives leaders a clear, continuously updated view of how engineering effort and cost are distributed across initiatives, products, epics and teams. It is the missing link between strategy and execution.
In short. Resource Allocation pairs effort visibility in FTE with cost transparency from real salary data, in one view, built from the issue tracking, Git and contributor data you have already connected. No manual tagging, and no extra work for engineers.
Why Resource Allocation matters
Engineering is one of the largest investments in any organization, and it is usually the least legible one. That creates blind spots that surface late and cost a lot:
- Projects quietly absorbing more effort than planned
- Teams working on priorities that have drifted from leadership intent
- High-cost areas going unnoticed until the budget is already blown
- Roadmaps slipping because resources are misaligned rather than insufficient
- No defensible way to explain engineering decisions to Product, Finance or the board
Resource Allocation closes those gaps by putting effort and cost in the same view, updated from live data instead of a quarterly reconstruction.

How Resource Allocation works
Waydev brings together data from your issue tracking system, Git provider and contributor metadata to show where engineering investment actually goes. Everything updates automatically from sources you have already connected.
Effort allocation
See how engineering time is distributed across initiatives, products, epics and teams, measured in FTE, the unit that represents the workload of one full-time engineer.
Cost allocation
Map salary data to real work so effort becomes actual cost, rather than an average spread evenly across every team.
Trends over time
Spot shifts while they are still small: maintenance load creeping up, incident work growing, or an initiative expanding well beyond its original scope.
Drill-down clarity
Move from a company-level allocation view down to an individual ticket without losing the context you started from.

Inside the report
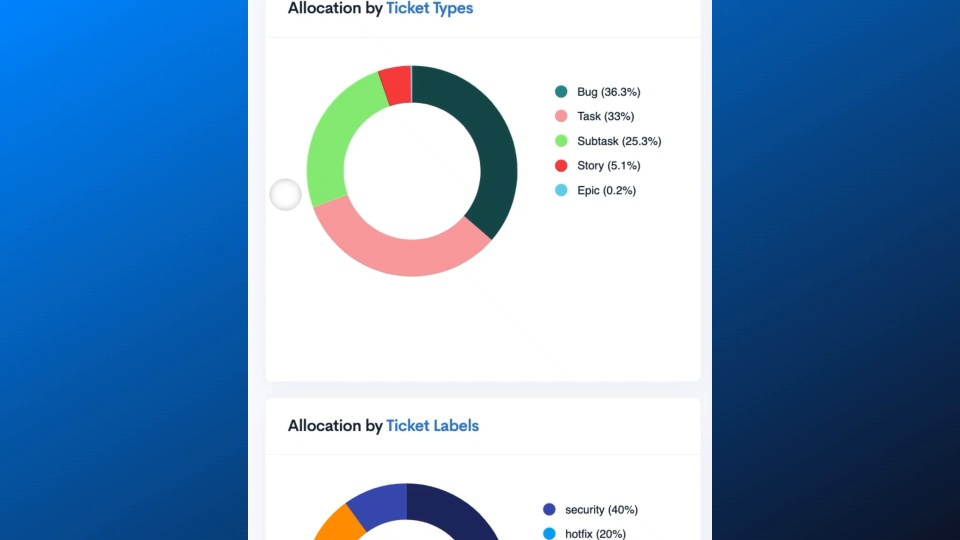
Allocation by ticket type and label
Break down the volume and share of resources going to each ticket type and label, then adjust priorities on the evidence rather than the impression. Categories are yours to define, so the report speaks the language your organization already uses for work.
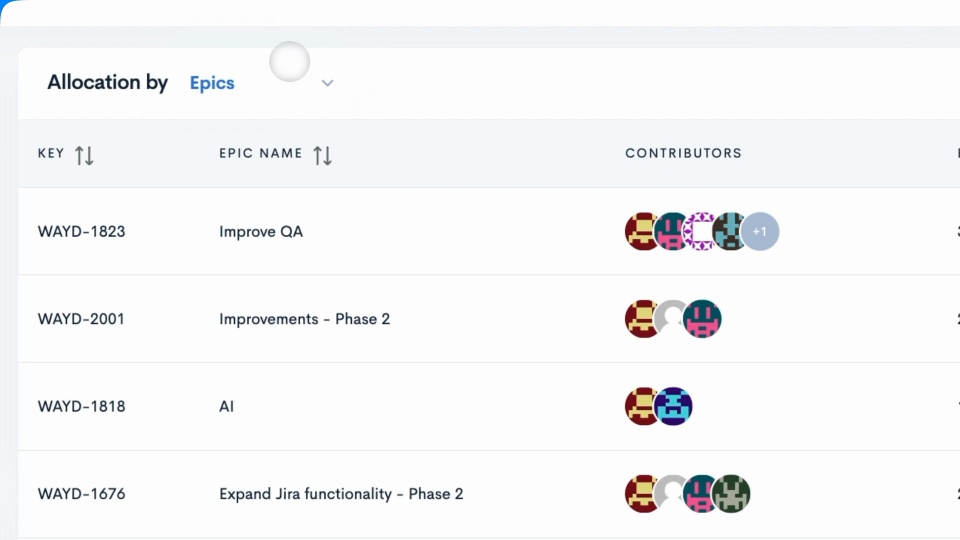
Project and epic breakdowns
See FTEs and estimated cost for each project at a glance, then drill into individual epics to monitor progress and prioritize. For every breakdown you can explore ticket count, FTE allocation, percentage share, contributors involved, estimated cost and last activity. Every table is customizable, and every row is explorable down to the ticket.
Turning effort into cost, automatically
Resource Allocation combines effort data with contributor salaries to produce true engineering cost per epic, project or initiative.
- A default salary is applied out of the box, so the report is useful before you configure anything
- Salaries can be set per contributor in settings
- Bulk salary imports are supported via CSV, using email, salary and name columns
The result is a financial model of engineering built on real execution rather than assumptions. If you also need to separate capitalizable work for accounting, Cost Capitalization runs on the same data, while Project Costs and Resource Planning extend the model into forward planning.
See it in action
Walk through the report yourself.
Who this is for
| Role | What Resource Allocation gives you |
|---|---|
| CTOs and VPs of Engineering | A financial view of engineering that matches how teams actually work, ready for the board conversation |
| Engineering Managers | Early warning on resource drains, balanced workloads, and evidence behind resourcing requests |
| Product Leaders | The true cost and effort behind each roadmap item, before the next planning cycle commits to it |
| Finance and Operations | Engineering spend aligned to business outcomes continuously, not reconstructed at quarter end |
From black box to business clarity
For the first time, engineering can answer the questions Sales and Marketing answer every day:
- How much are we spending on this product line?
- Which initiatives consume the most effort?
- Are we investing enough in innovation, or too much in maintenance?
- Where should we add resources, and where should we pull them back?
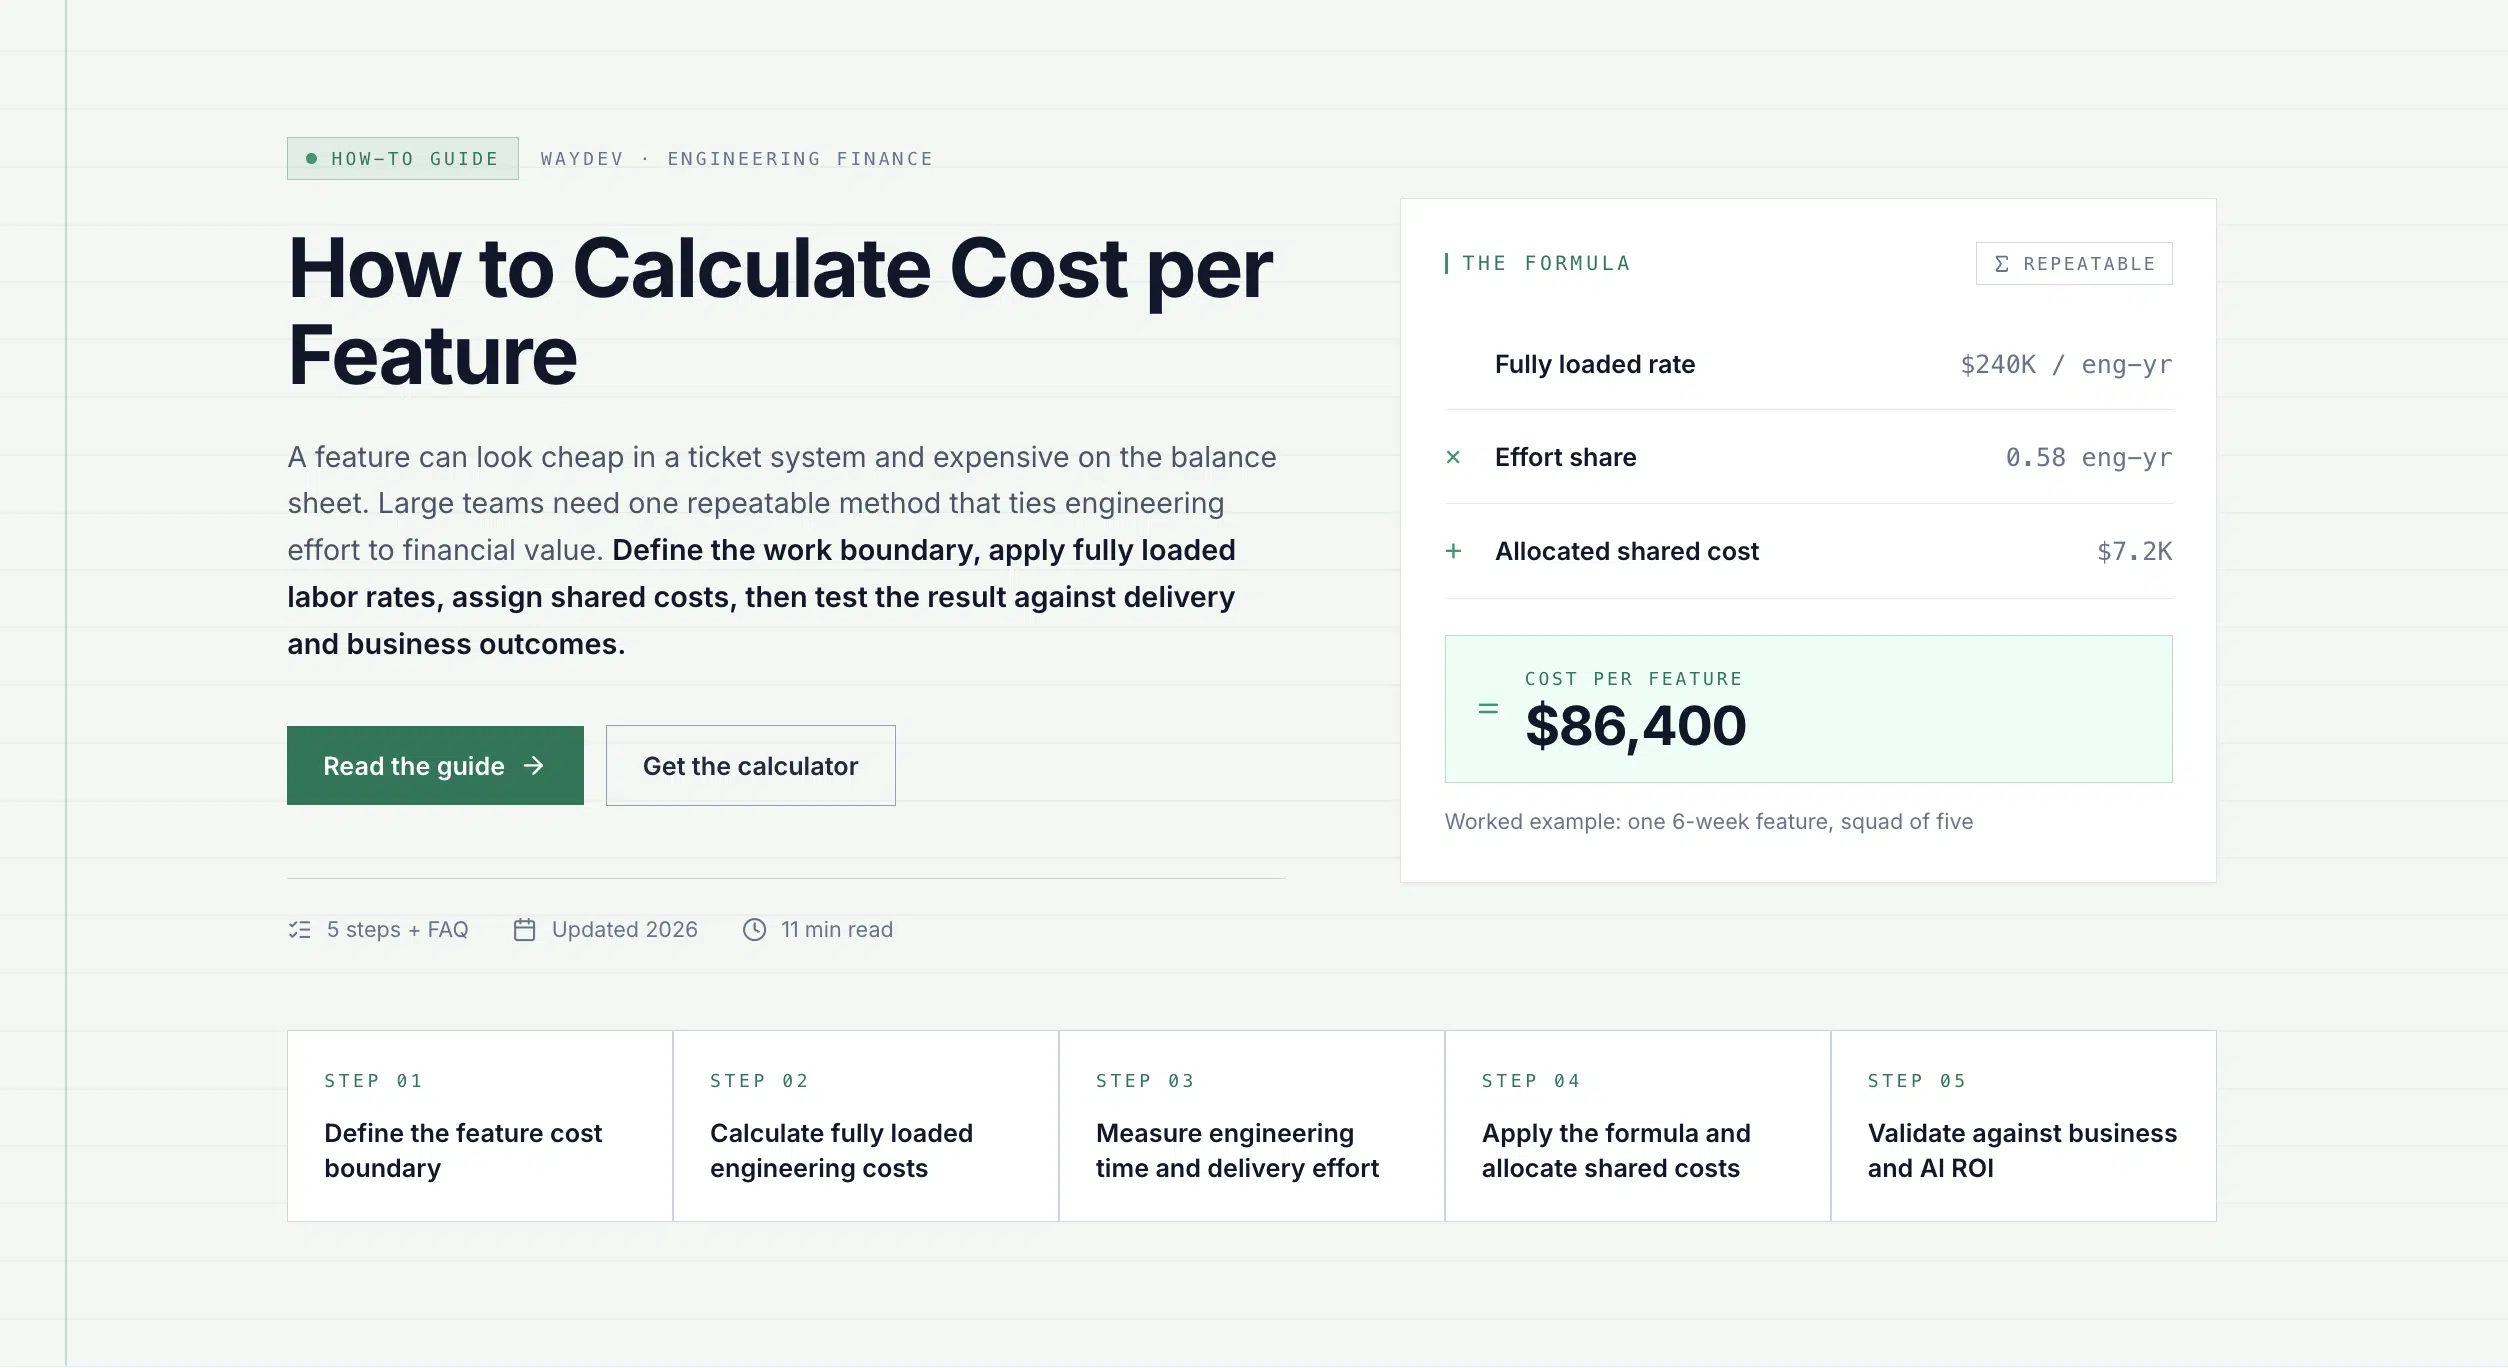
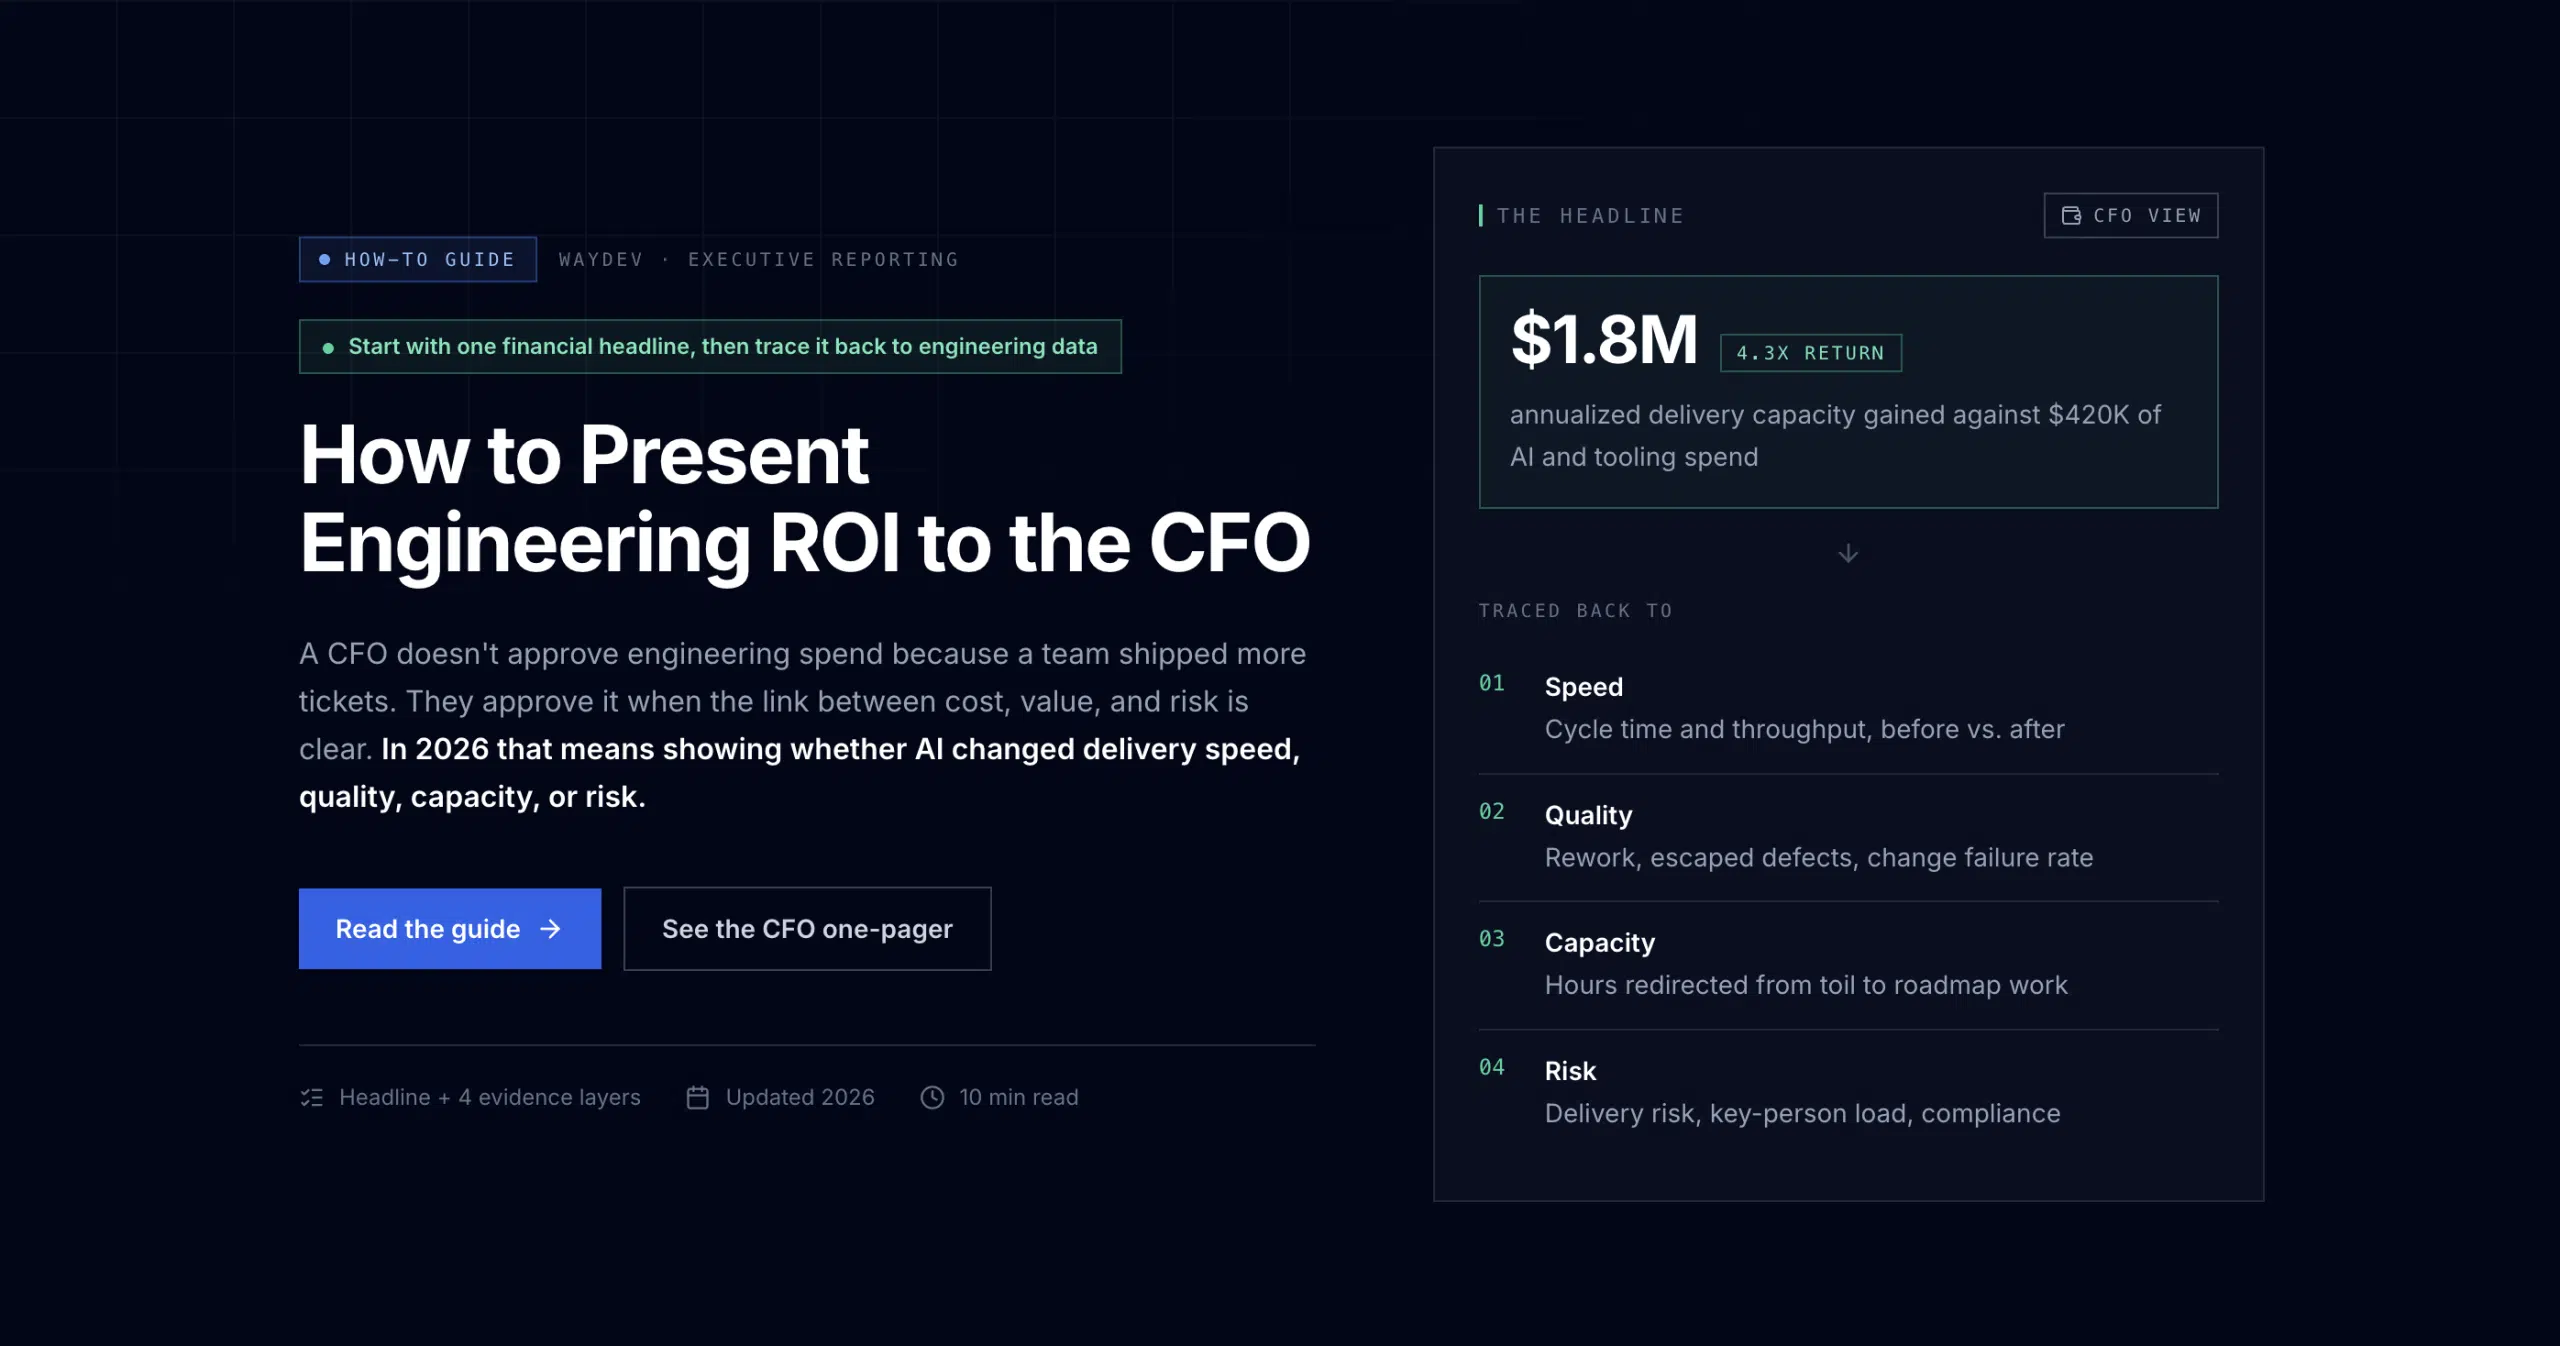
With Resource Allocation those answers come from real data. For a deeper walkthrough of the reporting side, read how to calculate cost per feature and how to present engineering ROI to the CFO.
Questions
Does Resource Allocation require manual tagging?
No. The report is built from issue tracking, Git and contributor data already flowing into Waydev. You define allocation categories once, and the report populates from there.
What is FTE in this context?
FTE, or full-time equivalent, is a unit representing the workload of one full-time employee. It lets you compare effort across initiatives of very different sizes without counting tickets or story points.
Where do the salary numbers come from?
Waydev applies a default salary so the report works immediately, and you can override it per contributor in settings or import salaries in bulk from a CSV. Salary data is used only to convert effort into estimated cost.
How granular can I go?
From company-level allocation categories down to ticket types, labels, epics, projects and individual tickets, with FTE, percentage share, contributors, estimated cost and last activity at each level.
How is this different from Resource Planning?
Resource Allocation shows where effort and cost went. Resource Planning uses the same model to look forward, helping you decide where capacity should go next. Most leaders run them together.
Engineering, finally explained
Engineering is no longer measured only on delivery. It is measured on impact, efficiency and accountability, and every one of those conversations eventually needs a number attached to it.
Resource Allocation is not another report. It is the foundation for better planning, faster decisions, and a stronger line between what engineering builds and what the business gets back.