Waydev Core 4 is now Waydev Core Metrics. The name changed because the model did: a fifth dimension, AI Adoption, now sits alongside Effectiveness, Speed, Quality, and Impact, so the same unified dashboard that connected code-level activity to business outcomes now also shows whether your AI tooling is part of that story or separate from it.
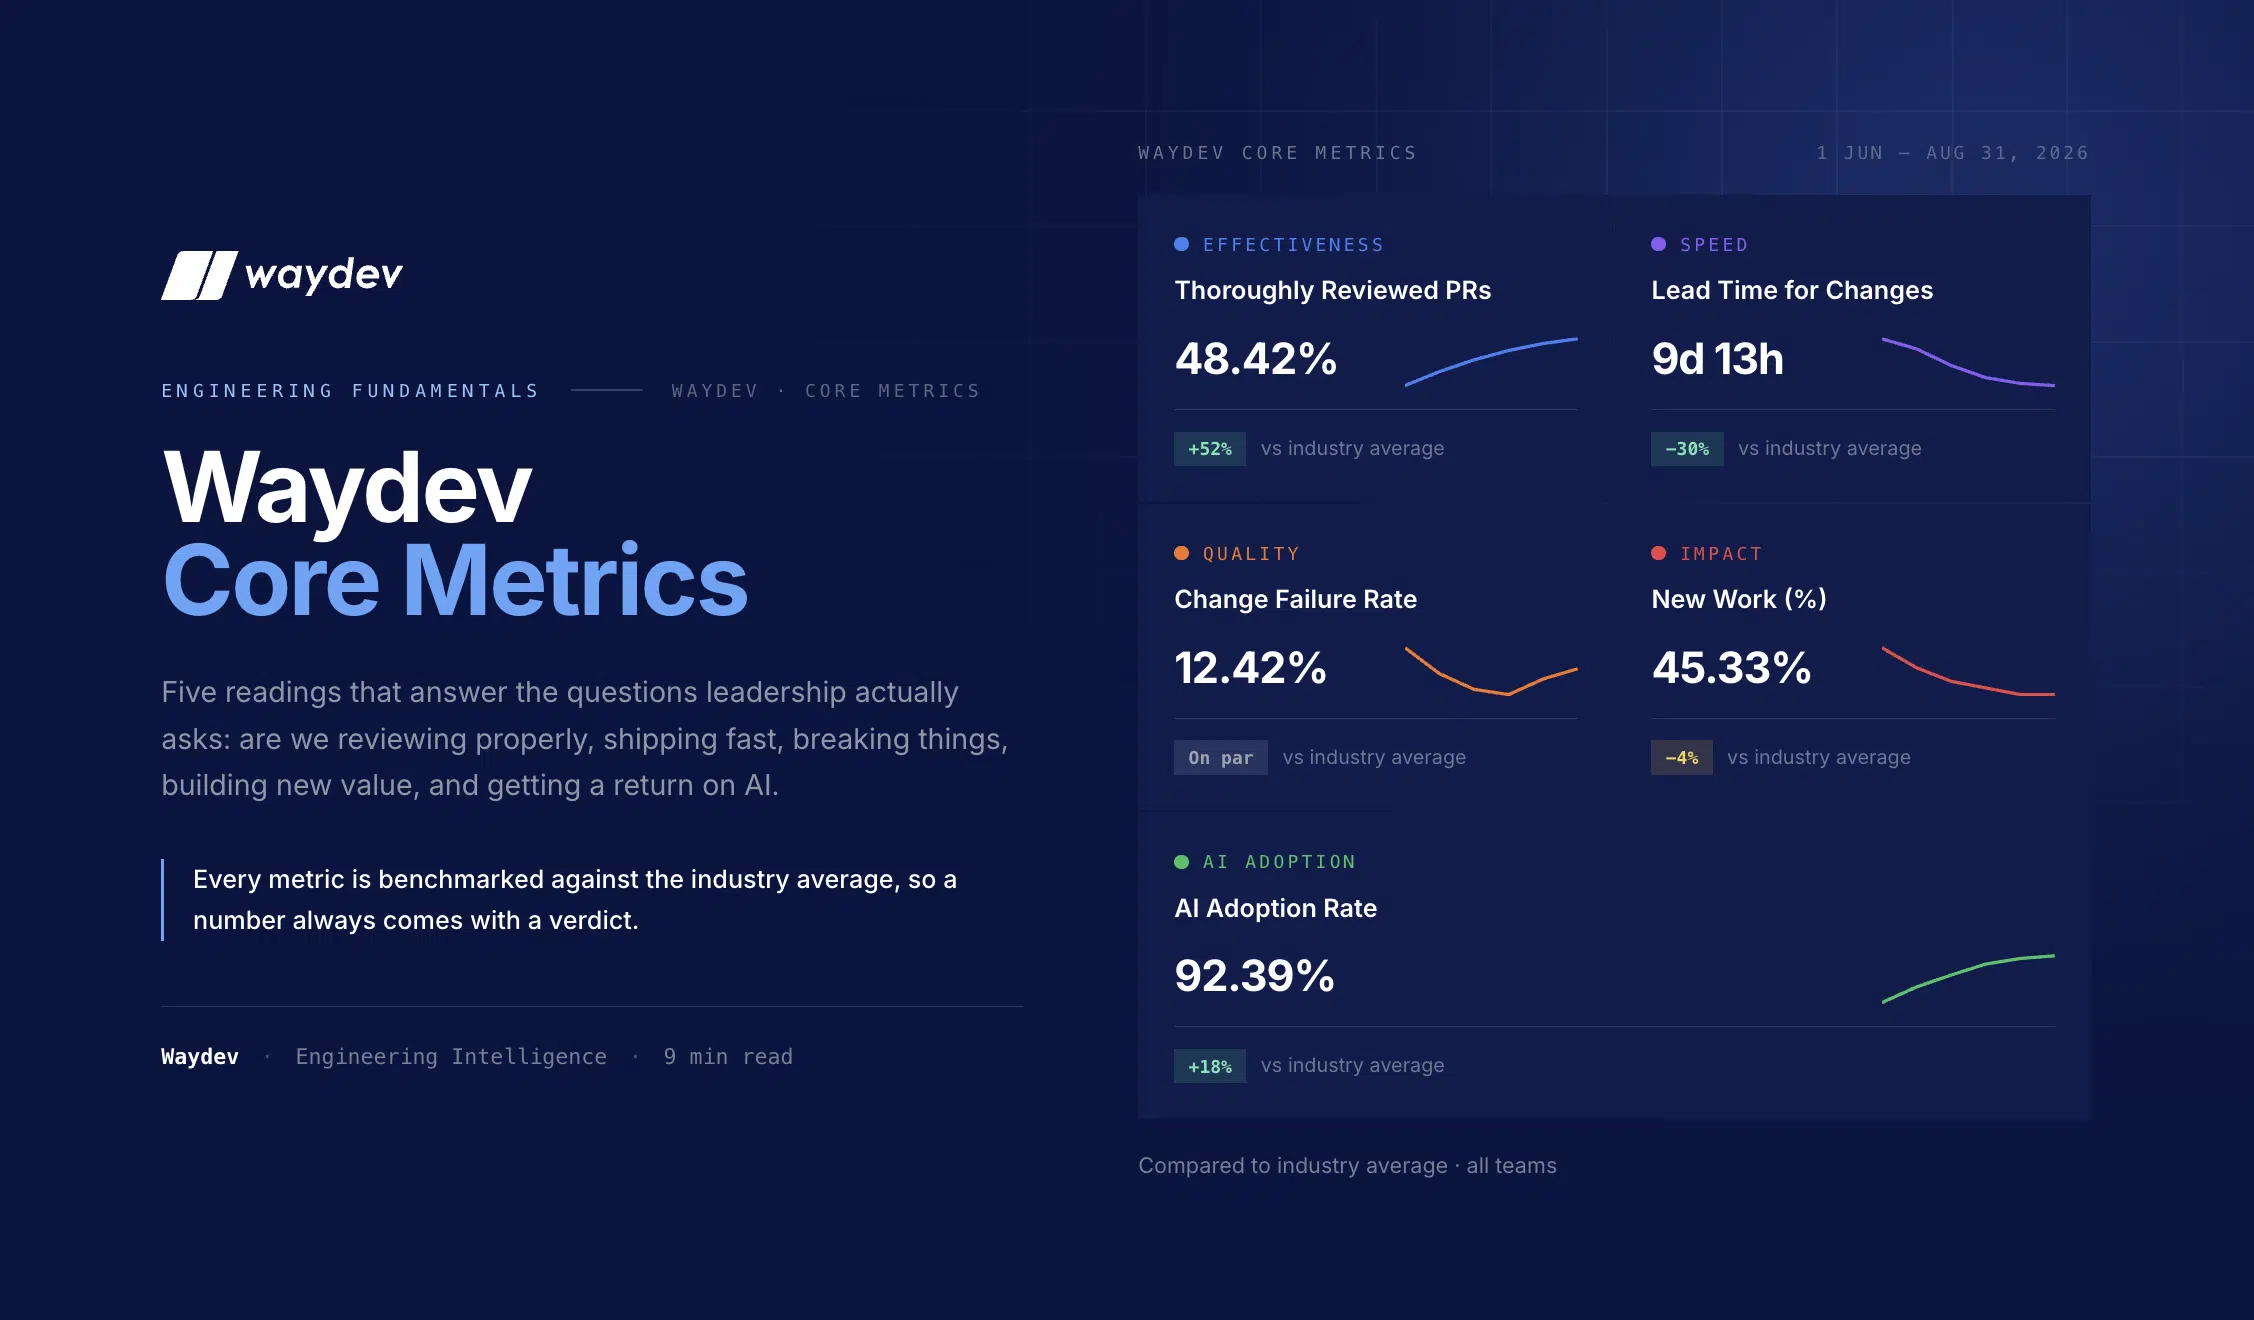
Waydev Core Metrics, five readings compared against the industry average for the same period. Figures shown are illustrative, matching the reference dashboard for 1 June to 31 August 2026.
TL;DR: Waydev Core Metrics consolidates DORA, SPACE, and DevEx research with AI adoption data into one model. It benchmarks your teams against P50, P75, and P90 industry percentiles across five dimensions, effectiveness, speed, quality, impact, and AI adoption, and ships alongside Hygiene 2.0 for drill-down analysis at Group, Team, or Nested Team level.
Waydev Core engineering effectiveness is now measured across five dimensions: effectiveness, speed, quality, impact, and AI adoption. Waydev Core Metrics is the unified model that combines all five into a single dashboard, built on the same DX Core 4™ framework developed by Nicole Forsgren and the DX research team, extended with the AI adoption layer engineering leaders have been asking for since coding assistants became standard equipment. If your team has struggled to connect code-level activity to business outcomes, and now to AI spend, this is where that gap closes.
The framework organizes insights into five core dimensions that reflect how engineering teams actually operate day to day.
Measures how consistently code changes go through review. It reflects team collaboration, communication, and quality discipline, read through the share of pull requests that get a thorough review rather than a rubber stamp.
Tracks the pace of work from commit to production, giving leaders clarity on delivery efficiency and time-to-value. This is Lead Time for Changes, read as a trend rather than a single snapshot.
Monitors the frequency of deployments that fail or require a fix, showing how reliable and stable the delivery process really is. This is Change Failure Rate, and it is the dimension most worth reading next to Speed rather than alone.
Measures the amount of new value-creating work teams deliver versus maintenance or rework, pointing to where innovation is actually happening versus where capacity is quietly going to upkeep.
Tracks how deeply your teams have adopted AI coding tools, benchmarked against the same industry percentiles as the other four. Adoption alone isn’t the full picture, but it’s the number every other AI question starts from, and it now lives in the same model as the delivery metrics it eventually affects.
By combining system data with contextual insight, Core Metrics by Waydev lets organizations balance speed with stability and innovation, now with AI tooling read as part of that balance rather than tracked separately. Decisions stay data-driven and outcome-oriented across all five.
Every engineering team wants to know where they stand. To make that transparent, Core Metrics introduces percentile benchmarks that compare performance across the industry, now applied to all five dimensions including AI adoption.
These benchmarks put your data into context, so teams can set meaningful goals and actually recognize measurable progress instead of guessing at what “good” looks like.
Shipping alongside Core Metrics is Hygiene 2.0, rebuilt from the ground up for deeper, more flexible analysis. You can now filter insights at Group, Team, or Nested Team level for detailed performance reviews and targeted improvement rather than one organization-wide number that flattens every team into the same read.
Every graph is interactive: click any metric to see the exact unlinked PRs behind it. Tracing a performance pattern, finding a process gap, or verifying that a workflow is actually aligned with what the team says it does is faster now than it has ever been in the platform.
Five dimensions, one model, benchmarked against the same industry data. That’s the whole idea behind the rename.
Waydev Core Metrics is live now on the platform’s launch page. See how your teams perform across all five dimensions, benchmarked against the industry, in one dashboard.
Connect your repositories and get effectiveness, speed, quality, impact, and AI adoption benchmarked against P50, P75, and P90 in one view.
See It In ActionOr schedule a demo call first.
Ready to unlock your SDLC productivity?