




DORA metrics have been the shared language of software delivery performance for nearly a decade. Deployment frequency, lead time for changes, change failure rate, and time to restore service gave engineering leaders a compact way to answer a hard question: are we actually getting better at shipping software?
That question has changed. AI coding assistants and agents are now writing a meaningful share of production code, and the delivery pipelines DORA was designed to describe are absorbing a volume of change they were never tuned for. The four metrics still matter. What has shifted is how you interpret them, what they can no longer tell you on their own, and how they connect to the question every CFO is now asking: what are we getting for our AI spend?
This guide covers what each DORA metric measures, how AI adoption changes the signals, and how the WAY Framework turns DORA data into a complete, auditable account of engineering performance in the AI era.
01 · the fundamentalsA quick refresher on the four metrics
Deployment frequency
How often you release to production. The most visible signal of speed, and the easiest to misread: shipping often says nothing about whether releases survive contact with users.
Lead time for changes
Commit to production. Dominated by process, not coding speed: review queues, approval chains, and release gates account for most of the elapsed time.
Change failure rate
The share of deployments needing a hotfix, rollback, or incident response. The counterweight to velocity, and the metric most vulnerable to gaming.
Time to restore service
How fast you recover when a change fails. The most honest of the four: it reflects the system under stress, not on a good week.
The first two describe throughput and the second two describe stability. The core finding of the original DORA research, published in the book Accelerate by Nicole Forsgren, Jez Humble, and Gene Kim, was that elite teams do not trade one for the other. They ship faster and break less, because the same practices drive both: small batches, strong automation, fast feedback loops.
02 · the shiftWhy AI is pulling throughput and stability apart
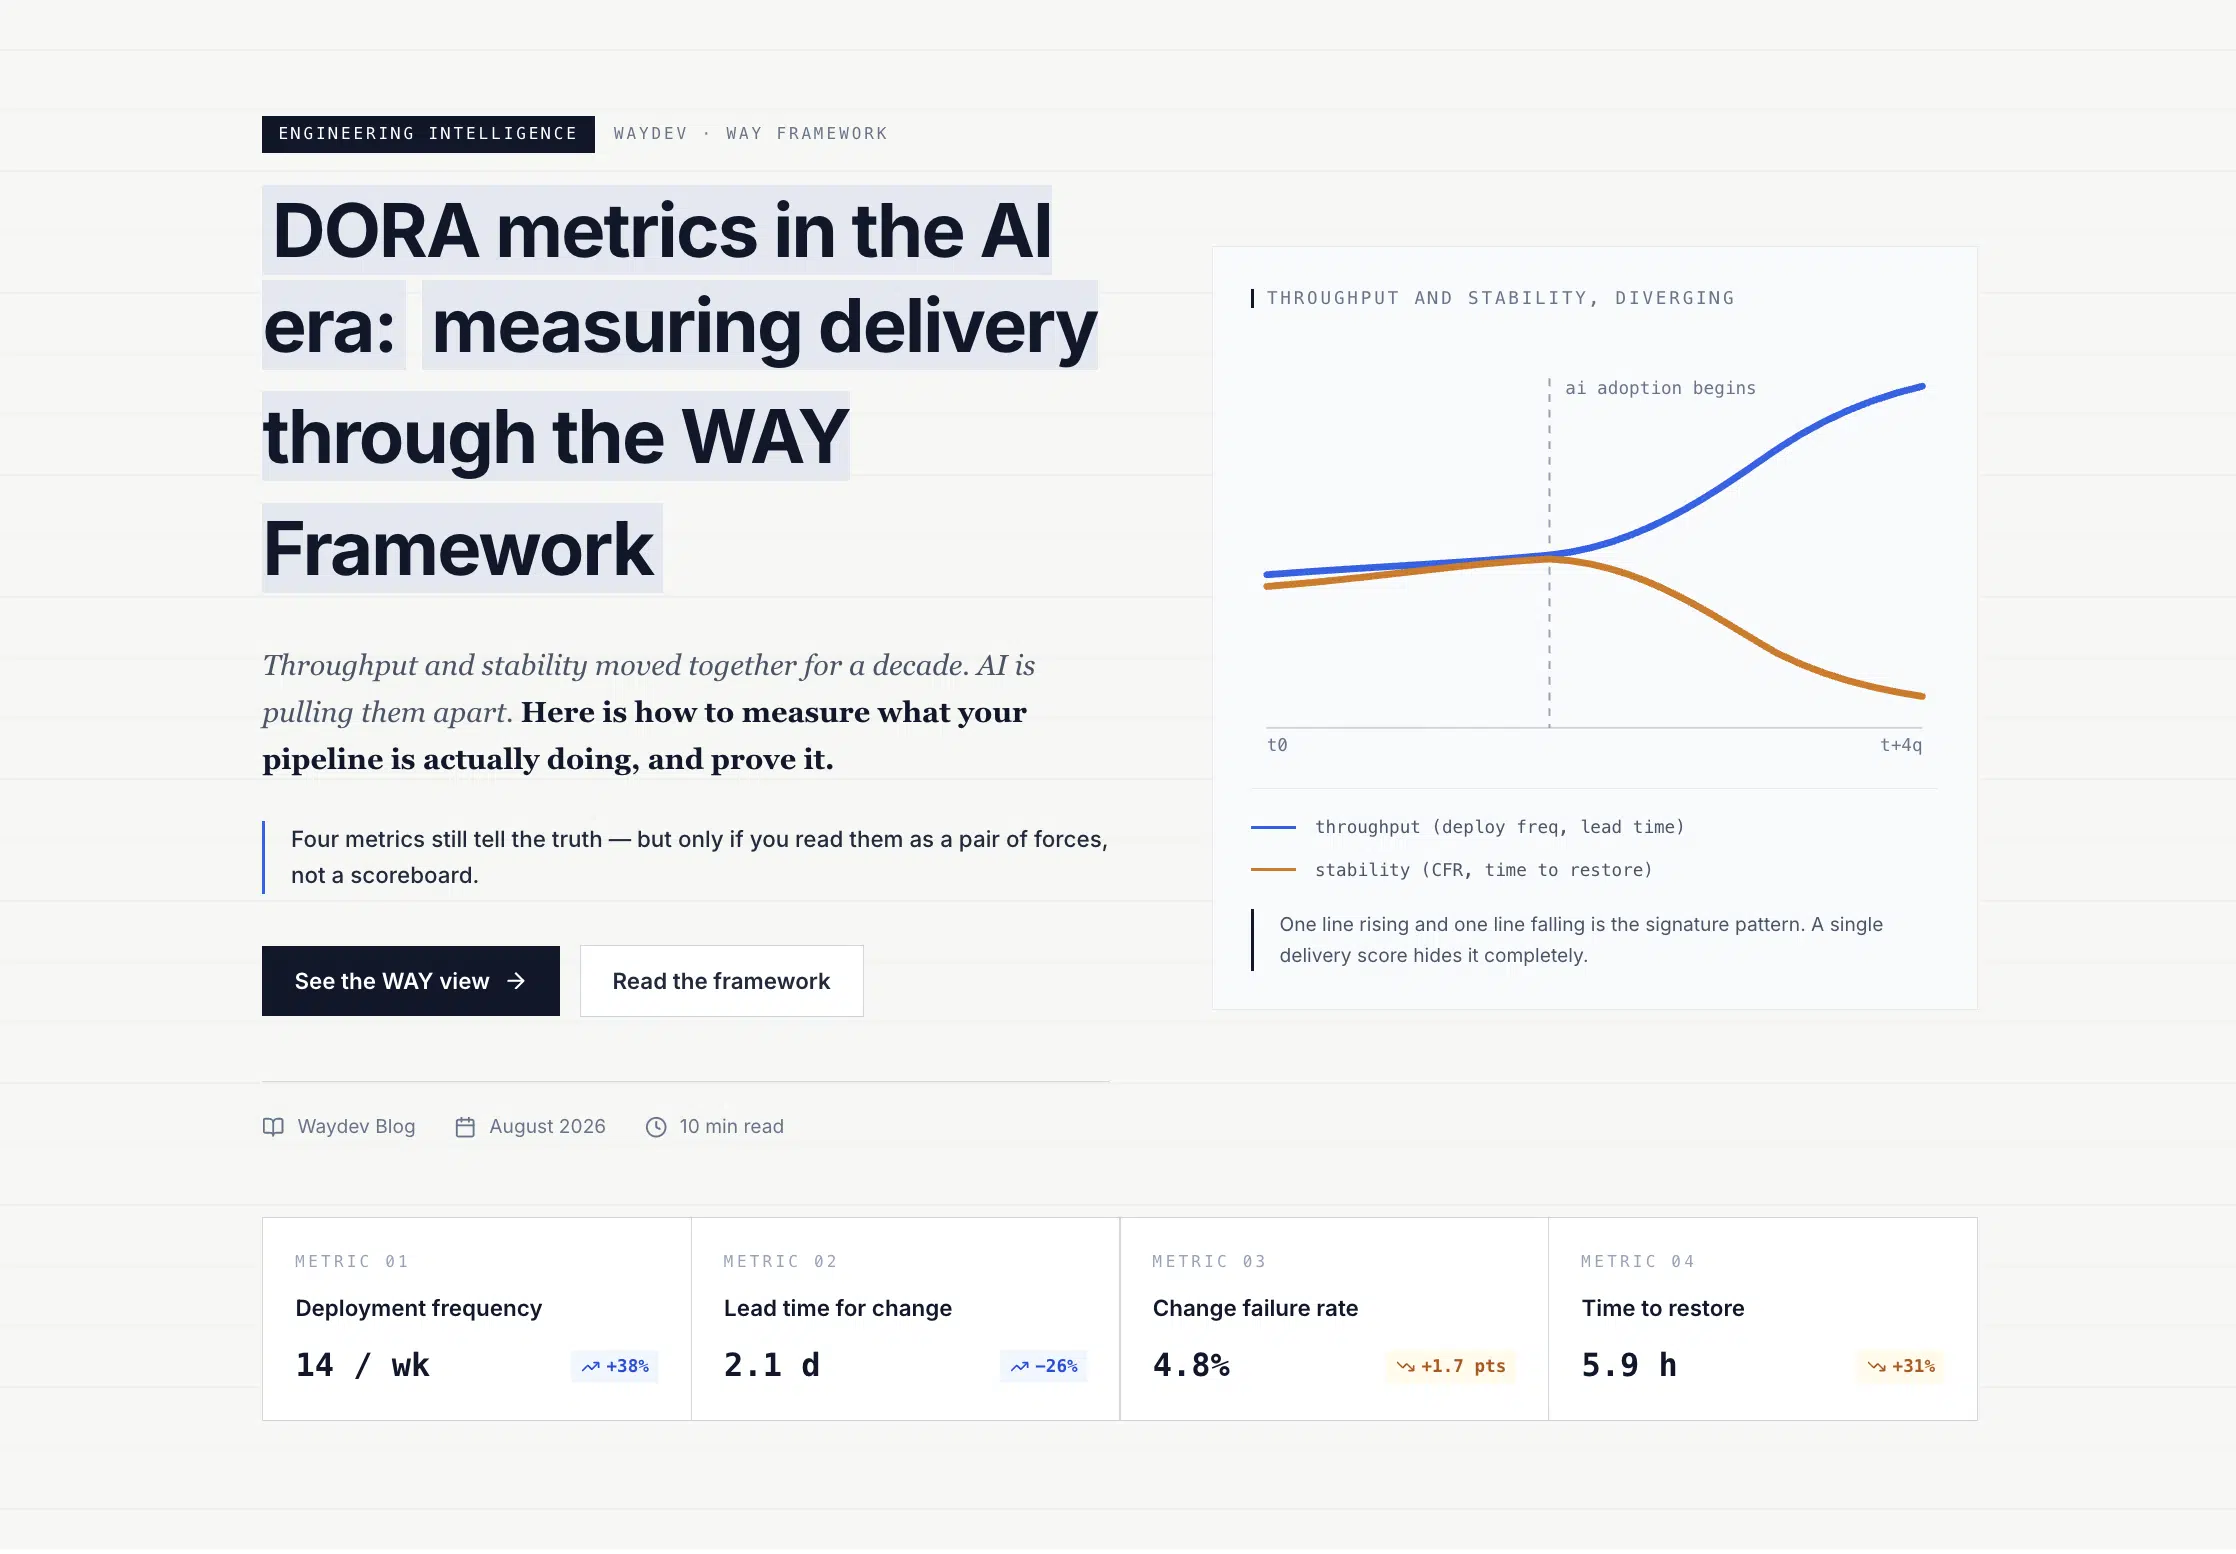
For years, throughput and stability moved together. AI-assisted development is the first widely adopted practice that visibly pushes them in opposite directions.
The pattern shows up consistently in DORA’s recent research on generative AI: individual developers get faster and report higher effectiveness, while team-level delivery stability declines. The gains at the keyboard are real. The instability downstream is just as real.
The mechanism is not mysterious. Every generated change still needs review, testing, and judgment, and that effort does not disappear. It relocates downstream, into review queues and validation steps that were provisioned for a much lower volume of change. When generation gets cheap and verification stays expensive, the bottleneck moves, and the first place it shows up in your data is a rising change failure rate sitting next to a rising deployment frequency.
There is a second effect layered on top. When developers can produce more code faster, batch sizes creep upward. Larger changes are harder to review, harder to test, and more likely to fail, which is exactly the dynamic the original DORA research warned against. AI does not break the small-batch principle. It just makes it much easier to abandon without noticing.
None of this means AI adoption is failing. DORA frames the transition as a J-curve: an early period where productivity dips and instability rises, followed by compounding gains once the surrounding system catches up. The organizations that get hurt are not the ones that hit the dip. They are the ones whose leadership did not expect the dip, read it as failure, and cut funding halfway through the transition.
03 · the gapWhat DORA metrics cannot tell you about AI
Your DORA dashboard can tell you that change failure rate rose 20 percent last quarter. It cannot tell you whether AI-generated code caused it, which teams are absorbing AI well and which are drowning in review load, or whether the money you spent on AI tooling is producing anything the business can bank.
That gap exists because DORA measures the pipeline, not the inputs flowing into it. It was designed for a world where humans wrote all the code and the only question was how efficiently the system moved that code to production. In the AI era there is a new variable upstream of every metric, and DORA has no native way to see it.
This is the gap the WAY Framework was built to close.
04 · the frameworkThe WAY Framework: measuring DORA when AI writes the code
WAY stands for Work-first, Agnostic, Yours. It is a meta-framework: it does not replace DORA, SPACE, or experience metrics, it defines the conditions any measurement has to meet before you can trust it in the AI era. Applied to DORA, each principle changes how you collect and read the four metrics.
Work-first: measure what happened, not what people say happened
Survey-based measurement asks developers to estimate how much time AI saved them this week. Those answers are honest, and they are also unreliable, because humans are poor at estimating their own time and because self-reported gains rarely survive contact with delivery data.
A work-first approach grounds every DORA metric in the system of record where work actually happens. Deployment frequency comes from real releases, not release plans. Lead time comes from real timestamps, not recollection. And critically, AI involvement is detected in the work itself, at the commit and pull request level, rather than inferred from license lists or survey answers.
This is what makes segmentation possible, and segmentation is the entire game. Change failure rate as a single number tells you the system is stressed. Change failure rate split by AI-assisted versus conventional changes, by team, by adoption depth, tells you where the stress comes from and what to fix. Without work-level data, you are debating opinions. With it, you are reading evidence.
Agnostic: measure across every tool, or the picture lies
Most AI vendors will happily show you a dashboard of their own tool’s impact. The problem is that no engineering organization uses one tool. Copilot sits next to Cursor, which sits next to Claude Code, which sits next to internal agents, and developers move between them fluidly. A measurement layer owned by any single vendor sees a fraction of the picture and has an obvious incentive to flatter it.
An agnostic approach measures AI’s effect on DORA metrics independently of which assistant produced the code. That neutrality matters for two reasons. First, accuracy: the verification tax and batch-size inflation are properties of AI-assisted work in general, not of any one tool, and you can only see them across the whole surface. Second, decision quality: when renewal time comes, you want to compare tools on the same delivery outcomes, measured by a party with no seat in the race.
Yours: the data has to survive an audit
The third principle is the one regulated enterprises feel most acutely. When a bank or insurer presents AI ROI to a board, a regulator, or an internal audit function, “the vendor’s dashboard said so” is not a defensible answer. The evidence trail needs to be owned by the organization, methodologically transparent, and reproducible: this spend produced this usage, which changed these delivery metrics, which translated into this financial outcome.
DORA metrics are a load-bearing layer of that trail because they are the accepted industry standard for delivery performance. Anchoring your AI impact story in DORA gives it a vocabulary auditors and executives already recognize. The WAY Framework’s contribution is making sure the numbers underneath that vocabulary are yours: sourced from your systems, segmented by your teams, and defensible without anyone else in the room.
05 · the stackPutting it together: DORA inside the three pillars
In practice, DORA metrics slot into a three-layer measurement stack, and each layer answers a different executive question.
License counts are not adoption. An organization can pay for 2,000 seats while meaningful usage concentrates in 300 engineers. Work-first adoption data shows usage depth by team and workflow, which is the denominator every impact claim depends on.
This is where DORA lives. Deployment frequency, lead time, change failure rate, and restore time, segmented by AI involvement and adoption level, measured agnostically across every tool. This layer separates “our metrics moved” from “AI moved our metrics.”
Reclaimed hours, avoided hiring, and faster time to market on the value side. Licenses, infrastructure, enablement, and the modeled J-curve dip on the cost side. A credible model also prices the instability itself: failed deployments and incident hours are a tax that offsets throughput gains.
Read bottom to top, the stack is an audit trail. Read top to bottom, it is a management system.
When the ROI number disappoints, the impact layer shows which teams and workflows are underperforming, and the adoption layer shows whether the problem is usage or effectiveness.
06 · the rolloutRolling out DORA metrics without breaking your culture
The fastest way to destroy the value of DORA metrics is to point them at individuals. These are system-level measures. Used to rank developers, they stop describing reality within a quarter, because people are excellent at optimizing whatever number their review depends on.
A few principles hold up in practice. Measure teams against their own history, not against each other, because a platform team and a mobile team have structurally different deployment profiles. Never present a throughput metric without its stability counterweight, because deployment frequency alone is an incentive to ship recklessly. Make the verification load visible: if review time and PR cycle time are climbing alongside AI adoption, that is your verification tax showing up in the data, and it belongs in capacity planning rather than retro notes. And forecast the J-curve before the dashboards go live. A stability dip that leadership was told to expect reads as a transformation on schedule. The same dip arriving unannounced reads as a crisis.
Start small. Pick the two metrics with the largest gap against where you want to be, instrument them well from Git and CI/CD data, and expand from there. A measurement program that tracks two things reliably beats one that tracks eleven things nobody trusts.
07 · the bottom lineDORA did not stop working. The system changed underneath it.
Throughput and stability, which moved together for a decade, are now being pulled apart by the largest shift in how software gets written since version control, and the four metrics alone cannot explain why.
The WAY Framework is how you make DORA answer the new question. Ground the metrics in the work itself so AI’s fingerprints are visible in the data. Measure across every tool so the picture is complete and no vendor grades its own homework. Own the evidence trail so the numbers survive a board meeting, an audit, or a regulator.
Do that, and the J-curve stops being a threat to your budget and becomes what it actually is: a forecastable cost of a transition that pays for itself on the other side.