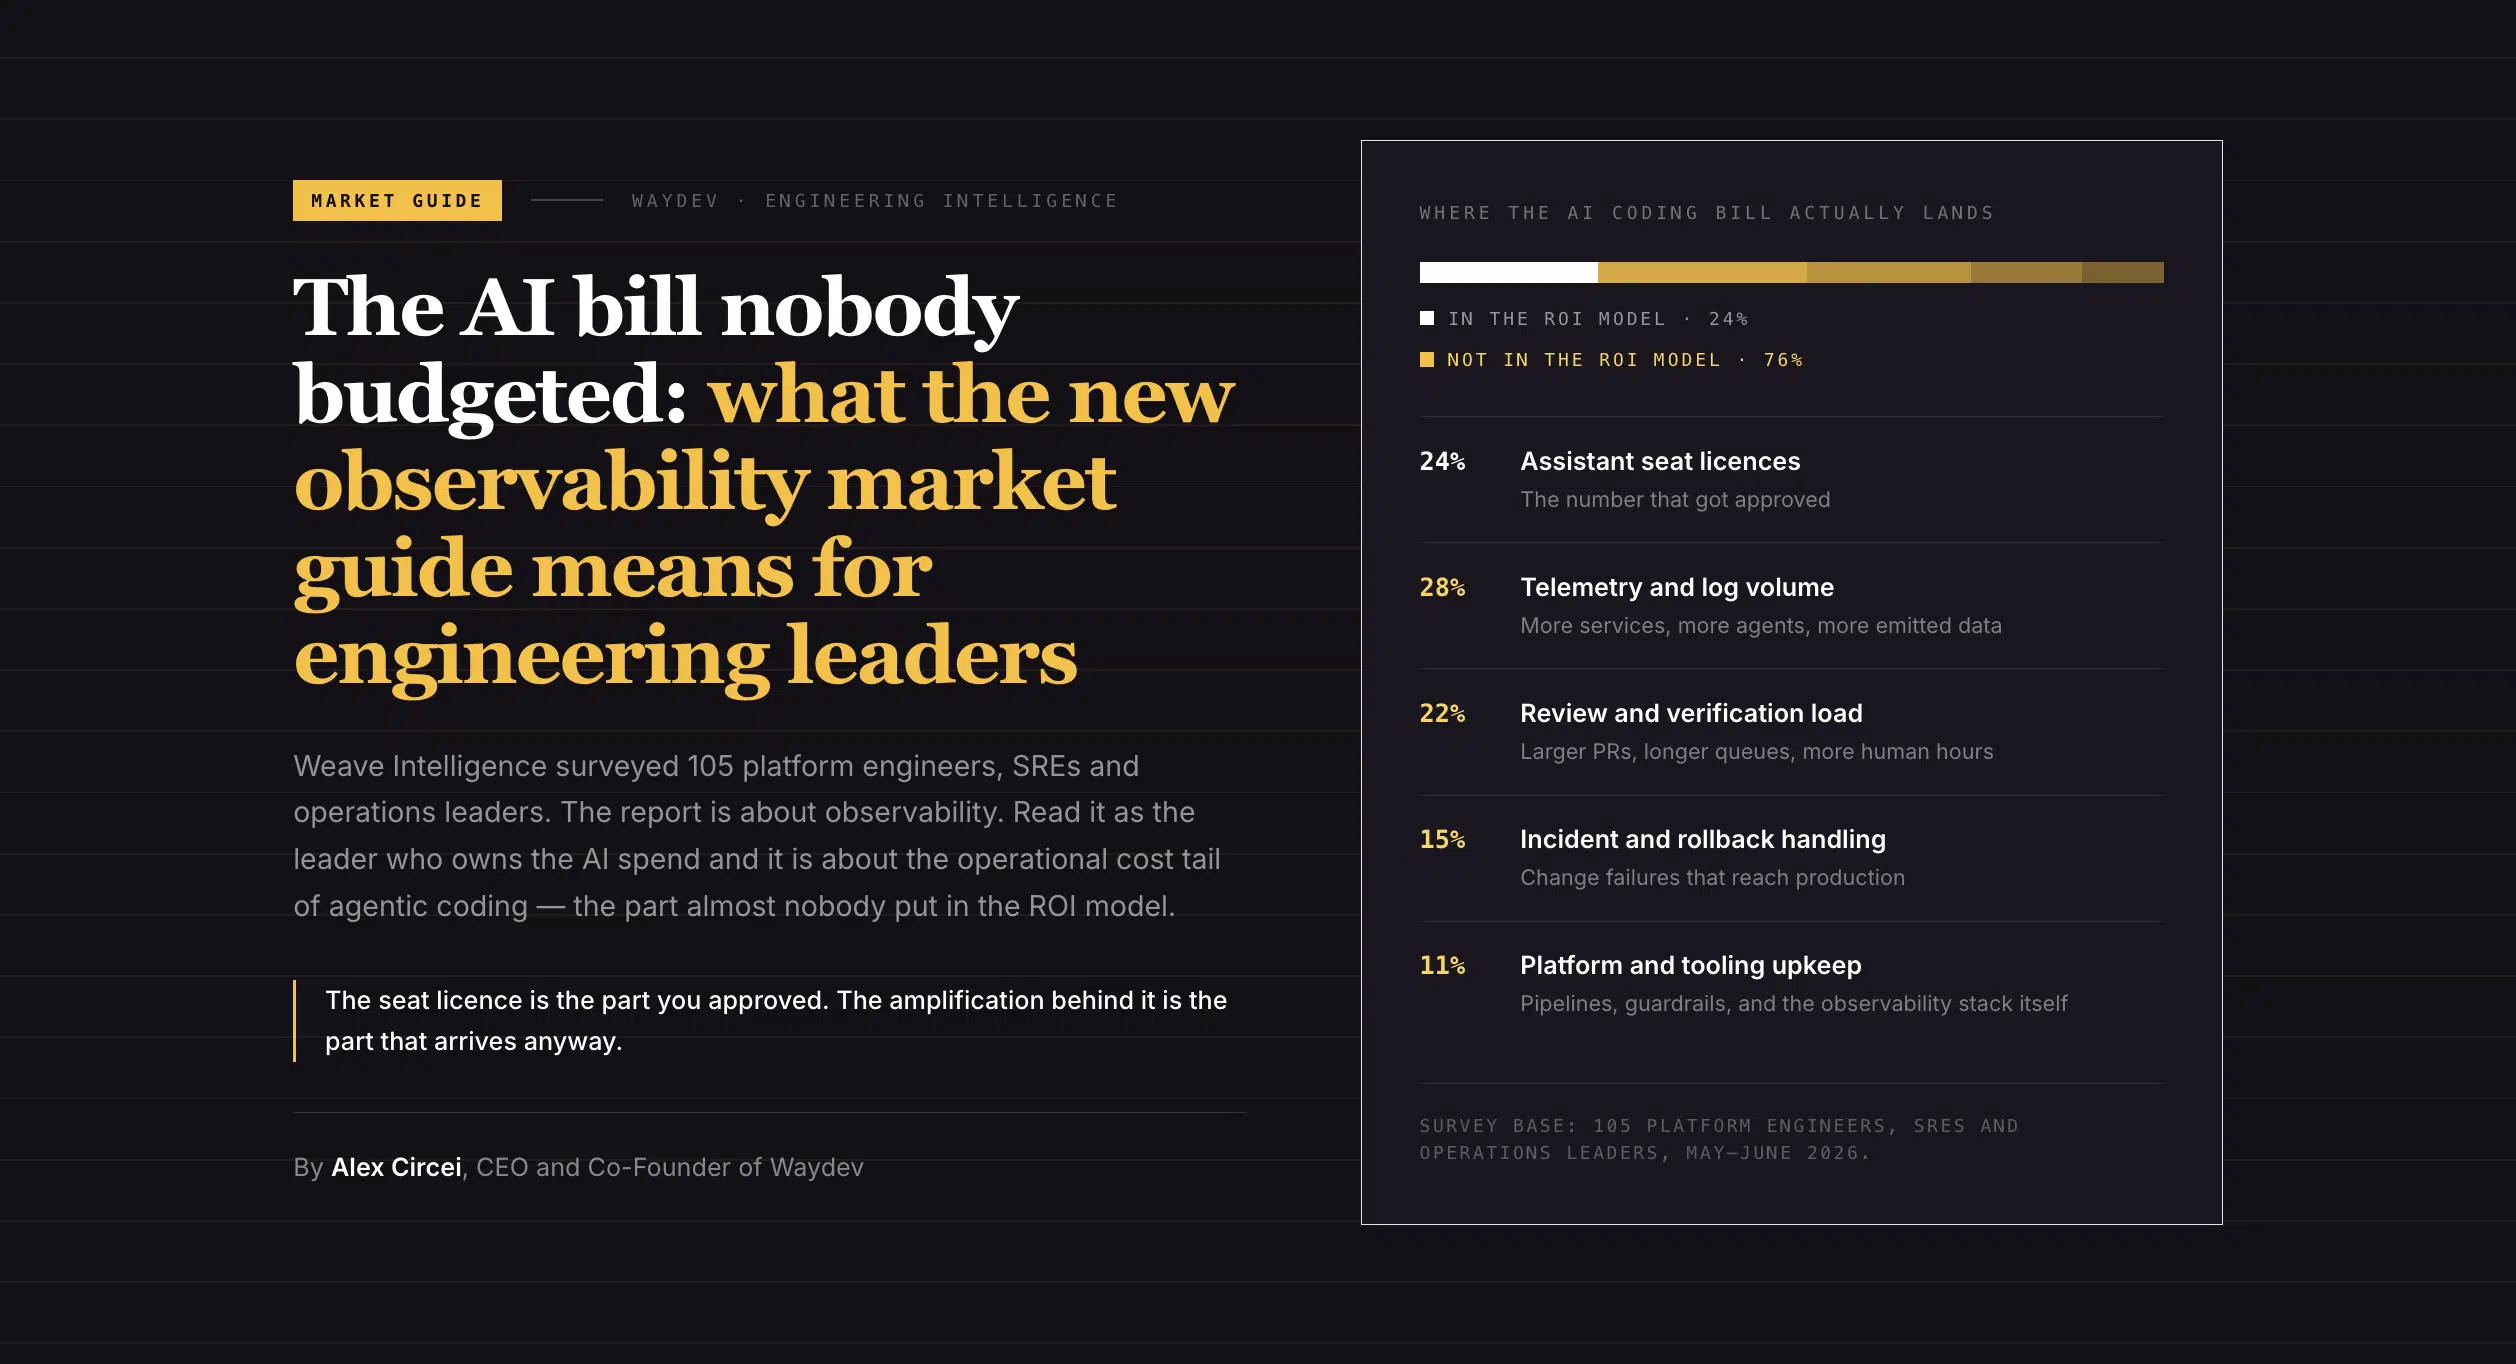
By Alex Circei, CEO and Co-Founder of Waydev
Weave Intelligence published its first market guide on observability in platform engineering, built on a survey of 105 platform engineers, SREs and operations leaders fielded in May and June. Luca Galante summarised it in Platform Weekly with a Jaws meme and the line that we are going to need a bigger boat. He is right, and the reason should worry anyone who signed an AI coding budget this year.
The report is about observability. But read it as an engineering leader who owns the AI spend and it is really about something else: the operational cost tail of agentic coding, which almost nobody has put in their ROI model.
Three numbers from the guide, and they compound on each other.
Figure 1
Three multipliers hitting a flat budget
Annual growth in telemetry volume, against IT budgets that are not moving. This gap predates AI. It is the baseline everything else lands on top of.
Telemetry thrown off by a single LLM query compared with a standard application log event. Every agent you put in production is also a telemetry generator.
Query load from an AI SRE chasing ten to twelve hypotheses at once, against endpoints designed for a human working one hypothesis at a time.
Source: Weave Intelligence, Market Guide for Observability Trends in Platform Engineering, 2026. Chart by Waydev.
The response so far is mostly not a response. Around 27% of teams are simply absorbing rising vendor costs with no structural mitigation, and only about a third have put a pipeline or edge-sampling approach in place. Meanwhile the guide cites one European retailer that moved tail sampling inside its own environment, cut spans by more than twentyfold and saved $2.6 million a year in egress alone. The gap between those two postures is the whole story.
Buried in the middle of the guide is a sentence that should have led it. Organizations that have adopted agentic coding heavily are already seeing measurable increases in incident rates, because they are shipping more code without a matching increase in observability coverage.
That is not an observability finding. That is a change failure rate finding, and it arrives on the same invoice as the productivity gain everyone is celebrating.
This is exactly what the DORA metrics were built to catch. Throughput goes up, change failure rate goes up behind it, time to restore stretches, and the net effect on delivered value is somewhere between positive and negative depending on numbers most teams are not collecting. If you are reporting an AI productivity gain to your board without a stability metric next to it, you are reporting half a result. We wrote about why the four keys need reframing for this era in DORA metrics in the AI era.
Two charts from the survey set the context. The first is on instrumentation. OpenTelemetry has effectively won, and the reason is now as much about machines as about vendor lock-in: LLMs are trained on OTel documentation and semantic conventions, so an agent investigating an incident knows where to look, provided those conventions are enforced.
Figure 2
Current approach to OpenTelemetry instrumentation
The second is on philosophy. Shift-down means the platform absorbs instrumentation entirely: auto-injected agents, default dashboards, managed pipelines, nothing for the developer to remember. Shift-left leaves developers owning their own instrumentation and SLOs, which is a reasonable model right up until agents start deploying services faster than any human can keep pace with.
Figure 3
Observability philosophy for 2026
Aspiration is running well ahead of execution. Nearly half say shift-down, yet 39% report that adding instrumentation still costs them more than a day of feature-to-production time, and only 18% have automated more than half of their observability work.
Figure 4
Biggest cultural blocker to owning observability as a platform capability
Galante makes the sharpest point in his write-up: nobody in the interviews said they needed to hire people with these skills, because essentially nobody has them yet. This is a paved road that has not been paved. It is also the clearest example I have seen of a pattern that shows up everywhere in AI adoption right now. The capability gap is not in the tooling. It is in the operating practice around the tooling, and no purchase order closes it.
The chart that stopped me is the one on what teams running generative AI in production actually watch.
Figure 5
Primary observability focus areas for teams deploying LLMs
Token spend is the most watched signal at 44%. Session-level tracing, the thing that tells you whether the agent actually resolved the user’s problem across a full interaction, sits at 19%. So the most common AI measurement in production is the one that tells you what you spent, and the least common is the one that tells you whether it worked.
I have made this argument about engineering AI adoption for a year and it is the same mistake in a different domain. Counting usage is easy, counting outcomes is work, and the easy number becomes the reported number. It is how organizations end up with consumption leaderboards instead of impact measurement.
| Missing line | Where it actually lands |
|---|---|
| Telemetry cost of new services | Agents create services faster than humans do, and every service carries a recurring observability bill. That growth is attributed to the platform budget, not to the coding tool that caused it. |
| Incident and rework cost | Rising incident rates where agentic coding is heaviest. It shows up as change failure rate and time to restore, months after the throughput gain was reported. |
| Agent query load on your own endpoints | An AI SRE running parallel hypotheses can multiply query load by two orders of magnitude. That is infrastructure spend created by an AI decision and booked somewhere else entirely. |
None of this is an argument against agentic coding. It is an argument for measuring it honestly. The right unit is not seats or tokens, it is cost per accepted change, with the operational tail included. Once you price it that way, pipeline-layer controls and shift-down instrumentation stop looking like platform hygiene and start looking like the thing that determines whether your AI investment nets out positive.
Plot your telemetry spend against your service creation rate for the last four quarters. If the second line bent when agentic coding rolled out, you have found an AI cost that is currently attributed to the wrong budget.
Split change failure rate and incident volume by AI-assisted work share. If teams with the highest AI-assisted share also have the worst stability trend, that is your real ROI conversation, and it is a fixable one.
Audit the pipeline before the agents scale, not after. Tail sampling, null field removal and real-time cardinality monitoring are cheap now and structurally hard to retrofit once agentic workloads are in production.
Put one stability metric next to every AI productivity number that reaches your board. Not as a caveat, as a column.
We do not do observability. Weave Intelligence is mapping the plane that collects and routes telemetry; we sit a layer up, in the engineering intelligence that reads delivery, quality and AI impact out of your existing systems. The two questions meet at the same place: what did the AI actually change, and what did the change cost.
That is the whole shape of the WAY Framework. Work-first, Agnostic, Yours. It measures the work itself from system data, it combines DORA, SPACE, Core 4 and the AI measurement research rather than replacing them with a proprietary index, and the vocabulary stays yours if you leave us. On the AI question specifically we keep adoption, impact and ROI as three separate measurements, for exactly the reason Figure 5 illustrates. Collapse them into one score and you get a token counter with ambitions.
The takeaway
Agentic coding does not just produce code. It produces services, telemetry, incidents and query load, all of which arrive with a bill attached. Any ROI model that stops at the tool subscription is measuring the cheapest part of the decision.
The Market Guide for Observability Trends in Platform Engineering runs to about fifty pages and covers the capability taxonomy, the vendor landscape organized by architecture rather than market share, and five recommendations for platform teams. It was written by Florian Lipp, Dilek Altin and Luca Galante at Weave Intelligence, and the survey was run independently with no vendor sponsorship, which is worth saying out loud in a market where most research is paid for by someone in it. If you want the short version first, Galante covers the highlights in Platform Weekly.
One caution the authors make themselves and I will repeat: 105 respondents is directional, not representative. Treat the percentages as a read on where practitioner attention is going, then check the pattern against your own data. Which is, conveniently, the entire argument of this article.
Check the pattern against your own data
Our playbook for measuring AI adoption, impact and ROI covers the metrics, the operating model, and a 90-day plan to a board-ready ROI story, including the operational costs most models leave out.
Keep reading: DORA metrics · The WAY Framework · Measuring AI impact on delivery · Measuring AI adoption at scale · AI ROI calculator
Charts in this article were rebuilt by Waydev from survey figures published in the Weave Intelligence Market Guide for Observability Trends in Platform Engineering, 2026, and are credited individually. Waydev is not affiliated with Weave Intelligence.
Alex Circei is CEO and Co-Founder of Waydev, the AI engineering intelligence platform trusted by Fortune 500 companies including American Express, Dropbox and PwC. Waydev has been building Git-first engineering analytics since 2017 and holds a USPTO patent in Git analytics.
By Alex Circei, CEO and Co-Founder of Waydev
Weave Intelligence published its first market guide on observability in platform engineering, built on a survey of 105 platform engineers, SREs and operations leaders fielded in May and June. Luca Galante summarised it in Platform Weekly with a Jaws meme and the line that we are going to need a bigger boat. He is right, and the reason should worry anyone who signed an AI coding budget this year.
The report is about observability. But read it as an engineering leader who owns the AI spend and it is really about something else: the operational cost tail of agentic coding, which almost nobody has put in their ROI model.
Three numbers from the guide, and they compound on each other.
Figure 1
Three multipliers hitting a flat budget
Annual growth in telemetry volume, against IT budgets that are not moving. This gap predates AI. It is the baseline everything else lands on top of.
Telemetry thrown off by a single LLM query compared with a standard application log event. Every agent you put in production is also a telemetry generator.
Query load from an AI SRE chasing ten to twelve hypotheses at once, against endpoints designed for a human working one hypothesis at a time.
Source: Weave Intelligence, Market Guide for Observability Trends in Platform Engineering, 2026. Chart by Waydev.
The response so far is mostly not a response. Around 27% of teams are simply absorbing rising vendor costs with no structural mitigation, and only about a third have put a pipeline or edge-sampling approach in place. Meanwhile the guide cites one European retailer that moved tail sampling inside its own environment, cut spans by more than twentyfold and saved $2.6 million a year in egress alone. The gap between those two postures is the whole story.
Buried in the middle of the guide is a sentence that should have led it. Organizations that have adopted agentic coding heavily are already seeing measurable increases in incident rates, because they are shipping more code without a matching increase in observability coverage.
That is not an observability finding. That is a change failure rate finding, and it arrives on the same invoice as the productivity gain everyone is celebrating.
This is exactly what the DORA metrics were built to catch. Throughput goes up, change failure rate goes up behind it, time to restore stretches, and the net effect on delivered value is somewhere between positive and negative depending on numbers most teams are not collecting. If you are reporting an AI productivity gain to your board without a stability metric next to it, you are reporting half a result. We wrote about why the four keys need reframing for this era in DORA metrics in the AI era.
Two charts from the survey set the context. The first is on instrumentation. OpenTelemetry has effectively won, and the reason is now as much about machines as about vendor lock-in: LLMs are trained on OTel documentation and semantic conventions, so an agent investigating an incident knows where to look, provided those conventions are enforced.
Figure 2
Current approach to OpenTelemetry instrumentation
The second is on philosophy. Shift-down means the platform absorbs instrumentation entirely: auto-injected agents, default dashboards, managed pipelines, nothing for the developer to remember. Shift-left leaves developers owning their own instrumentation and SLOs, which is a reasonable model right up until agents start deploying services faster than any human can keep pace with.
Figure 3
Observability philosophy for 2026
Aspiration is running well ahead of execution. Nearly half say shift-down, yet 39% report that adding instrumentation still costs them more than a day of feature-to-production time, and only 18% have automated more than half of their observability work.
Figure 4
Biggest cultural blocker to owning observability as a platform capability
Galante makes the sharpest point in his write-up: nobody in the interviews said they needed to hire people with these skills, because essentially nobody has them yet. This is a paved road that has not been paved. It is also the clearest example I have seen of a pattern that shows up everywhere in AI adoption right now. The capability gap is not in the tooling. It is in the operating practice around the tooling, and no purchase order closes it.
The chart that stopped me is the one on what teams running generative AI in production actually watch.
Figure 5
Primary observability focus areas for teams deploying LLMs
Token spend is the most watched signal at 44%. Session-level tracing, the thing that tells you whether the agent actually resolved the user’s problem across a full interaction, sits at 19%. So the most common AI measurement in production is the one that tells you what you spent, and the least common is the one that tells you whether it worked.
I have made this argument about engineering AI adoption for a year and it is the same mistake in a different domain. Counting usage is easy, counting outcomes is work, and the easy number becomes the reported number. It is how organizations end up with consumption leaderboards instead of impact measurement.
| Missing line | Where it actually lands |
|---|---|
| Telemetry cost of new services | Agents create services faster than humans do, and every service carries a recurring observability bill. That growth is attributed to the platform budget, not to the coding tool that caused it. |
| Incident and rework cost | Rising incident rates where agentic coding is heaviest. It shows up as change failure rate and time to restore, months after the throughput gain was reported. |
| Agent query load on your own endpoints | An AI SRE running parallel hypotheses can multiply query load by two orders of magnitude. That is infrastructure spend created by an AI decision and booked somewhere else entirely. |
None of this is an argument against agentic coding. It is an argument for measuring it honestly. The right unit is not seats or tokens, it is cost per accepted change, with the operational tail included. Once you price it that way, pipeline-layer controls and shift-down instrumentation stop looking like platform hygiene and start looking like the thing that determines whether your AI investment nets out positive.
Plot your telemetry spend against your service creation rate for the last four quarters. If the second line bent when agentic coding rolled out, you have found an AI cost that is currently attributed to the wrong budget.
Split change failure rate and incident volume by AI-assisted work share. If teams with the highest AI-assisted share also have the worst stability trend, that is your real ROI conversation, and it is a fixable one.
Audit the pipeline before the agents scale, not after. Tail sampling, null field removal and real-time cardinality monitoring are cheap now and structurally hard to retrofit once agentic workloads are in production.
Put one stability metric next to every AI productivity number that reaches your board. Not as a caveat, as a column.
We do not do observability. Weave Intelligence is mapping the plane that collects and routes telemetry; we sit a layer up, in the engineering intelligence that reads delivery, quality and AI impact out of your existing systems. The two questions meet at the same place: what did the AI actually change, and what did the change cost.
That is the whole shape of the WAY Framework. Work-first, Agnostic, Yours. It measures the work itself from system data, it combines DORA, SPACE, Core 4 and the AI measurement research rather than replacing them with a proprietary index, and the vocabulary stays yours if you leave us. On the AI question specifically we keep adoption, impact and ROI as three separate measurements, for exactly the reason Figure 5 illustrates. Collapse them into one score and you get a token counter with ambitions.
The takeaway
Agentic coding does not just produce code. It produces services, telemetry, incidents and query load, all of which arrive with a bill attached. Any ROI model that stops at the tool subscription is measuring the cheapest part of the decision.
The Market Guide for Observability Trends in Platform Engineering runs to about fifty pages and covers the capability taxonomy, the vendor landscape organized by architecture rather than market share, and five recommendations for platform teams. It was written by Florian Lipp, Dilek Altin and Luca Galante at Weave Intelligence, and the survey was run independently with no vendor sponsorship, which is worth saying out loud in a market where most research is paid for by someone in it. If you want the short version first, Galante covers the highlights in Platform Weekly.
One caution the authors make themselves and I will repeat: 105 respondents is directional, not representative. Treat the percentages as a read on where practitioner attention is going, then check the pattern against your own data. Which is, conveniently, the entire argument of this article.
Check the pattern against your own data
Our playbook for measuring AI adoption, impact and ROI covers the metrics, the operating model, and a 90-day plan to a board-ready ROI story, including the operational costs most models leave out.
Keep reading: DORA metrics · The WAY Framework · Measuring AI impact on delivery · Measuring AI adoption at scale · AI ROI calculator
Charts in this article were rebuilt by Waydev from survey figures published in the Weave Intelligence Market Guide for Observability Trends in Platform Engineering, 2026, and are credited individually. Waydev is not affiliated with Weave Intelligence.
Alex Circei is CEO and Co-Founder of Waydev, the AI engineering intelligence platform trusted by Fortune 500 companies including American Express, Dropbox and PwC. Waydev has been building Git-first engineering analytics since 2017 and holds a USPTO patent in Git analytics.
Ready to unlock your SDLC productivity?











