Discussing engineering metrics is often challenging, since different professionals have different perspectives on them. Indeed, managers find it difficult to speak the same language and agree on the KPIs that enable them to showcase their teams’ contribution to the business. As a result, they often dread new, personalized metrics for their jobs and focus more on the old ones, which are easier to explain and quantify, like story points or lines of code. These quantitative indicators create an unhealthy working environment that assesses professionals solely on volume.
In order to identify what the best approach is, we recommend taking a step back and observing the bigger picture. The role of each software engineering team is to enable developers to increase their productivity and maximize their results by offering them a good, viable ecosystem that strives to be secure and bug-free, facilitate growth, optimize efforts, and put the right technical tools and assets at their disposal.
With such complex expectations, as an engineering manager, you should look at the software engineering metrics examples that showcase the quality and quantity of each team’s work and its contribution to the bottom line.
In this context, we recommend that software engineering metrics focus on 4 key pillars: the volume of work, the tasks’ time delivery, the quality of the end result and the actual costs. To touch on all the categories, we will further approach the engineering metrics that matter, while also looking at Agile methodologies, and team morale.
Read further and let’s go through everything, from technical debt, merge request rate, throughput, cycle time, commit to deploy, build time, queue time, engineering overhead to sprint burndown, epic burndown, team velocity, lead time, cumulative flow diagram, escaped bugs and, of course, morale metrics.
By measuring how your department brings value to the business, you contribute to creating a better working environment, where each team aligns to its engineering goals and objectives. This enables professionals to gain focus and optimize their efforts, while helping you, as a manager, to track the progress of both individuals and units of members.
Let’s say, for example, that you wish to compare how remote work impacts a certain engineer’s performance. In this case, you would use KPIs that are relevant, like escaped bugs, instead of focusing on hours worked or bug fixes, which only offer a glimpse into the person’s delivered value.
When you use the right software engineering metrics, you identify in real-time when your software engineering team requires assistance or when a project is jammed. This means that you may mitigate risks before situations escalate and become operational and financial hazards, which leads to significantly smoother processes that your team and other business departments will appreciate.
In General, Metrics can help you identify what aspects are working well, what needs adjustment, and how processes can be refined – for a specific team or broader engineering organization. By leveraging these metrics, you can;
Last, but not least, a good strategy for measuring engineering metrics empowers engineers, as it offers them the right tools and assets to work efficiently, while also making their assessment a transparent one.
Different types of metrics in software engineering are used to measure and assess various aspects of software development and quality. For example, tracking bugs over time shows quality trends, while tracking user loyalty indicates if the software meets customer needs. Careful metric analysis is key for data-driven software improvement and delivering successful digital products. Here are key engineering metrics include:
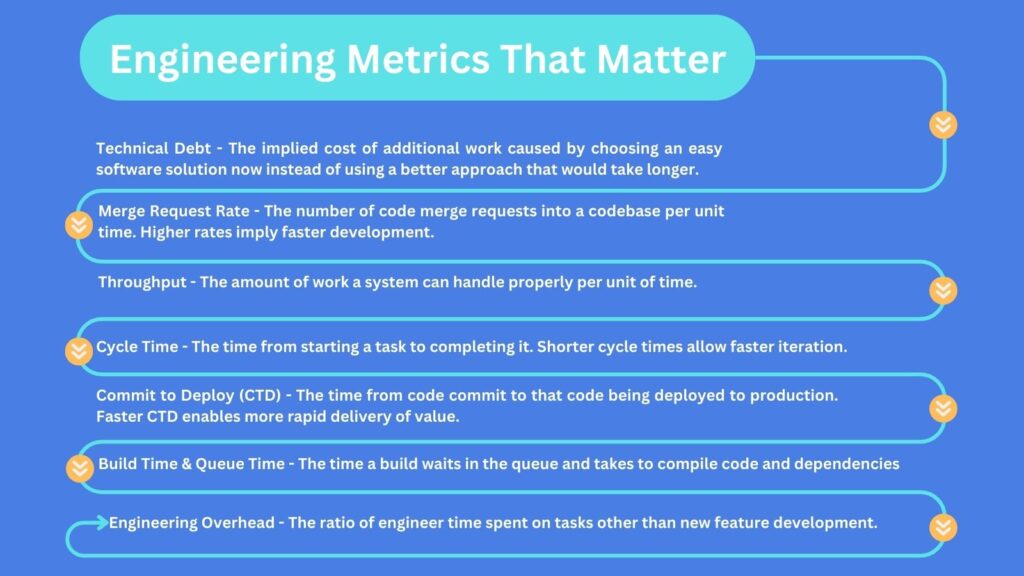
The term “technical debt”, also known as “tech debt” or “code depth”, describes what happens when software developers prioritize client value, delivery deadlines and other project constraints, instead of focusing on delivering the best technical and visual implementation.
By choosing project shortcuts, engineers achieve their goals faster and save resources. Still, on medium- and long-terms, the price paid consists of code that is harder to maintain and which decreases in agility, during the project’s lifespan. This is similar to the concept of financial debt, where people take money in advance, but have to repay the sums later, spending more than what they actually got.
According to D-Zone’s “State of Technical Debt” 2021 report, tech debt is a relevant problem for engineers, with 52% believing that it negatively impacts the team’s morale and 62% stating that it causes bugs, outages and slow downs. Moreover, the average engineer spends almost one day per week solving situations generated by technical debt.
Repaying technical debt may be frustrating, but it is sometimes necessary, since developing new features often requires reworking old code, to ensure it respects updates.
What you need to decide, as an engineering manager, is what level of tech debt is acceptable. Zero might mean that a project will completely stagnate, while a high amount would bring down team morale and complicate processes. Our recommendation is to transform this decision-making process into a conversation which involves team members and business structures.
In terms of reporting, a good way to assess how technical debt impacts your work is by measuring the time spent by engineers on new and old work.
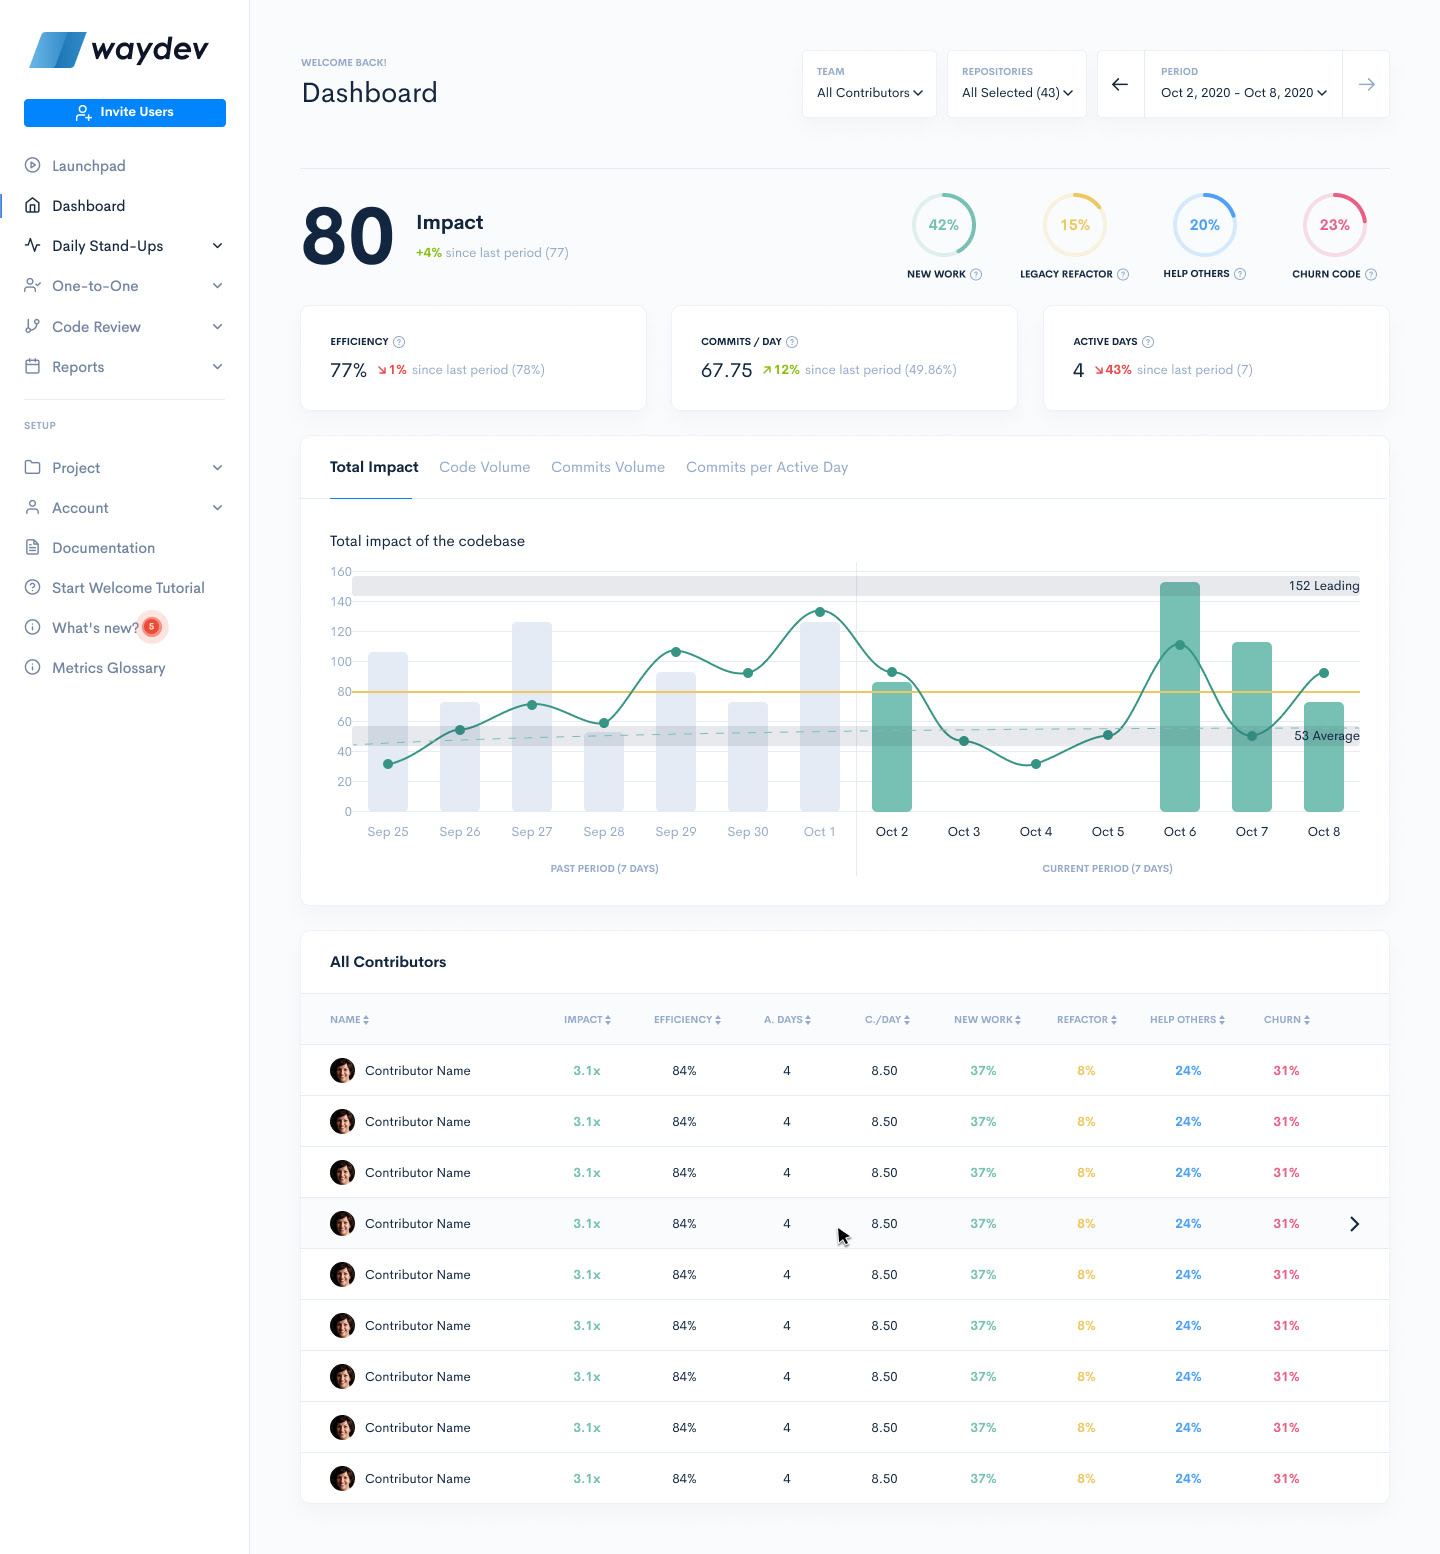
With Waydev, you can now visualize new work activity at team and individual level in a redesigned Work Log where tickets can be color-coded according to their type.
Merge Request Rate measures productivity and efficiency, comparing the monthly number of merge requests associated to a set of projects with the collection of people.
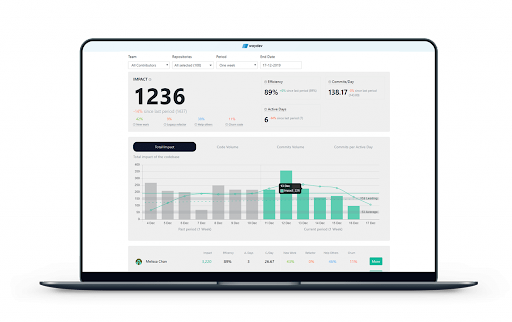
Through the Developer Summary Report, Waydev gives you an overview of each engineer’s work, its engineering performance metrics and output, thus understanding how each team member performs and when they need your support.
Moreover, you always know what is happening with the projects, and may, thus, focus on why things are going a certain way and what needs to be done further.
Throughput represents the number of pull requests which are merged in a certain period of time, usually a week, a month or a quarter. This engineering performance metrics enables you to understand better the volume of work produced, including new code, churn, and refactored code, and measure how different team formats impact performance.
By measuring and constantly comparing throughput, you will assess your team’s work and see how sustainable and healthy the working environment is. The ideal throughput is more or less in the same range from one week to the other. Any highs and lows suggest that there are inconsistencies in the team or in the business, as a whole.
Cycle time focuses on the amount of time spent from when the project starts to when it is delivered. At Waydev, we measure from the first commit, to the point when the feature or product gets sent to production and becomes available to users. Read this article to learn how to optimize this metric and accelerate software delivery using Waydev.
Cycle time is an indicator of velocity, as it focuses on both speed and quality.
Waydev clients benefit from cycle times that are 28% faster than average.
Commit to deploy (CTD) assesses the time it takes for the code to go from commit to deploy, passing through several stages such as testing, QA, and staging. Analyzing how long it takes for code to get through the pipeline enables you to understand what obstacles your team is facing and adjust to them. When using automated testing, projects move from commit to deploy in minutes, even seconds, but, when it comes to manual testing, this often takes longer.
A reduced CTD ensures that features may be deployed at small intervals, ideally daily, and that the team would be fast to solve potential errors and issues.
Build time refers to the time spent preparing tests, as well as running them, and it includes everything from creating the test database, seeding it with data, setting it up and tearing it down between test suites, to ensure that data is kept clean.
Build time is a crucial engineering metric because it calculates direct and indirect losses. Firstly, we have engineers, who use their valuable working hours to test instead of coding. Secondly we have the lost opportunity cost, which refers to the delayed time to market, and the cost associated with developers’ loss of focus, also known as the “mental switching cost”.
Of course, there is no right answer when it comes to understanding the best build time, as it depends on the context, but the lower, the better.
As an engineering manager, apart from build time, you also have queue time to consider. This is defined as the time that engineers spend waiting, before their tests can run, and varies depending on the size of the organization and the number of features which are developed concurrently.
Queue time can’t be cut short if a test fails, which means that queues may take a big piece of a engineers’ time. As an engineering manager, we highly recommend tracking how long it takes team members to get to the front of the queue.
By keeping both build and queue times low, engineers may focus on what they are actually paid to do.
Waydev offers you complete transparency when it comes to knowing what professionals are doing, enabling you to view how much and record the time spent waiting for builds to execute. Calculate your ROI of Waydev Premium based on your company’s specifics.
Engineering overhead usually refers to any activity performed by the developer, but which is not included in the actual sprint. The definition covers everything from email, daily meetings, chats, managing issues, as well as administrative chores.
Daily meetings are something to which managers should pay special attention. Poorly planned meetings may take up unnecessary time and increase overhead significantly.
Engineering overhead is calculated in the following manner: (available working hours) – (tracked time) and, from our data, it should be around 20% of the professional’s time.
When it comes to engineering, Agile metrics capture how much value users get from the delivered product or features. To get a full view of the picture, they focus both on the velocity of the delivery, but also on its quality, combining KPIs.
The Agile methodology is based on the idea of continuous improvement, which means that, once performance is assessed, the team manager needs to take into account what is happening well and what needs changing and enhancing.
Continuous improvement is a more flexible and efficient approach than a roadmap which spans across several years, because it takes into account project needs and restrictions that the teams discover while working. In this case, project iterations bring you much closer to the desired results than a multi-year acceleration plan, which focuses on delivery.
What Waydev brings to the table is the new Agile data-driven methodology of tracking your software engineering teams’ output directly from Git repositories without needing anyone’s manual input. By adding a layer of data to the current Agile processes, Waydev managed to bring a real-time, actionable view of engineering output. This ensures engineers use their working hours to perform the tasks which make them valuable.
The sprint burndown showcases how many hours of actual work are necessary to complete a sprint, in a given period of time. Moreover, it also enables the team to see how quickly tasks are finished and predict when the sprint goals will be achieved.
This engineering performance metrics is expressed graphically through a chart, which takes into account the following:
The sprint burndown is meant to make all stakeholders understand the status of the project, reduce risks and contribute to better planning. What is particularly valuable about it is that it offers transparency on the decision-making process and enables the team to identify problems early.
The epic burndown emphasizes how your team’s progress compares to the overall work needed to complete an epic. The report uses estimation statistics which enable you to understand how quickly the team is moving through each epic, see how added or removed tasks impact sprints and foresee how many sprints are necessary to complete an epic.
Team velocity measures the amount of work that a team can complete during a sprint and is calculated by adding the points of all the user stories that have been marked as finished. Velocity is visible on the sprint burndown chart and is, thus, an engineering metric that all team members need to know and understand. Its role is extremely important, as it offers valuable team feedback, showcasing how each project change impacts performance. Ideally, team velocity should increase from one sprint to another, by roughly 10%.
Through its continuous insight analysis, Waydev helps companies accelerate velocity by 2.2x.
Lead time measures the time passed from the moment a particular change is requested and the task is created and up until the work is completed, thus reaching end users. This software engineering metric focuses on the full pipeline, considering the time spent on tasks in the backlog. This way, it identifies potential delays caused by long queues, slow approval processes or inappropriate prioritizing.
Long lead times not only force end-users to wait for the functionalities and improvements they need, but also increase budgets and make workflows less Agile.
By accelerating lead time by 22%, Waydev plays an important part in streamlining operations, increasing performance, output and revenue.
The cumulative flow diagram is a popular chart in Agile engineering approaches, which tracks the progress of a team. The graphic is generated using basic project information and a kanban board. An easy to read example of a CFD would include 4 columns: Backlog, In Development, QA and Deployed.
Engineering managers should follow these charts daily and see how tasks move across the columns, to understand how the project evolves and how long it takes for a task to progress.
Ideally, the CFD should showcase consistent upgrades and, thus, move upwards, so any sign that things happen otherwise should be an alarm signal. What is particularly important when it comes to the cumulative flow diagram is to ensure that the work-in-progress tasks remain steady, as spikes will surely delay the overall project and cause team performance issues.
Escaped bugs is a simple, but extremely helpful metric that counts the number of defects for a release, found after the release date. In general, these types of flaws are identified by end-users, instead of the project team. Defects refer to errors of functionality, communications, security and, of course, performance.
These metrics for software engineering teams are so valuable because these sorts of bugs cost companies money and may impact how end-users see the brand and the products.
Agile teams measure the number of defects as compared to a certain period of time, a sprint or a release and make it their purpose to reduce it, in time. This is done by analyzing the engineering process, understanding the root causes of escaped bugs and continuously improving workflows.
Morale metrics may not be the first on the engineering manager’s list of KPIs, but they are, still, extremely important. Their role is to help managers understand the team’s stamina, how satisfied professionals are with their projects and work. This impacts not only employee retention, but also performance and efficiency, affecting projects altogether.
Moreover, high retention is directly connected to team ROI, as employees that are well integrated in the working environment are significantly more profitable than new recruits.
Morale metrics that are worth measuring include:
By analyzing key engineering metrics, Waydev makes it easier for engineering managers to track overall team performance and focus on morale metrics.
DORA means DevOps Research and Assessment, run by Google Cloud. DORA has defined a set of software delivery and operational performance metrics that correlate closely with high performance. Here are details on the four major metric groups defined by DORA that indicate software delivery performance:
It measures how often an organization successfully releases completed code changes into production per a timeframe (per day, per week, etc). Tracking and trying to increase deployment frequency encourages valuable engineering habits like smaller changesets, extensive test automation, and frequent integration.
Lead time captures the duration between when a developer commits code and when those code changes are successfully deployed and active in production. Shorter lead times quicken the feedback loop and enable faster iteration and innovation velocity.
The mean time to restore is the average time to recover full service when major incidents cause critical production outages. MTTR conveys system and team reliability. Lowering MTTR requires seasoned incident response capabilities like mature monitoring, skilled engineers, automated playbooks, and extensive redundancy.
It measures the percentage of production changes/deployments that fail – requiring remediation like rollbacks after release. A lower change failure rate signals releases are sufficiently high quality. Drawing down failure rates involves comprehensive test automation, improved integration testing, and a quality-focused culture aimed at stability.
More information on DORA metrics is available here.
The most efficient way to work with engineers is to ensure they use their time to focus on their engineering work, as well as by creating a motivating, healthy environment that fosters and acknowledges talent and discipline.
Waydev enables you to do just that by connecting to the platforms your team members are using. With Waydev, you gain complete visibility on what professionals are doing, what kind of activities are being jammed, which tasks are delayed and much more.
By tracking output, Waydev showcases everything, from cycle time, to merged pull requests. All you have to do is assess the information and use it to mitigate risks and adjust working strategies in real time.
This way, you control your team’s results and success levels, benefiting from.
😍 You May Also Like: DevOps Key Metrics to Measure Software Engineering Success
If you want to find out what Waydev can do for you, contact us for a demo.
Ready to unlock your SDLC productivity?