Estimated reading time: 21 minutes
In today’s software industry, engineering metrics are gaining more attention than ever before. While metrics for productivity have been around for decades, newer metrics like DORA, Cycle Time, and investment frameworks are backed by solid research and are specific to the development workflow. In this article by Luca Rossi, we explore how engineering metrics have moved from the “innovators” stage to the “early adopters” stage, and how most modern teams can benefit from incorporating them into their work. Read the Refactoring.fm article below to learn more about incorporating engineering metrics as an engineering leader. 👇🏼
There is a lot of talk around engineering metrics today. This isn’t entirely new — simple metrics for productivity have been around for decades: think of velocity in Scrum, or WIP limits in Kanban.
However, when people mention engineering metrics today, they usually refer to a relatively new wave of KPIs, like DORA, PR Cycle Time, or investment frameworks. These are all specific to the development workflow, and are backed by solid research.
I should say relatively new, though, because a lot of the research that enabled them is 5-10 years old already — yet, the whole space still feels like a work in progress.
I believe this is a reflection of the state of software engineering in general.
In fact, KPIs are meant to measure processes, and the software industry never had much consensus around these in the first place. It’s genuinely hard to point at many things that all software teams do, which in turn makes it hard to build products to improve them.
That said, I believe we are at a tipping point now, where there is finally more consolidation, many workflows have been figured out, and we have a better idea of what an elite engineering team looks like.
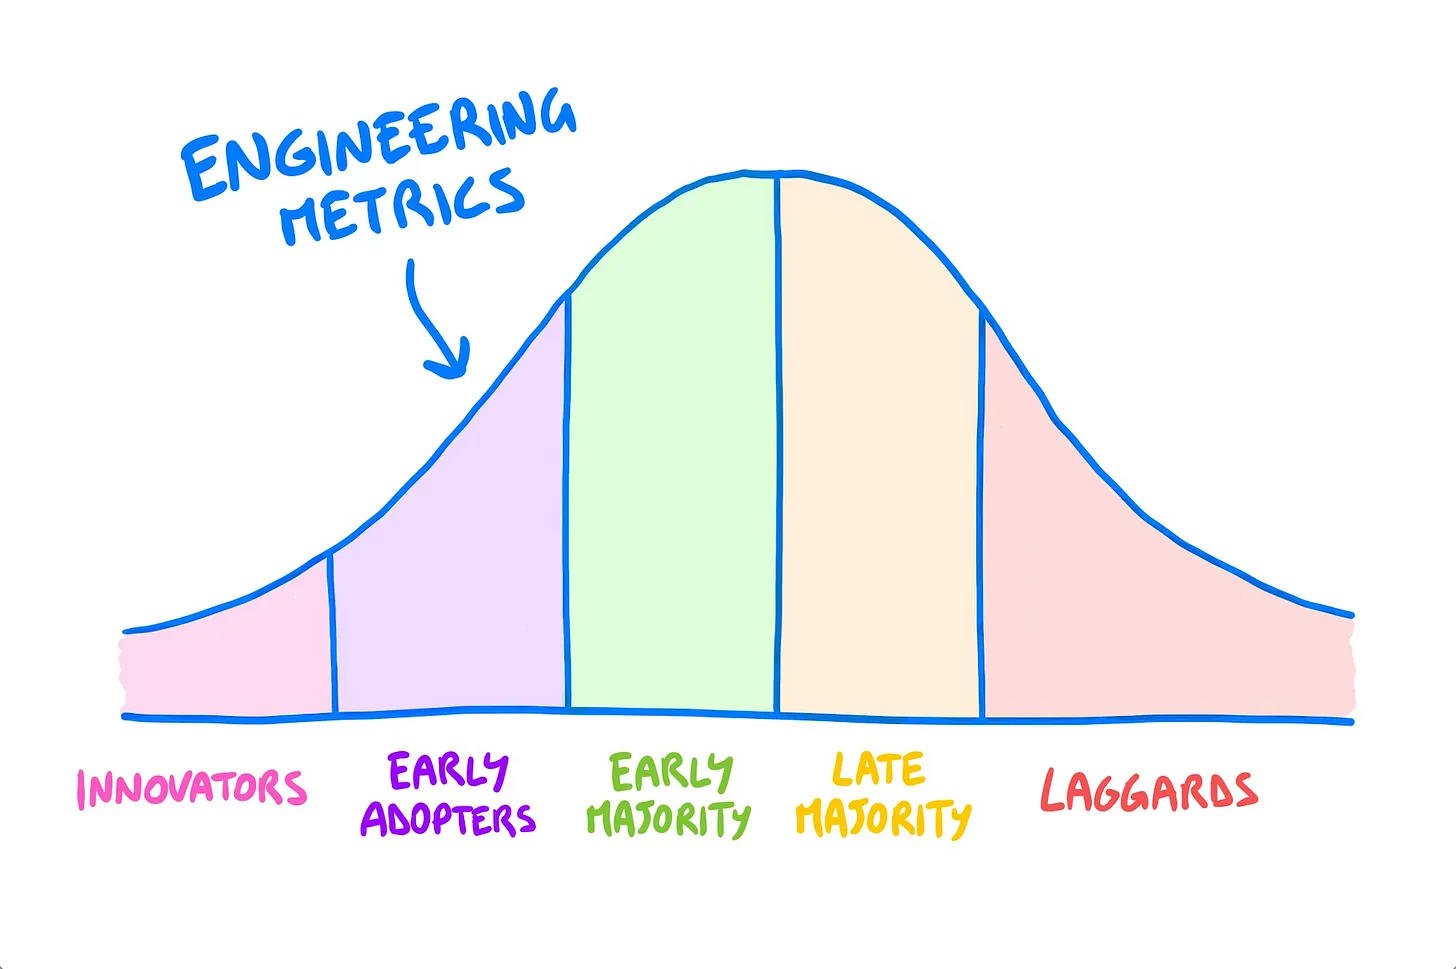
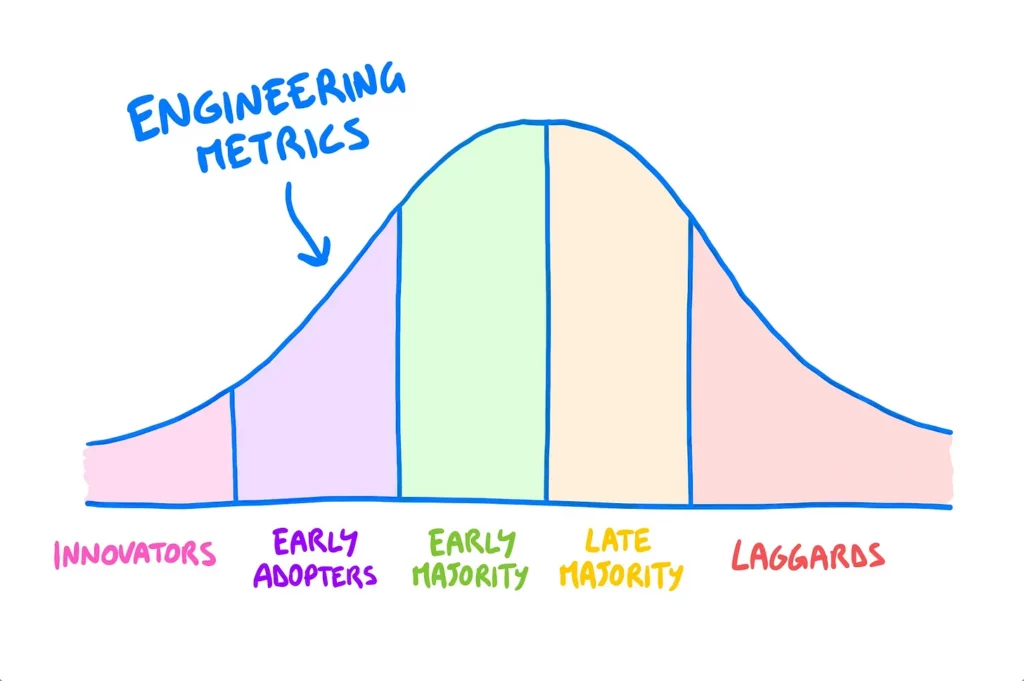
It feels to me that engineering metrics have successfully moved from the “innovators“ stage to the “early adopters” one, on the curve of adoption, and that most modern teams would benefit from incorporating them into their work.
t’s still a lot to digest, but for teams and managers who make the leap, the benefits are impossible to ignore.
So, this article wants to be your primer on engineering metrics and how you can use them with your team. Especially if you have never touched them, this is meant to give you the minimum viable instructions to get started.
Here is what we will cover:

Let’s start with a simple disclaimer: nothing will authoritatively tell you how well your team is working, as a whole. If you are looking for a holistic picture of your team’s performance, that still comes from your experience.
That’s especially true when you consider that engineering is not a silo that creates some abstract tech by itself, but a group of people who work, together with PMs, designers and other stakeholders, on a product for some users.
So, engineering metrics do not capture the big picture, because they are not meant to.
Metrics don’t show how much the team cares about the product and users. The care is visible in small adjustments that were not planned to improve the user experience, unusual scenarios, etc.
The care is also visible when the team takes initiative for the work they are doing over following the requirements and designs. I’m wondering if that’s all somehow measurable.
— Hovhannes Guylan, Senior Engineering Manager
Metrics are clues. They empower your processes and, to quote my friend Naqui, give you a sense of where the wind is blowing 👇
There is no one set of metrics that accurately gives performance information. However multiple metrics combined together in multiple ways gives a good sense of where the wind is blowing.
— Naquiuddin Khaja, Engineering Manager
Personally, I have used engineering metrics for many years, and here is what they have been the most useful for:
Sometimes it’s hard to pinpoint a good target for a KPI, but you can spot whether things are improving or not.
For example, the number of commits per day doesn’t look all that actionable in isolation, but what if there has been a steady decline in the last three months? Are we getting slower at PRs, too? Maybe that’s because we are having too many meetings? Or there is too much work in progress?
Once you have spotted a trend, numbers make it easy to start a conversation with your team.
Metrics are always a means to an end. For me, the goal is to get visibility into what’s happening in the development process/developer experience and insights on the things that I should pay attention to.
— Ari Koponen, Head of Platform at Swarmia
Such conversations can range from celebrations, for when things have improved, to figuring out the root cause of a problem, starting with some evidence. Which leads to the last point 👇
Numbers provide evidence that can help back initiatives with stakeholders.
E.g. showing that your team routinely spends 40% of their time on maintenance is a great starting point to advocate for some debt-reducing project.
So, what types of metrics should you track?
There exist various classifications for engineering metrics. The SPACE Framework is probably the best out there, but it is also quite extensive and I haven’t found a company that implements it in full.
So, for my own utility, I have come up with a simpler mental model, conveniently called WIP, based on three categories:
The goal of these categories is to be useful, rather than exhaustive. I believe the minimum viable metrics you should consider include data points from each of these categories.
So, let’s list everything that goes into each bucket 👇
I believe a great litmus test to figure out if you are doing well as a manager is to ask yourself: “am I having hard conversations with my team?”
There are always some: about careers, about CI/CD that takes forever, or about Dave, the guy that always makes others wait two days for his code reviews. Hey Dave 👋
Hard conversations lead to progress, and having them regularly means that people feel safe to address problems with you.
Many of these chats start with something people are not satisfied with. Satisfaction comes before numbers — you might think some process is doing great, but if people are not happy about it, you should act.
So, to begin your data-driven improvement journey, you don’t need tools. My advice is to just… ask people! Here are a few things you can survey your people about:
You can discuss these in many ways:
I want to stress that there is no substitute for this. Out of all the categories of metrics, if you have to act on one only, it should be this.
My suggestion is to prioritize getting to know your team, fully trust the people you lead, and ensure they are passionate about and accountable for their work. There will always be time to examine metrics once you’ve accomplished that.
— Nicola Ballotta, Director of Cloud at Namecheap
That said, there are also tools that can help you with this. There are three main categories you can try:
Investment metrics are for figuring out how you spend your time as a team.
For example, how much time goes into maintenance vs new features? How much on new features vs small improvements?
In my experience, tracking your investment balance has incredible ROI. It creates alignment with the business, builds trust, and counters natural biases your team may have towards specific types of work.
In fact, based on their culture, most teams naturally skew towards extreme modes of work. For example:
The best way to counter this is to start visualizing where your time goes, and adjust.
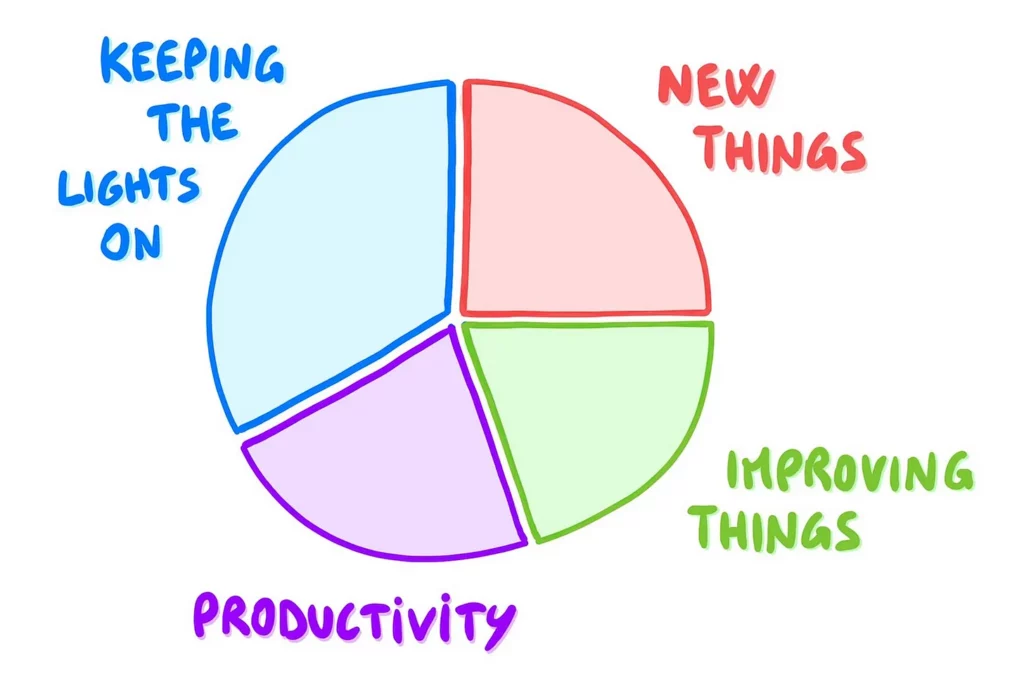
About this, I am a fan of the balance framework, which divides work into four main areas:
This helps you have conversations based on grounded evidence, and build a sustainable work balance. E.g. are you spending more than 30% on KTLO? You can bring up the data, discuss if there is some debt that slows the team down, and plan actions to improve.
Most engineering metrics tools today provide ways to track your investment (will provide a list at the end of the post).
Productivity metrics are what most people think about when we talk of engineering metrics.
These are the numbers that people strive to improve, for which you set targets, check industry benchmarks, and more.
There is almost no limit to the amount of KPIs you can track this way. Delivery metrics (e.g. DORA), coding metrics (e.g. # of commits, commit size, churn, …), collaboration metrics (e.g. PRs metrics), and more.
Any of these can be useful at specific times and in specific situations, but I believe only a few are useful on a regular basis. Here are my favorites:
Nicole Forsgren, Jez Humble and Gene Kim surveyed more than 2000 tech companies between 2013 and 2017.
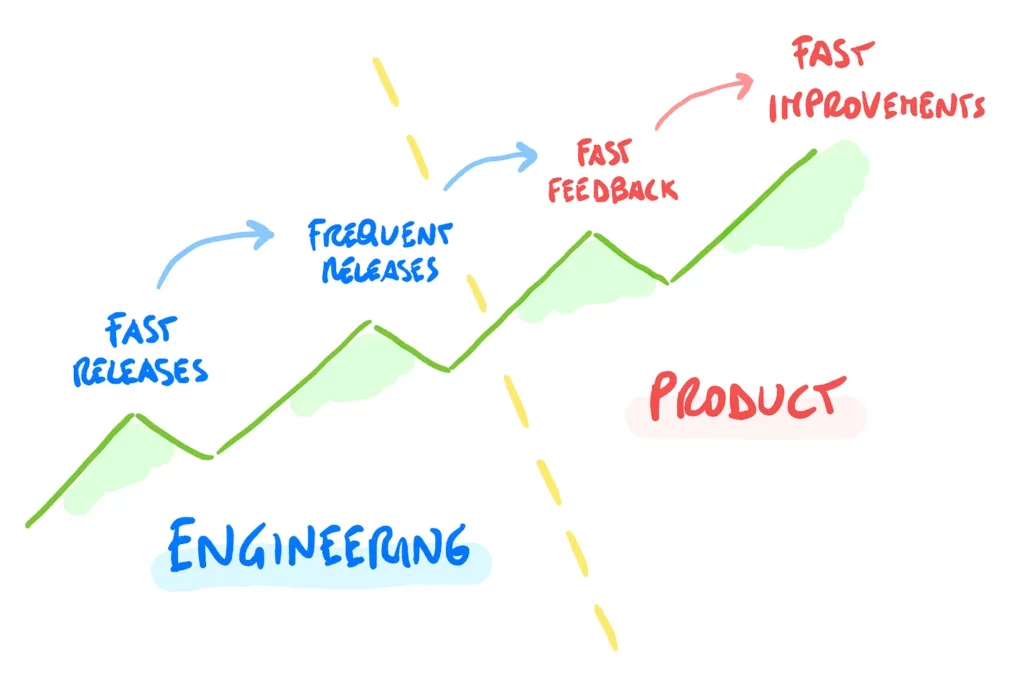
They focused on software delivery, to understand which practices accelerate development, and in turn bring the most value to companies.
Their work, which was published in the Accelerate book, validated two major theses:
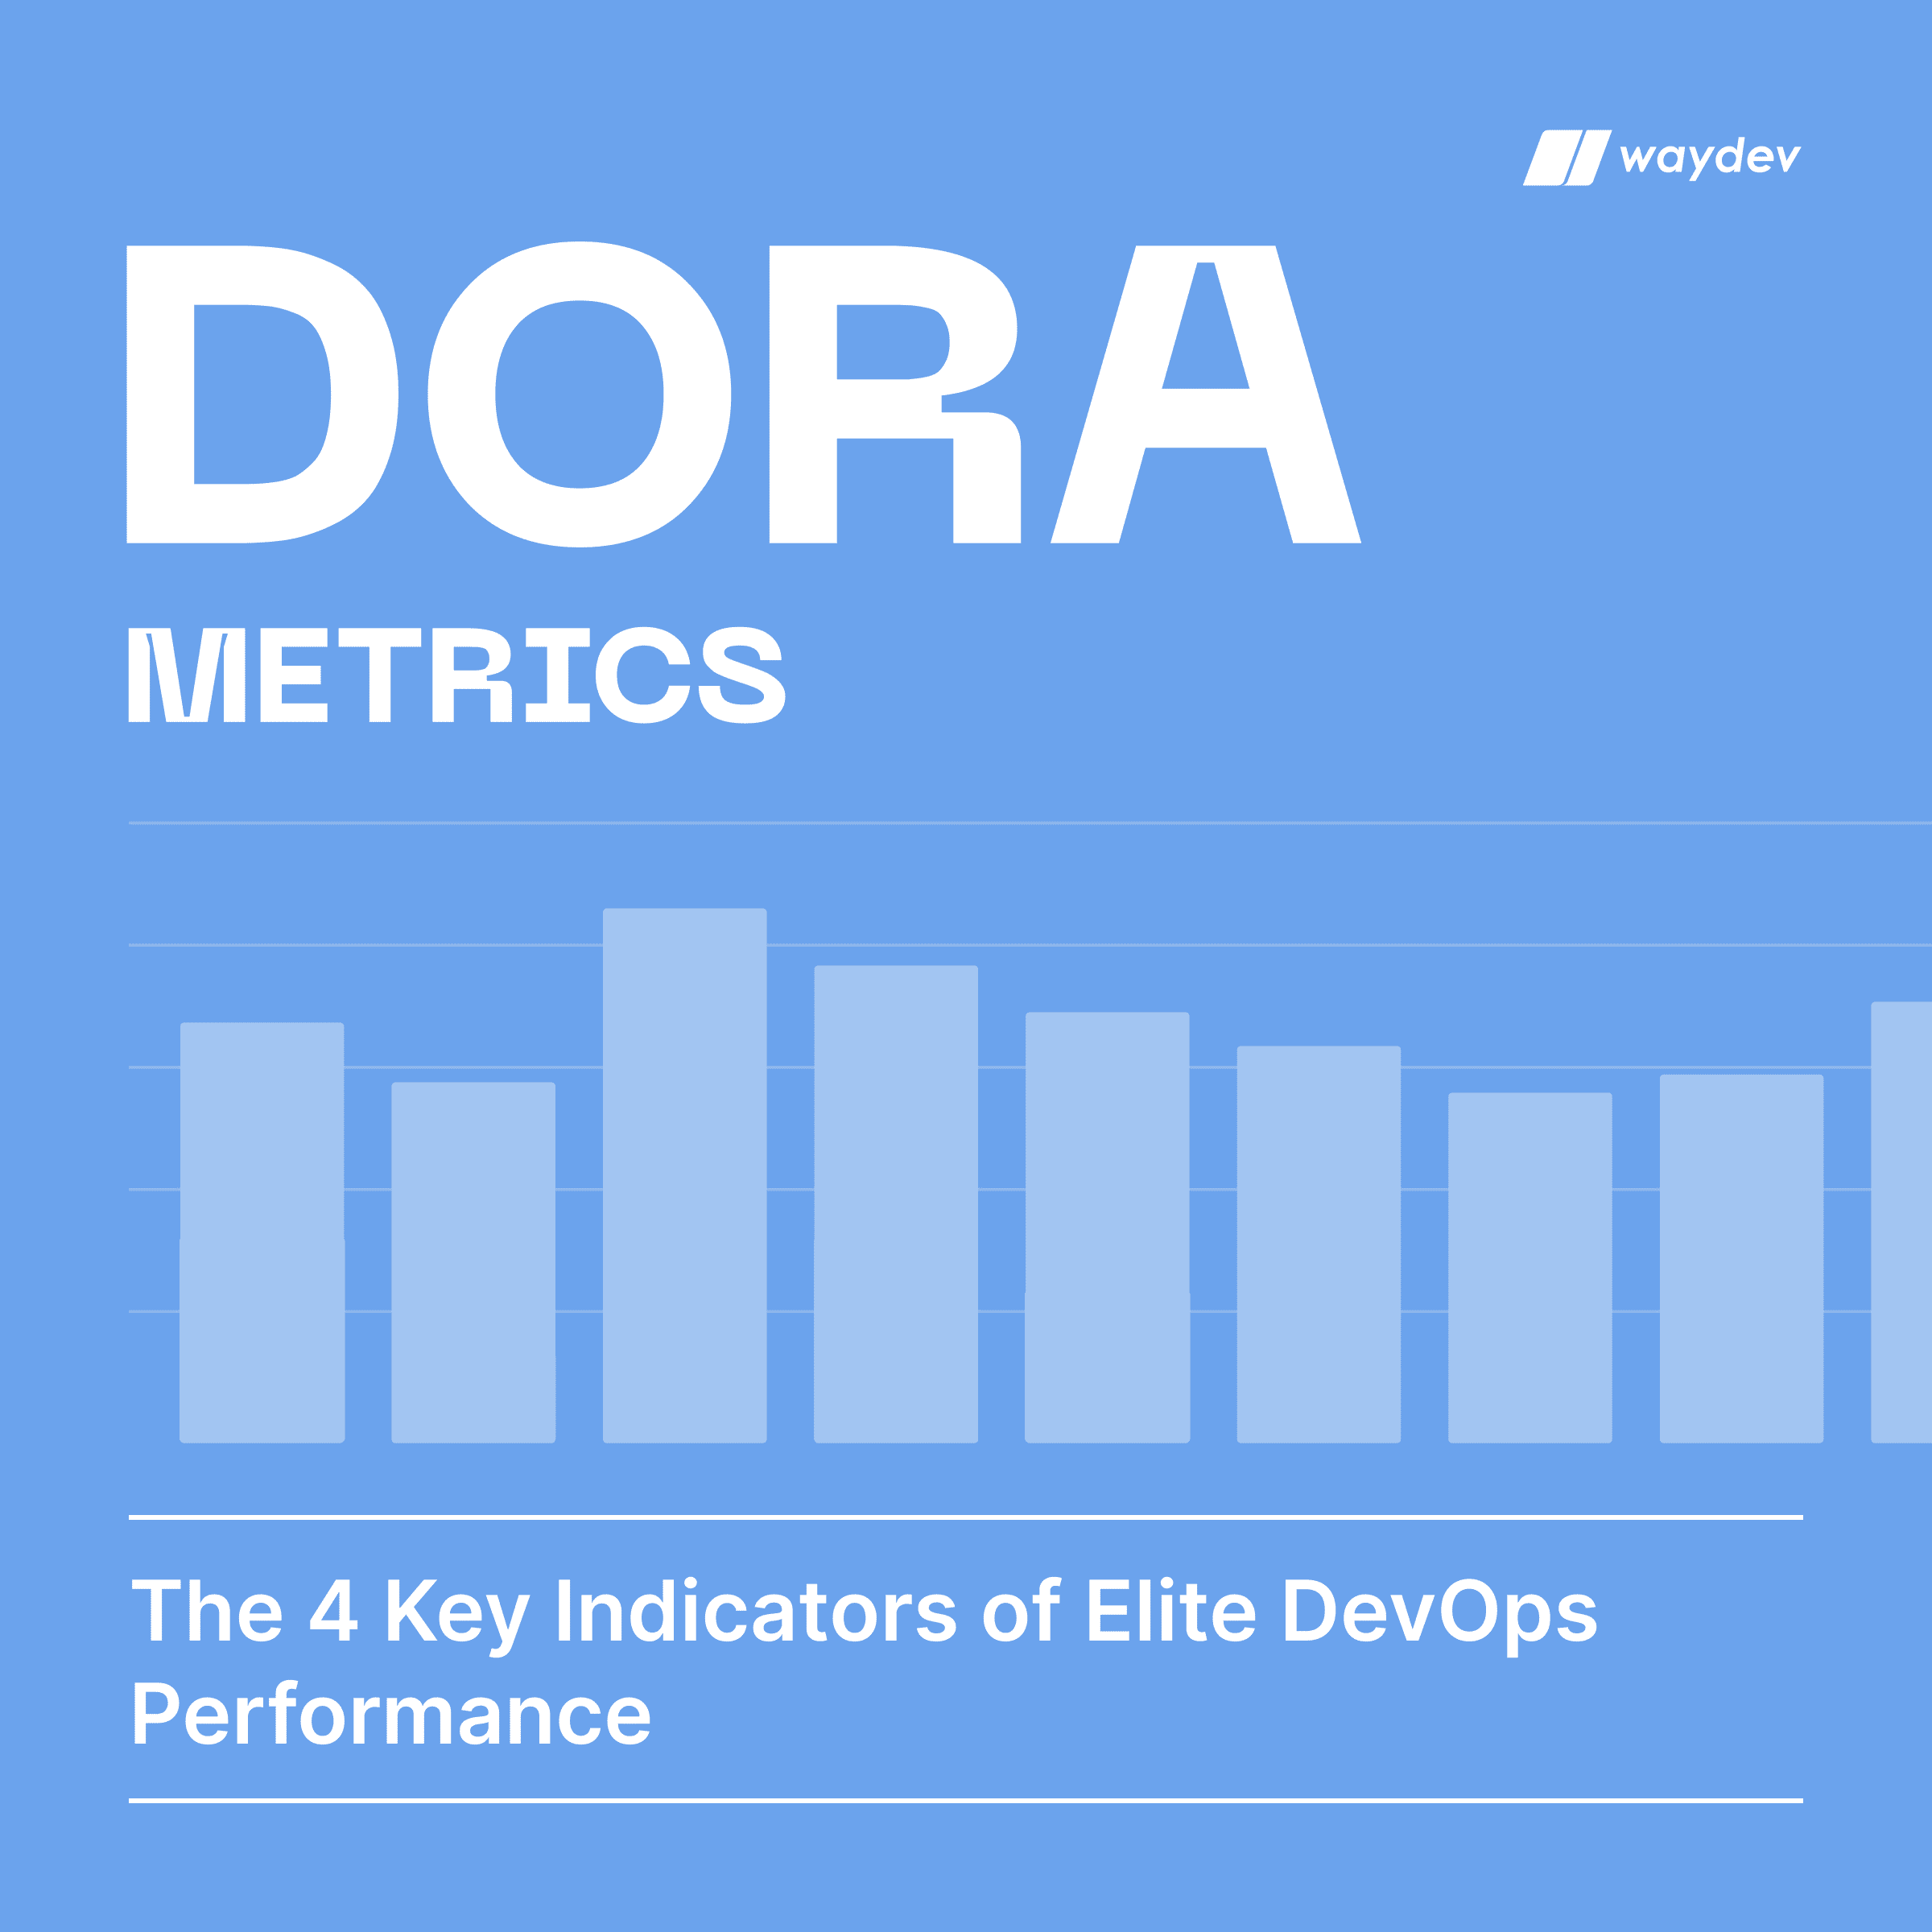
Accelerate has since become a cornerstone work for software engineering, as it backs decades of theories with real, indisputable data. It defines four major metrics for measuring delivery performance, which today are widely called DORA metrics:
Accelerate contains performance benchmarks for each metric, defining the categories of elite, high, medium, and low performers.
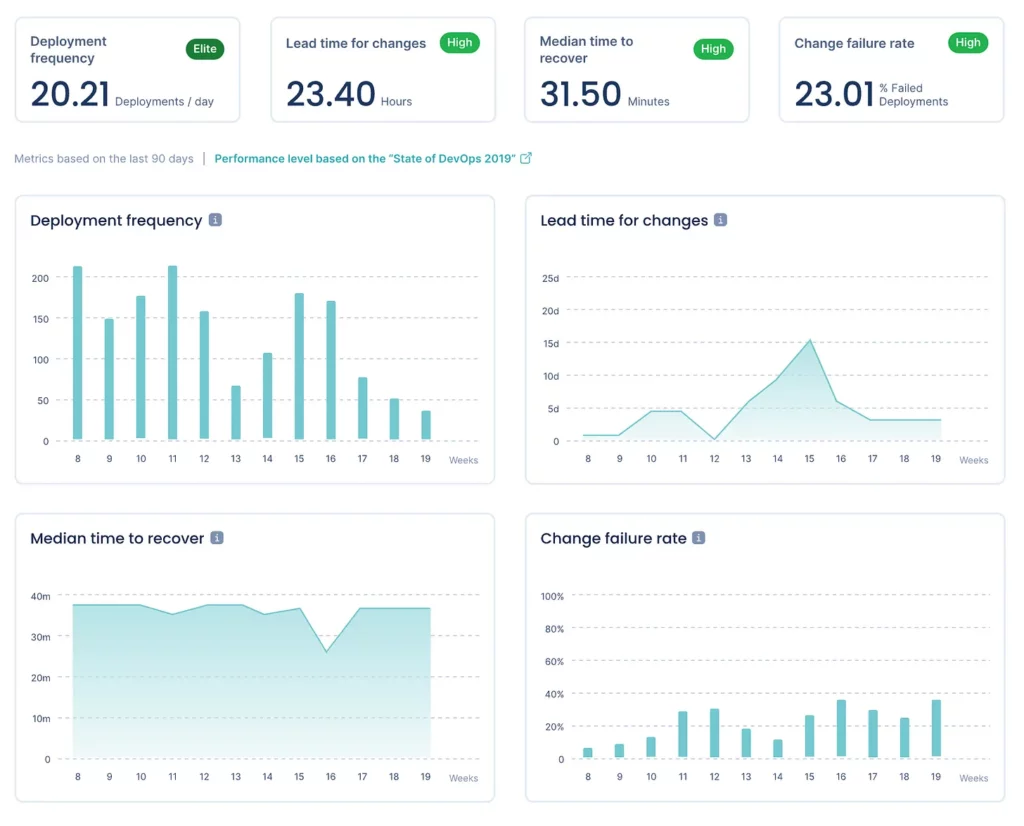
Here are the three main takeaways:
Accelerate has been followed by more research and surveys by the same team in the following years, which you can find on the DORA website.
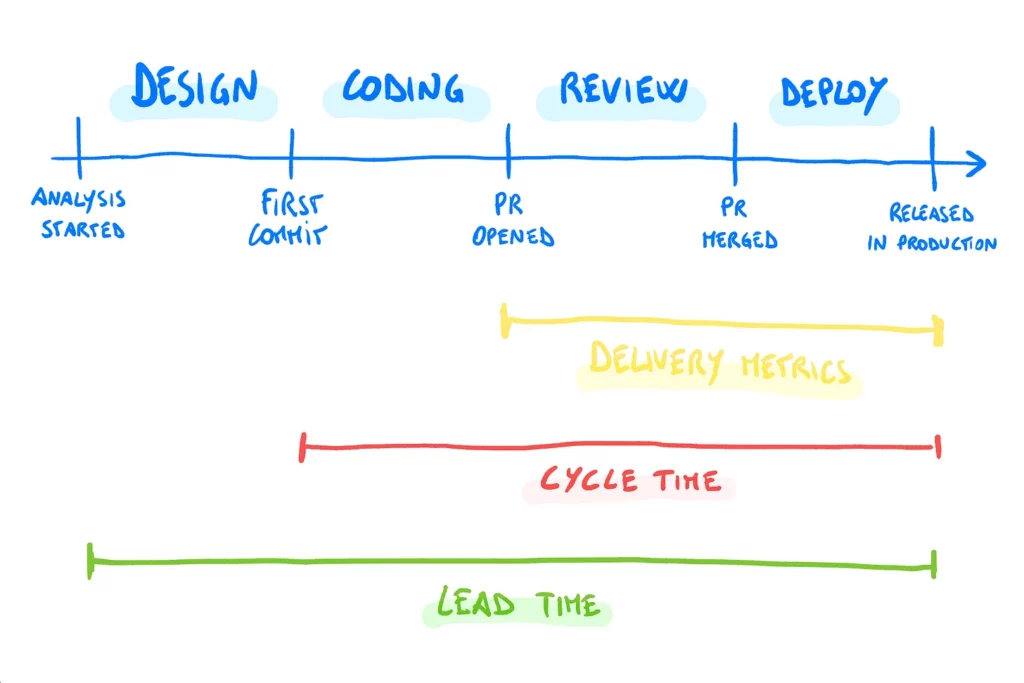
Out of the four DORA metrics, if you had to choose one to start with, that would be Lead Time for Changes — which today is more often called Cycle Time.
Cycle Time is a subset of the overall Lead Time, which instead covers the whole dev cycle, from ideation to release.
Why measuring one instead of the other?
Lead Time includes analysis and design phases, whose duration can vary a lot based on the breadth of the initiative. However, once the initiative itself has been broken down into multiple deliverables, the delivery process should move in short and predictable cycles, which are more useful to measure.
Cycle Time is probably the most popular engineering metric today — and for good reason. In fact, it possesses all the hallmarks of great KPIs:
A healthy Cycle Time in real-world scenarios is anything within a couple of days. Further improvements are fine, but I have noticed that striving for < one day brings diminishing returns.
Breaking down work in small batches is important, but there is an optimal batch size somewhere — under which you are only pedaling faster without delivering more value.
So it’s ok to optimize Cycle Time, but I wouldn’t obsess on getting it down to hours.
Cycle Time is an aggregated metric that combines several steps of the dev workflow.
When you zoom in, a critical measure for most teams is PR Cycle time — the average time that goes from when a PR is opened to when it is merged.
You might think this is very specific compared to the previous stuff we discussed. I am including it here because, in my experience, code reviews are often the single biggest bottlenecks for software teams.
It always boggles my mind how many teams do heroic efforts to shave 10 mins off their CI/CD pipeline, and then are totally fine with the code sitting idle for days waiting for review.
I recommend starting with one leading metric (i.e., PR Cycle Time) and looking at that metric consistently throughout the entire engineering organization. This will lead to valuable discussions and, ultimately, the desired changes around that metric.
— Eiso Kant, CEO at Athenian
We track PR cycle times closely.
We are interested in keeping the batch size low and making sure our review times stay in order. I almost always have a tab open for our “pull requests” view.
It includes cycle time metrics, but, maybe even more importantly, allows you to easily see when the “Merge” or “Review” sections get long. It is usually a symptom of too much WIP / lack of focus.
— Ari Koponen, Head of Platform at Swarmia
Velocity gets an honorable mention because it is still the most well-known engineering metric, so I felt compelled to spend a few words about it.
And these few words are: velocity is not very useful.
In my experience, velocity has some limited utility in planning work — you can use it for rough sizing, but not more — and is just misleading for anything else.
In fact:
So, all that said, how do you start using metrics in your work?
I want to be absolutely clear on this: using metrics is a lot of work.
That is true for any metrics, not just engineering ones. In fact, for each single KPI you decide to track, you have to:
This is a continuous cycle: you look at numbers, discuss them with people, figure out how to improve, measure things again, discuss, over and over again.
So, if you are just getting started, start small. Here is the minimum viable metrics program I would recommend 👇
Talk to people: engineers, managers, but also PMs and other non-technical stakeholders who are particularly involved. Figure out what are the most frustrating problems, to them, in the development process.
You can do it individually, but I also recommend doing it in team-wide retrospectives. You can have a retro focused on DX, and a separate one focused on the business angle. Take the 2-3 top issues that people agree on and write them down.
Start with one of the issues you found, and figure out how to measure it. You can probably find some KPI related to it. Here is a great cheatsheet by Ari:
Make it an official initiative and create a dedicated retrospective about it, with some generous cadence (e.g. once every two weeks).
At the beginning, focus on improvement rather than setting a target. It is more important to build momentum rather than reach a specific goal.
On a longer timeframe (e.g. quarterly) decide whether to continue your investment on that KPI or move your focus to another of the top issues. Keep having conversations to keep issues up to date and surface new ones.
In the long run, at any given time you will find yourself with some part of the dev process that requires more of your attention, and with a long tail of KPIs you keep an eye on, with a minimum level of investment, to spot regressions.
Thanks to Refactoring, I am lucky to personally know many founders and CEOs of the most popular products in the engineering metrics space.
So I reached out to them and asked what advice they would give to leaders who want to start using metrics, but don’t know exactly how.
Many recommend beginning with DORA metrics, but DORA metrics are not enough to guide an engineering organization – they’re only part of the equation.

We can’t talk about metrics without talking about change management. Most leaders struggle to create the right culture around metrics. The right culture requires consistency, so I recommend starting with one leading metric (i.e., PR Cycle Time) and looking at that metric consistently throughout the entire engineering organization. This will lead to valuable discussions and, ultimately, the desired changes around that metric.
Yes, DORA metrics can show us the typical characteristics of high-performing teams, but not how they made their journey to get there, or a map to get your organization where it needs to get.
An engineering metrics program is essential to solve engineering leaders’ dual mandate of operational excellence and aligning R&D investments to business impact.

However, metrics like DORA only go so far. They’re often lagging indicators – and are challenging to use without context. You need to use engineering metrics benchmarks to gauge success. Then to create sustained improvement, you must reduce dev toil with workflow automation.
We’ve built free resources to help engineering leaders start their metrics program and improve software delivery:
Effective dev teams rely heavily on engineering metrics, but their usefulness is limited unless they are aligned with desired outcomes.

EMs must first gain a comprehensive understanding of the system as a whole, including how features are conceptualized and brought to production, before focusing on more targeted metrics for optimization.
Although process-specific metrics such as PR Cycle time, MTTR, and Code Review Time are valuable, they should be employed in a manner that enhances the overall workflow, rather than being used in isolation.
As you’d expect, we actively use Pulse (self-plug) in team sprint retros because it works on a team level, so there’s no finger-pointing at devs who are “underperforming” but the team as a whole can look at outlier tickets and say, “OK, why was the cycle time on this one ticket so long? Can we learn anything from it?”

The DORA metrics are not perfect or complete but being able to ask “why did this take so long?” or “why did we have so many production incidents this month?” has significant value.
Pulse or similar cycle-time explorer tool would have been super-helpful at my previous employer to graph phases of cycle. If your team is taking a long time to process code reviews, for instance, this will be glaringly obvious in the cycle time chart (and maybe you can find some help on this here…). If there’s a bottleneck in QA or Product review, these things can be visualized in a way that you can then tackle.
But, as others here say, I think there is a huge thing to be said for “just listen to your engineers and make sure they are happy, excited about their work and making progress” because over-examination of metrics can lead to unwanted gaming of the system.
Metrics do best IMO when they are streamlining your processes rather than studying individuals’ performance.
Metrics are always a means to an end. For me, the goal is to get visibility into what’s happening in the development process/developer experience and insights on the things that I should pay attention to.

When talking about metrics, people often think of “a single number,” but my experience is that visualizing the data in an easy-to-understand way provides better insights.
The metrics we most commonly refer to in our team are:
For executives new to engineering metrics, it’s essential to align KPIs with the company’s strategic goals and objectives.

Start by measuring our own recommended metrics, including Lead Time for Changes, Deployment Frequency, and Change Failure Rate, as they provide insights into efficiency, velocity, and stability, allowing to identify bottlenecks and areas for improvement.
Use these metrics to drive positive change, motivate your team, review progress, and adapt the approach as needed.
Implementing a data-driven culture is vital to fostering collaboration and continuous improvement, enabling informed decision-making, and driving long-term success.
Ready to unlock your SDLC productivity?