Key takeaways
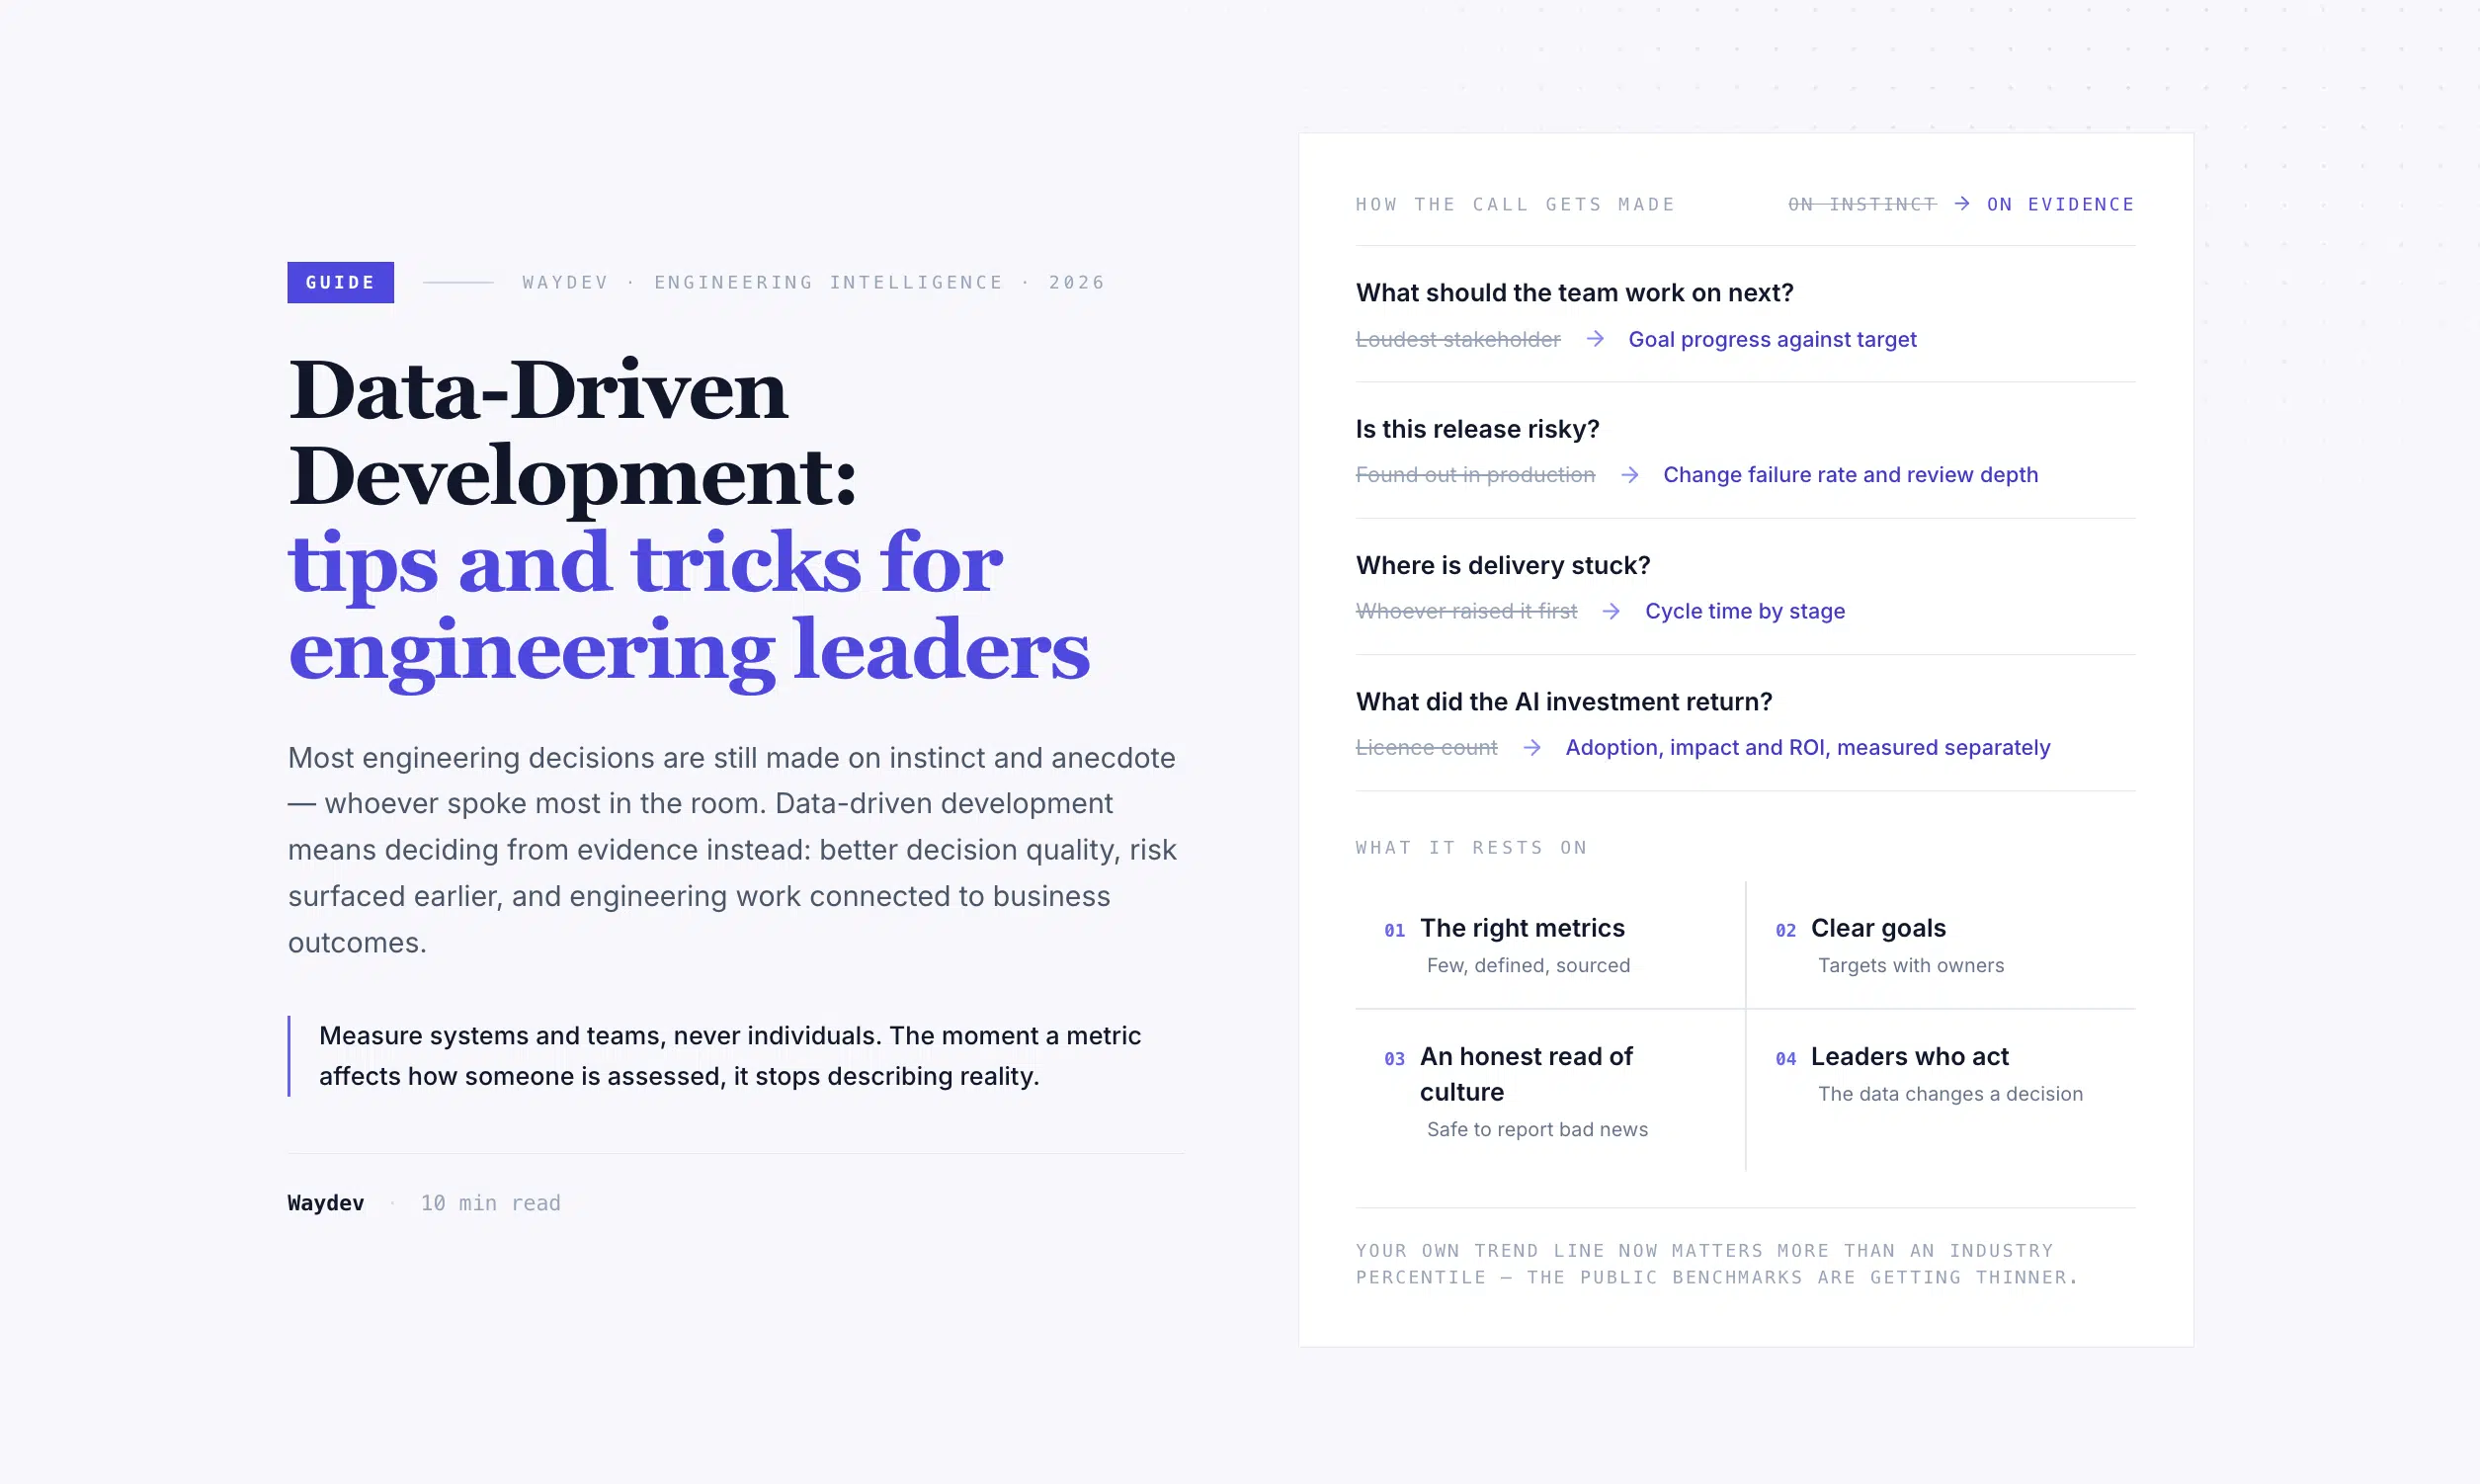
Data-driven development means deciding from evidence rather than instinct. It improves decision quality, surfaces risk earlier, and connects engineering work to business outcomes.
It rests on four things: the right metrics, clear goals, an honest read of your culture, and leaders who act on what the data says.
Measure systems and teams, never individuals. The moment a metric affects how someone is assessed, it stops describing reality.
In 2026 the hardest question a data-driven organization has to answer is what its AI investment returned, and that needs adoption, impact and ROI measured separately.
Your own trend line now matters more than an industry percentile, because the public benchmarks are getting thinner.
Most engineering decisions are still made on instinct and anecdote: whoever spoke most convincingly in the meeting, or whichever team complained loudest. Data-driven software development replaces that with evidence pulled from the systems your teams already use. This guide covers what to measure, what to stop measuring, how to actually change behaviour with it, and where measurement genuinely cannot help you.
Data-driven development is a management approach that uses evidence from your delivery systems to guide how engineering works and to show how that work contributes to the business. In practice it means picking a small number of metrics and engineering OKRs, watching them over time, and changing something when they move the wrong way.
What it is not: a dashboard. Plenty of organizations spend a quarter building beautiful reporting and change nothing about how they work. Visibility is the cheap half. Acting on it is the half that produces results.
Figure 1
The four things a data-driven practice rests on
Most measurement programmes fail at this step, by picking the metrics that are easiest to collect rather than the ones that describe outcomes. There is a hierarchy, and knowing where a metric sits tells you how much weight it can carry.
Figure 2
Three layers of metric, and how much each one is worth
Activity metrics are not useless, they are just not evidence of value. Use them to spot anomalies, never to judge output.
A practical starting set: cycle time broken into coding, review and deployment stages, the four DORA metrics, review load and depth via merge quality, and code churn as a rework signal. That is enough to diagnose most delivery problems and small enough that people remember what they mean.
Then add one or two outcome metrics that your CFO recognises: cost per feature, capitalizable effort, or project cost against plan. Technical metrics tell you how engineering is performing. Outcome metrics are what let you argue for budget. There is more on the distinction between metrics and KPIs in our glossary.
Metrics without goals produce dashboards nobody opens. An OKR has one objective and two to five key results, and runs over a quarter or a year, which makes it the right container for a measurement programme. The objective says what you are trying to change; the key results say how you will know.
Two rules that save a lot of pain. Set the target on the outcome, not the metric that diagnoses it: aim at reducing lead time, not at increasing commit counts. And attach an owner who has the authority to change the thing being measured, because a target owned by someone who cannot move the levers is a plan to fail. Targets and notifications handle the tracking so nobody is chasing screenshots at quarter end.
For years the standard advice was to compare yourself against industry benchmarks and find out whether you were a low or elite performer. That advice needs revising. DORA has paused its annual survey, which means the most trusted vendor-neutral comparison set is not being refreshed this year. Whatever percentile you are quoting is going to age.
Figure 3
Two kinds of benchmark, and what each can tell you
The practical move is to benchmark teams against your own organization and against their own history. Internal benchmarking does that without importing someone else’s definitions, and it survives whatever happens to public datasets.
There is one rule that determines whether a measurement programme produces information or theatre: metrics describe the system people work inside, and are never used to rank the people themselves. Break that rule once and the data degrades permanently, because engineers optimise for whatever they are judged on. You get smaller commits, less pairing, fewer people volunteering to fix the unglamorous things, and a quiet reluctance to help a colleague because the effort lands in someone else’s column.
The second cultural requirement is translation. Getting a technical argument across to a CFO or a board means knowing what they care about, which is usually cost, risk and time to market rather than deployment frequency. Start from the company’s stated objectives, pick the metrics that connect to them, and report in their language.
The third is asking. System data tells you what happened; it cannot tell you why. Developer Experience surveys next to your delivery metrics close that gap, and they usually confirm that your engineers already knew what was slowing them down.
Figure 4
The loop that separates measuring from improving
Start with the data you already have. Nobody should be filling in timesheets or activity forms for this. The record already exists in your GitHub, GitLab, Bitbucket or Azure DevOps history, joined to Jira and your CI system. Backfilling that history means you have trends on day one instead of waiting a quarter to accumulate them.
Quantify the uncertainty rather than pretending it away. Every project carries unknowns from technology, stakeholders and scope. The useful discipline is defining tolerance ranges in advance, so you know what counts as normal variation and what counts as a signal. Unplanned work appearing mid-sprint is the most common and most corrosive form, and it is measurable: watch what share of each sprint goes to work that was not planned at the start, using velocity and sprint commitment. Our rework calculator puts a cost on it.
Share the data with the people it describes, first. Data only creates value once it is analysed and discussed, and the fastest way to lose an engineering team is for them to discover their numbers are being reviewed upstairs before they have seen them. Show teams their own insights and let them interpret them. Managers who use this well spend their time coaching rather than auditing.
Everything above predates AI coding tools and still holds. What AI added is a new question that a data-driven organization is now expected to answer: what did the investment return? Answering it badly is common, and the failure is always the same shape.
| Layer | What it tells you | Where the data comes from |
|---|---|---|
| Adoption | Whether the tools are being used: active versus silent seats, acceptance rate, share of work with AI involvement. | The AI tools themselves. |
| Impact | Whether delivery actually changed: cycle time by stage, review load, rework, change failure rate. | Your Git and ticketing history, which is the only place this exists. |
| ROI | Whether it paid back: changed delivery economics against tool, platform and inference cost. | Impact data joined to finance data. |
Keep those three separate. Collapse them into one composite score and you lose the ability to tell which part is working, which is precisely the question a CFO is asking. Reporting adoption as though it were impact is the most common version of this mistake, and it is how organizations end up presenting spend as productivity.
There is a timing constraint too, and it is the most urgent thing on this page. A before-and-after comparison needs a before. Every month of unmeasured AI adoption is baseline data that cannot be reconstructed later. The method is in the AI ROI playbook, and you can model the numbers with the AI ROI calculator.
Being clear about the limits is what makes the rest of this credible, and it is the section most vendors leave out.
Whether you built the right thing. No engineering metric answers this. A team can be elite on every delivery measure and still ship something nobody wants.
Why a number moved. System data shows the what. The cause is usually in a conversation, a reorganisation, or a person quietly carrying three projects.
How people feel. Burnout, frustration with tooling and loss of confidence do not appear in Git until they show up as attrition, which is far too late to act on.
Individual contribution. Not a gap to be closed with better data. It is a category error, and attempting it destroys the reliability of everything else you measure.
Our position is that engineering measurement should be portable. The WAY Framework combines DORA, SPACE and Core 4 rather than replacing them with a proprietary index, which means the vocabulary your leadership learns stays yours whether or not you stay with us. A metric that only computes inside one vendor’s product is not a framework, it is a dependency.
Practically, Waydev pulls the data from the systems your teams already use, with no manual input from engineers, and joins delivery to cost and AI measurement in one place. It runs cloud, self-hosted or fully on-premise, and is in production at Fortune 500 organizations including American Express, Dropbox and PwC. If you want to see the shape of the work first, the Engineering Leaders Handbook and the DORA Metrics Playbook are free.
The short version
The only way to improve something is to measure it, but measuring it is not the improvement. Pick a small set of metrics that describe delivery rather than activity, use them on systems and never on people, and change one thing at a time until the number moves.
Start from your own baseline
Connect your repositories and we will backfill your history, so you begin with a real trend line rather than a blank dashboard. You keep the analysis either way.
Metrics and frameworks: DORA metrics · The WAY Framework · Cycle Time · Code churn · Developer Experience · Benchmarking
Playbooks: DORA Metrics · SPACE Framework · Cycle Time · Measuring AI ROI · Engineering Leaders Handbook
Calculators: AI ROI · Cost of rework · Cost of technical debt · Cost of change failure rate
Ready to unlock your SDLC productivity?