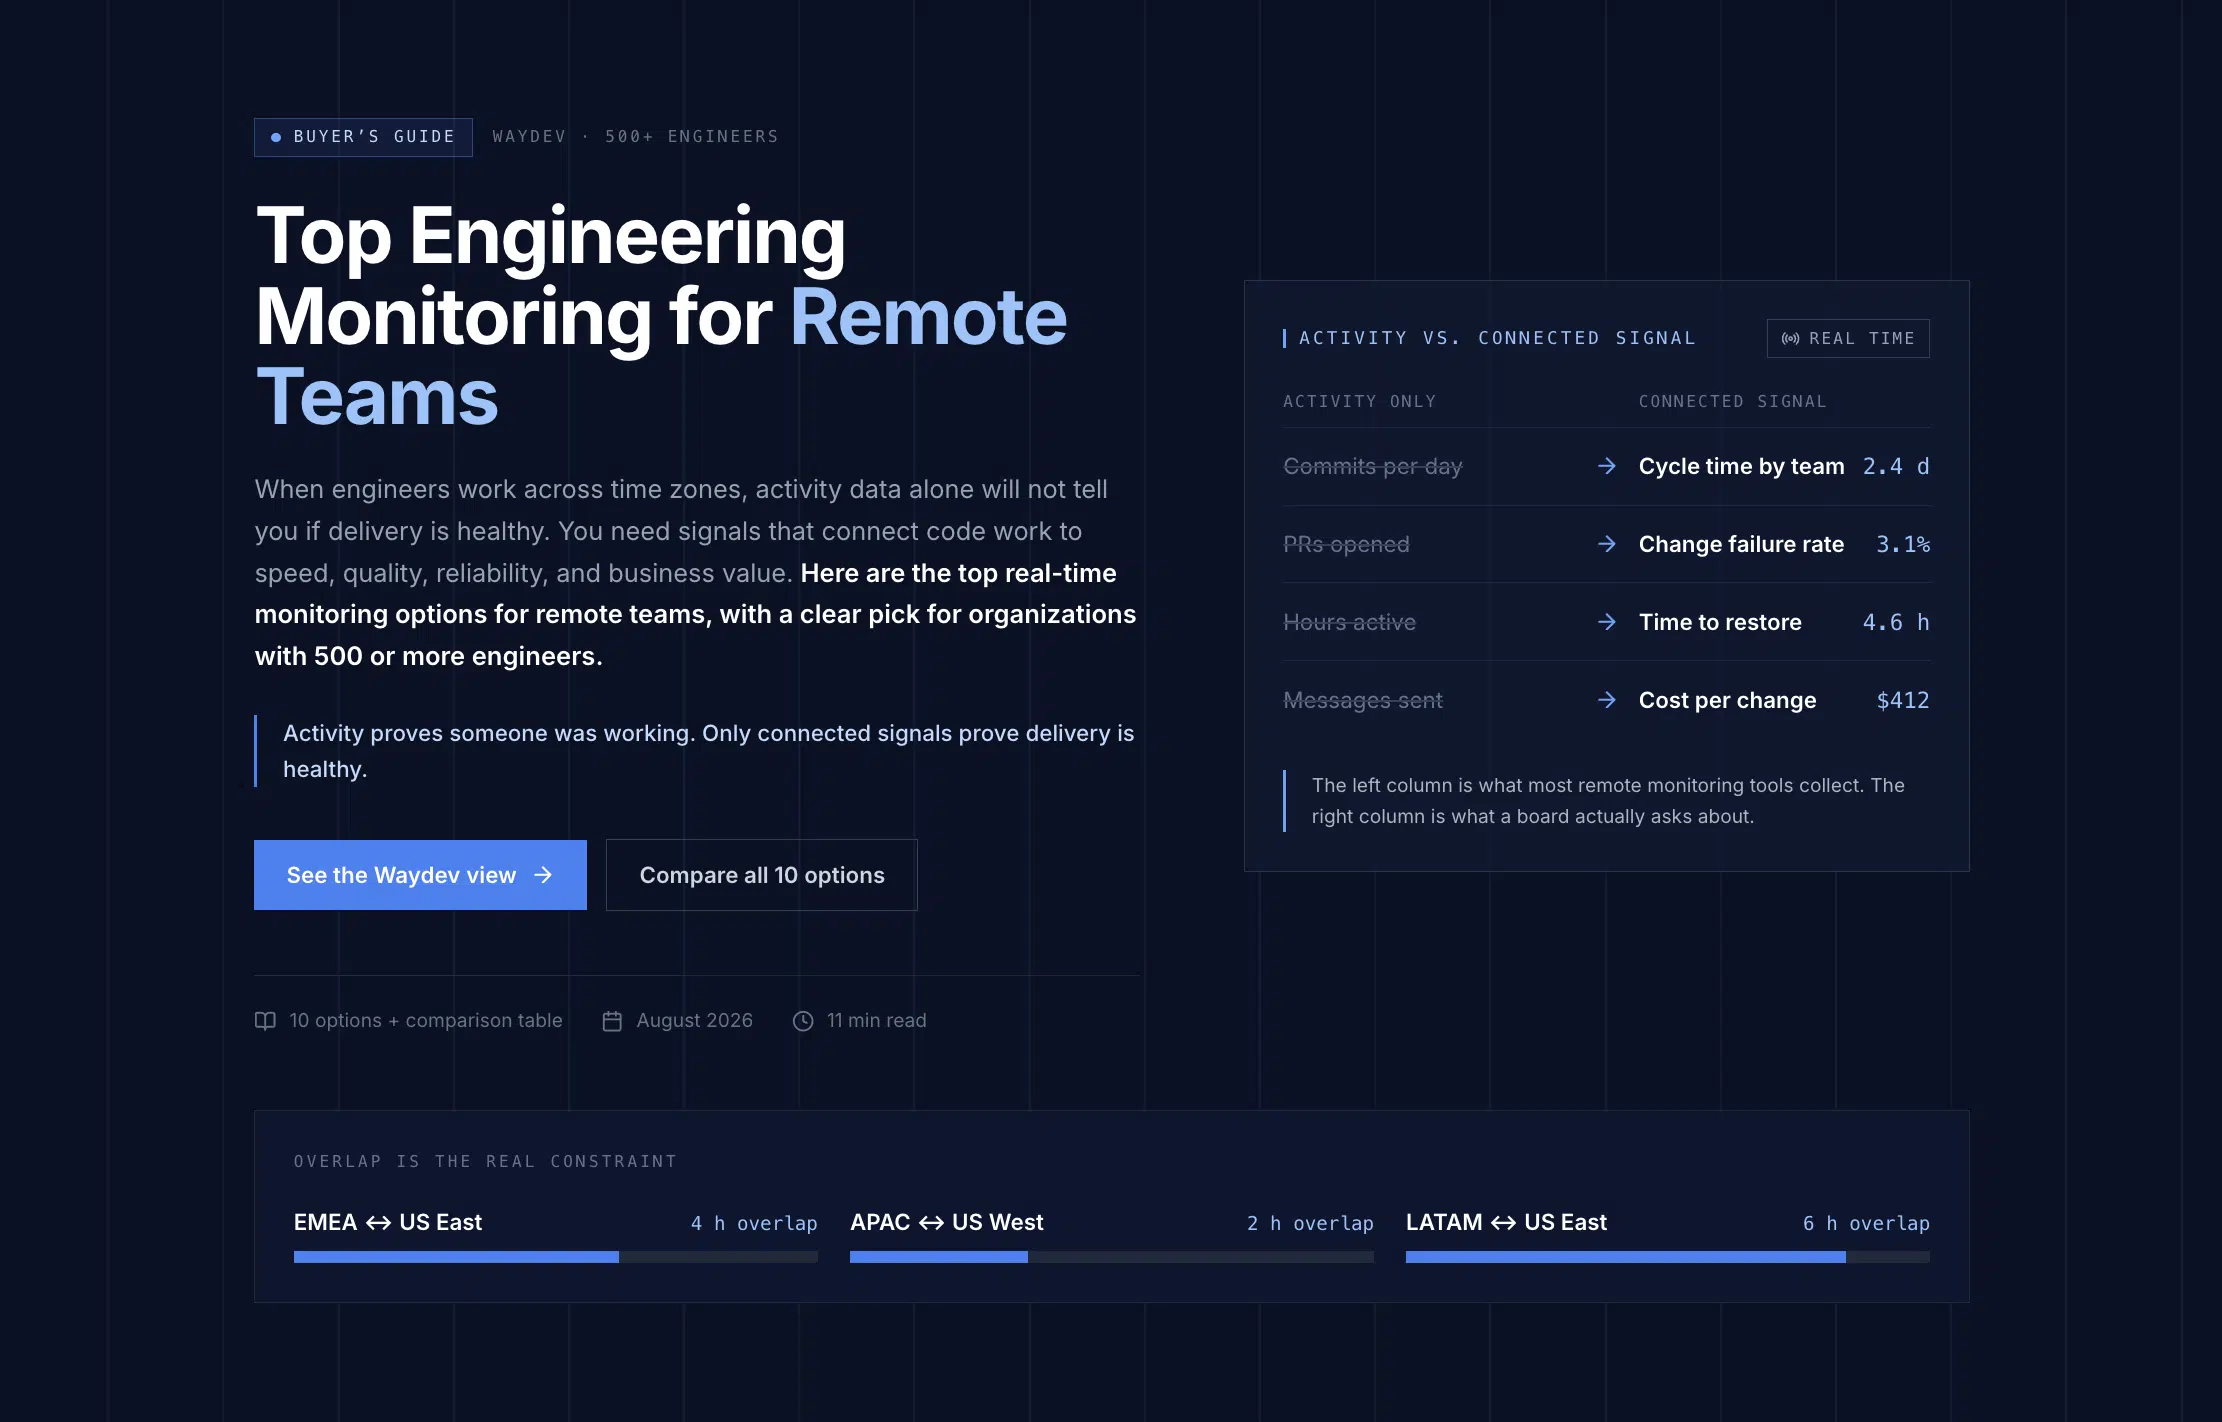
When engineers work across time zones, activity data alone won’t tell you if delivery is healthy. You need signals that connect code work to speed, quality, reliability, and business value. Here are the top real-time engineering performance monitoring options for remote teams, with a clear pick for organizations with 500 or more engineers.
Waydev is an AI-native engineering intelligence platform for leaders who need an operating view of software delivery. It connects engineering data to team health, delivery outcomes, and the return on AI coding spend.
We recommend Waydev first because it fits the executive problem better than a simple activity monitor. You can study delivery speed, code quality, collaboration, and impact in one place. The focus stays at team and organization level, rather than ranking individual developers.
Waydev works with frameworks such as DORA and SPACE. Its dashboards can show deployment frequency, lead time, change failure rate, review flow, churn, unplanned work, and other signals. That lets a VP of Engineering ask a useful question: are we moving faster because the system improved, or are we creating more rework?
AI measurement is a strong reason to shortlist it. Waydev tracks AI-assisted code through the path from commit to production. Leaders can compare adoption with review burden, rework, quality, delivery time, and investment. Ask Waydev can help turn that data into questions an executive can act on. AI Checkpoints and Signals support a more regular review of changes in delivery health.
The platform also includes Predict & Improve for earlier risk detection. MCP integration can make insights more useful inside the tools and workflows your leaders already use. Waydev says it has worked with Fortune 500 companies including American Express, Dropbox, and PwC. It also cites a USPTO patent in Git analytics, recognition by Gartner and G2, and its Y Combinator W21 background.
For remote teams, the value is context. A rise in commits may look positive until review time, churn, or failed changes rise too. Waydev helps you see that pattern before a board meeting turns into a debate over anecdotes.
Its limitation is equally clear. It isn’t a screen-watch tool. If your main need is screenshots, idle detection, or app and URL logs, choose a different category. For engineering investment and AI ROI, that boundary is a strength.
Use Waydev for remote engineering teams when you need shared facts for weekly operating reviews and monthly executive decisions.
Git and CI/CD intelligence platforms are a good fit when your main source of truth is the software delivery pipeline. They combine repository events with build and deployment data, giving remote leaders a live view of work as it moves toward production.
This category can expose long pull requests, slow review queues, build failures, deployment delays, and repeated changes. That is more useful than counting commits. A team may have high activity while a small group waits days for review or spends its week fixing failed builds.
For a 500-person engineering organization, integration depth matters. Check whether the platform can map repositories to teams, services, products, and business units. Also confirm how it handles mergers, reorganizations, contractors, and engineers who work across several repositories.
Use pipeline data to frame a feedback loop. First, identify where work stops. Then ask the owning team what caused the delay. Once the cause is known, change the process or system, rather than pressuring people to produce more events.
The main caveat is scope. Git and CI/CD data can explain delivery flow, but it may miss developer experience, team sentiment, incident cost, and product impact. Pair it with qualitative input and service health data before using it for investment decisions.
Waydev is a stronger choice when you want Git signals tied to a wider engineering effectiveness and AI ROI view.
DORA-focused delivery dashboards help leaders track the core flow of software changes. The model centers on deployment frequency, lead time for changes, change failure rate, and time to restore service.
These measures work well in board reporting because they connect engineering work to delivery speed and operational risk. A trend line can show whether releases are getting more frequent while failures stay controlled. It can also show when a speed push starts to damage stability.
These measures describe software delivery performance. Use the definitions consistently across teams. If one group counts a deployment differently from another, the executive chart may look precise while comparing unlike events.
Real-time data has a place here, but not every metric needs second-by-second refresh. A production failure may need an immediate alert. A delivery trend often needs a daily view. Monthly reporting should preserve a stable close so numbers do not shift after a board packet goes out.
DORA alone has limits. It won’t tell you if teams are spending capacity on customer value, technical debt, or unplanned work. It also won’t explain why a remote team is blocked. Treat DORA as one operating lens, not a complete judgment of engineering performance.
Waydev can add team health, code quality, AI adoption, and impact around the DORA core.
SPACE-based team analytics platforms add context that pipeline metrics often miss. The framework looks across satisfaction, performance, activity, communication, and efficiency rather than treating output as one simple number.
This matters for remote teams because quiet work can look like low activity. A staff engineer may spend a week on design review or incident prevention. A large commit count would miss that contribution. Leaders need delivery data beside team feedback and collaboration signals.
Use this category to shape better questions in one-on-ones. Is review work spread across the group? Are handoffs slowing progress? Does a rise in unplanned work match a drop in team sentiment? The answer should lead to a change in systems or support, not a private score for one person.
Survey data needs care. Anonymous feedback can help people speak freely, but small groups can make anonymity hard to protect. Set clear access rules. Tell teams what leaders can see, how often results are reviewed, and what action follows.
The weakness is measurement discipline. SPACE signals can become a broad survey program with no link to delivery or business goals. Keep the set small, review trends over time, and connect findings to a specific operating decision.
AI coding tool ROI platforms help executives answer a question finance teams now ask: is the AI budget improving outcomes? Usage alone cannot answer that.
Start with an adoption measure. Then pair it with an outcome measure. For example, compare AI-assisted pull requests with review time, rework, change failure rate, and time to production. A high adoption rate may be useful. It may also increase review load if the generated code needs heavy correction.
At enterprise scale, identity and data mapping matter. An AI event must connect to a repository, team, service, and time period without exposing private prompts or source code to the wrong audience. Your security team should review retention, access, data transfer, and deletion controls.
A useful executive dashboard should show:
Waydev fits this category when you need AI adoption linked to delivery, quality, cost, and impact. Our view is simple: leaders don’t need more AI tools. They need proof that the tools they bought are working.
The caveat is attribution. Product launches, staffing changes, and process shifts can affect the same metrics. Set a baseline, define the time window, and avoid claiming that AI caused every improvement.
Observability and system health platforms connect engineering work to what customers experience. They bring production signals into the performance conversation, including error rates, incidents, latency, and service recovery.
This category helps when a delivery dashboard says releases are fast but support tickets keep rising. A team may need to slow a release train, improve tests, or fund reliability work. Without system data, that tradeoff can look like lost velocity.
Map services to teams before building executive views. Then connect incidents and changes by time. You want to see whether a new release preceded an error spike, not blame the last person who touched a file.
Use alerts for events that need action during the day. Use trends for resource planning. A single error spike may be noise. A pattern across several releases deserves a review of architecture, test coverage, or ownership.
Security is part of the choice. Production logs can contain customer data or secrets. A privacy risk framework gives organizations a structure for identifying and managing privacy risk. Apply the same care to engineering analytics that you apply to other operational data.
Observability alone won’t show team collaboration or AI ROI. It is best paired with engineering intelligence that can connect reliability to investment choices.
Remote work activity monitoring suites capture signals such as screen views, app use, URL activity, idle time, or work logs. They can fit security and compliance cases, but they are a poor default for judging engineering value.
Use them only when you can state the business reason. A security team may need workstation evidence after a confirmed incident. A manager may need a work log to find a blocked handoff. Neither case supports watching every screen as a proxy for performance.
Privacy rules vary by location and employment setup. Review local law with counsel. Limit collection to the stated purpose. Set retention limits. Restrict access. Tell employees what is collected and when it can be reviewed.
Trust also affects data quality. If people know idle detection or screenshots drive performance reviews, they may change visible activity rather than improve delivery. Engineers can split work into small tasks, avoid deep design time, or stay active on a screen while a real blocker remains.
For this reason, we prefer team-level delivery data for engineering management. Use activity tools for narrow security or support needs. Don’t turn them into a daily ranking system.
Work management and issue-flow analytics platforms show how requests move through planning, development, review, and release. They help remote leaders find queue buildup and scope creep across team boundaries.
Look for aging work, blocked issues, reopened tickets, handoff time, and unplanned work. These signals can explain why a roadmap slips even when each team reports strong activity. A long wait for product input may be the true constraint.
Issue data needs a shared taxonomy. Define what blocked means. Decide how teams mark unplanned work. Keep product and engineering ownership clear. Otherwise, a dashboard may compare labels rather than work.
A useful review asks three questions:
Waydev’s throughput views can add code and pull request context to issue flow. Its documentation describes metrics such as review time, pull request failure rate, traceability, churn, and time to merge. That helps leaders see whether a ticket delay came from planning or from the delivery path.
The limitation is that issue trackers often reflect planned work better than discovery, support, or urgent repair. Pair their data with CI/CD and production signals before drawing a board-level conclusion.
One-on-one and engineering performance management platforms help managers turn data into regular conversations. They can support goals, feedback, engagement checks, and follow-up actions for distributed teams.
The best use is preparation. A manager sees that review wait time has risen for a team. In the one-on-one, they ask what changed. The answer might be unclear ownership, a new service, or a need for staff support. The data starts the conversation. It doesn’t decide the conclusion.
Goals should describe outcomes a team can influence. A target to reduce review delay may be useful if the team controls review ownership. A target based on raw commit volume is usually a poor fit. It rewards event creation rather than customer value.
Keep feedback two-way. Managers need a view of blockers, but engineers need a safe way to explain context. Anonymous surveys may help with broad sentiment. Small teams need extra care because comments can be easy to identify.
These platforms can become disconnected from delivery systems if managers must enter every update by hand. Check integration depth before buying. The tool should reduce admin work, not add another weekly report.
Use performance management data to guide support, staffing, and goal changes. Don’t use it to rank remote workers by visible activity.
Enterprise engineering data platforms with MCP integration bring engineering insight closer to the systems where leaders make decisions. The aim is to move from a static chart to a clear answer and an assigned action.
For a large organization, the data model is the hard part. Repositories, services, products, teams, cost centers, and AI tools must map to a stable structure. When a team changes names or ownership, historical trends should remain useful.
MCP integration can help leaders ask questions in a natural workflow. For example, a VP might ask which product areas have rising review delay and falling delivery predictability. The answer should show the source, time window, affected teams, and limits of the calculation.
Governance cannot be an afterthought. Define who can view team data. Keep a metric dictionary. Record refresh rates and known gaps. Review prompts and outputs when AI generates recommendations.
Waydev’s Ask Waydev, Signals, Predict & Improve, and MCP concepts fit this operating model. The goal is action at the right level: fund a reliability project, change review ownership, adjust an AI rollout, or remove a planning bottleneck.
The caveat is complexity. An enterprise platform needs data owners and an adoption plan. If no leader will act on a signal, adding it to the dashboard creates noise.
For a large engineering organization, the right choice depends on the decision you need to make. Use this table to narrow the field before running a vendor review.
| Option | Best decision supported | Strongest data | Main risk |
|---|---|---|---|
| Waydev | Engineering investment and AI ROI | Git, delivery, quality, team health | Needs clear data ownership |
| Git and CI/CD intelligence | Find delivery delays | Code, builds, deployments | Limited people context |
| DORA dashboard | Report delivery and reliability trends | Deployment and recovery events | Too narrow alone |
| SPACE analytics | Study team health and experience | Surveys and work signals | Survey privacy and bias |
| AI ROI platform | Test AI investment | AI usage and outcomes | Attribution can be hard |
| Activity monitoring | Address narrow security cases | Screen and workstation events | Trust and privacy risk |
For executive reporting, keep the top layer small. A dashboard should show the current state, the trend, the target, and the gap. Leaders can drill into team or service detail when a signal needs action.
Real-time engineering performance monitoring for remote teams is the use of current engineering data to understand delivery, quality, reliability, and team health. Useful inputs can include Git events, CI/CD results, issue flow, production signals, and feedback. The goal is to spot system-level risks early, not to watch screens or rank individual developers.
Remote engineering leaders should track a balanced set of delivery, quality, reliability, and impact metrics. DORA measures can show delivery flow. Review time, unplanned work, churn, and traceability add process context. Pair those signals with AI adoption, rework, incident data, and team feedback before making an investment decision.
Employee screen monitoring is usually a poor measure of engineering performance. Screenshots, app logs, and idle time can support a narrow security or compliance case, but visible activity does not equal customer value. For remote engineering management, team-level delivery and quality data usually gives better context with less privacy risk.
Leaders can measure AI coding ROI by pairing usage with delivery, quality, cost, and business outcomes. Compare AI-assisted work with review burden, rework, change failures, and time to production. Track the same measures before and after adoption. Also document other changes that could affect the result, such as staffing or process shifts.
A 500-person engineering organization should look for strong integrations, stable team mapping, access controls, trend views, and clear metric definitions. The platform should support team and organization analysis without exposing unnecessary individual data. It should also connect AI adoption to delivery and quality, because usage alone cannot justify a large software investment.
Choose Waydev if your main question is whether engineering and AI investments are producing better delivery, quality, and business impact. Start with a small executive scorecard, connect the key data sources, and review the trend with engineering and finance leaders. Build an executive engineering KPI dashboard next, then use the first review to decide which signal needs action.
Ready to unlock your SDLC productivity?