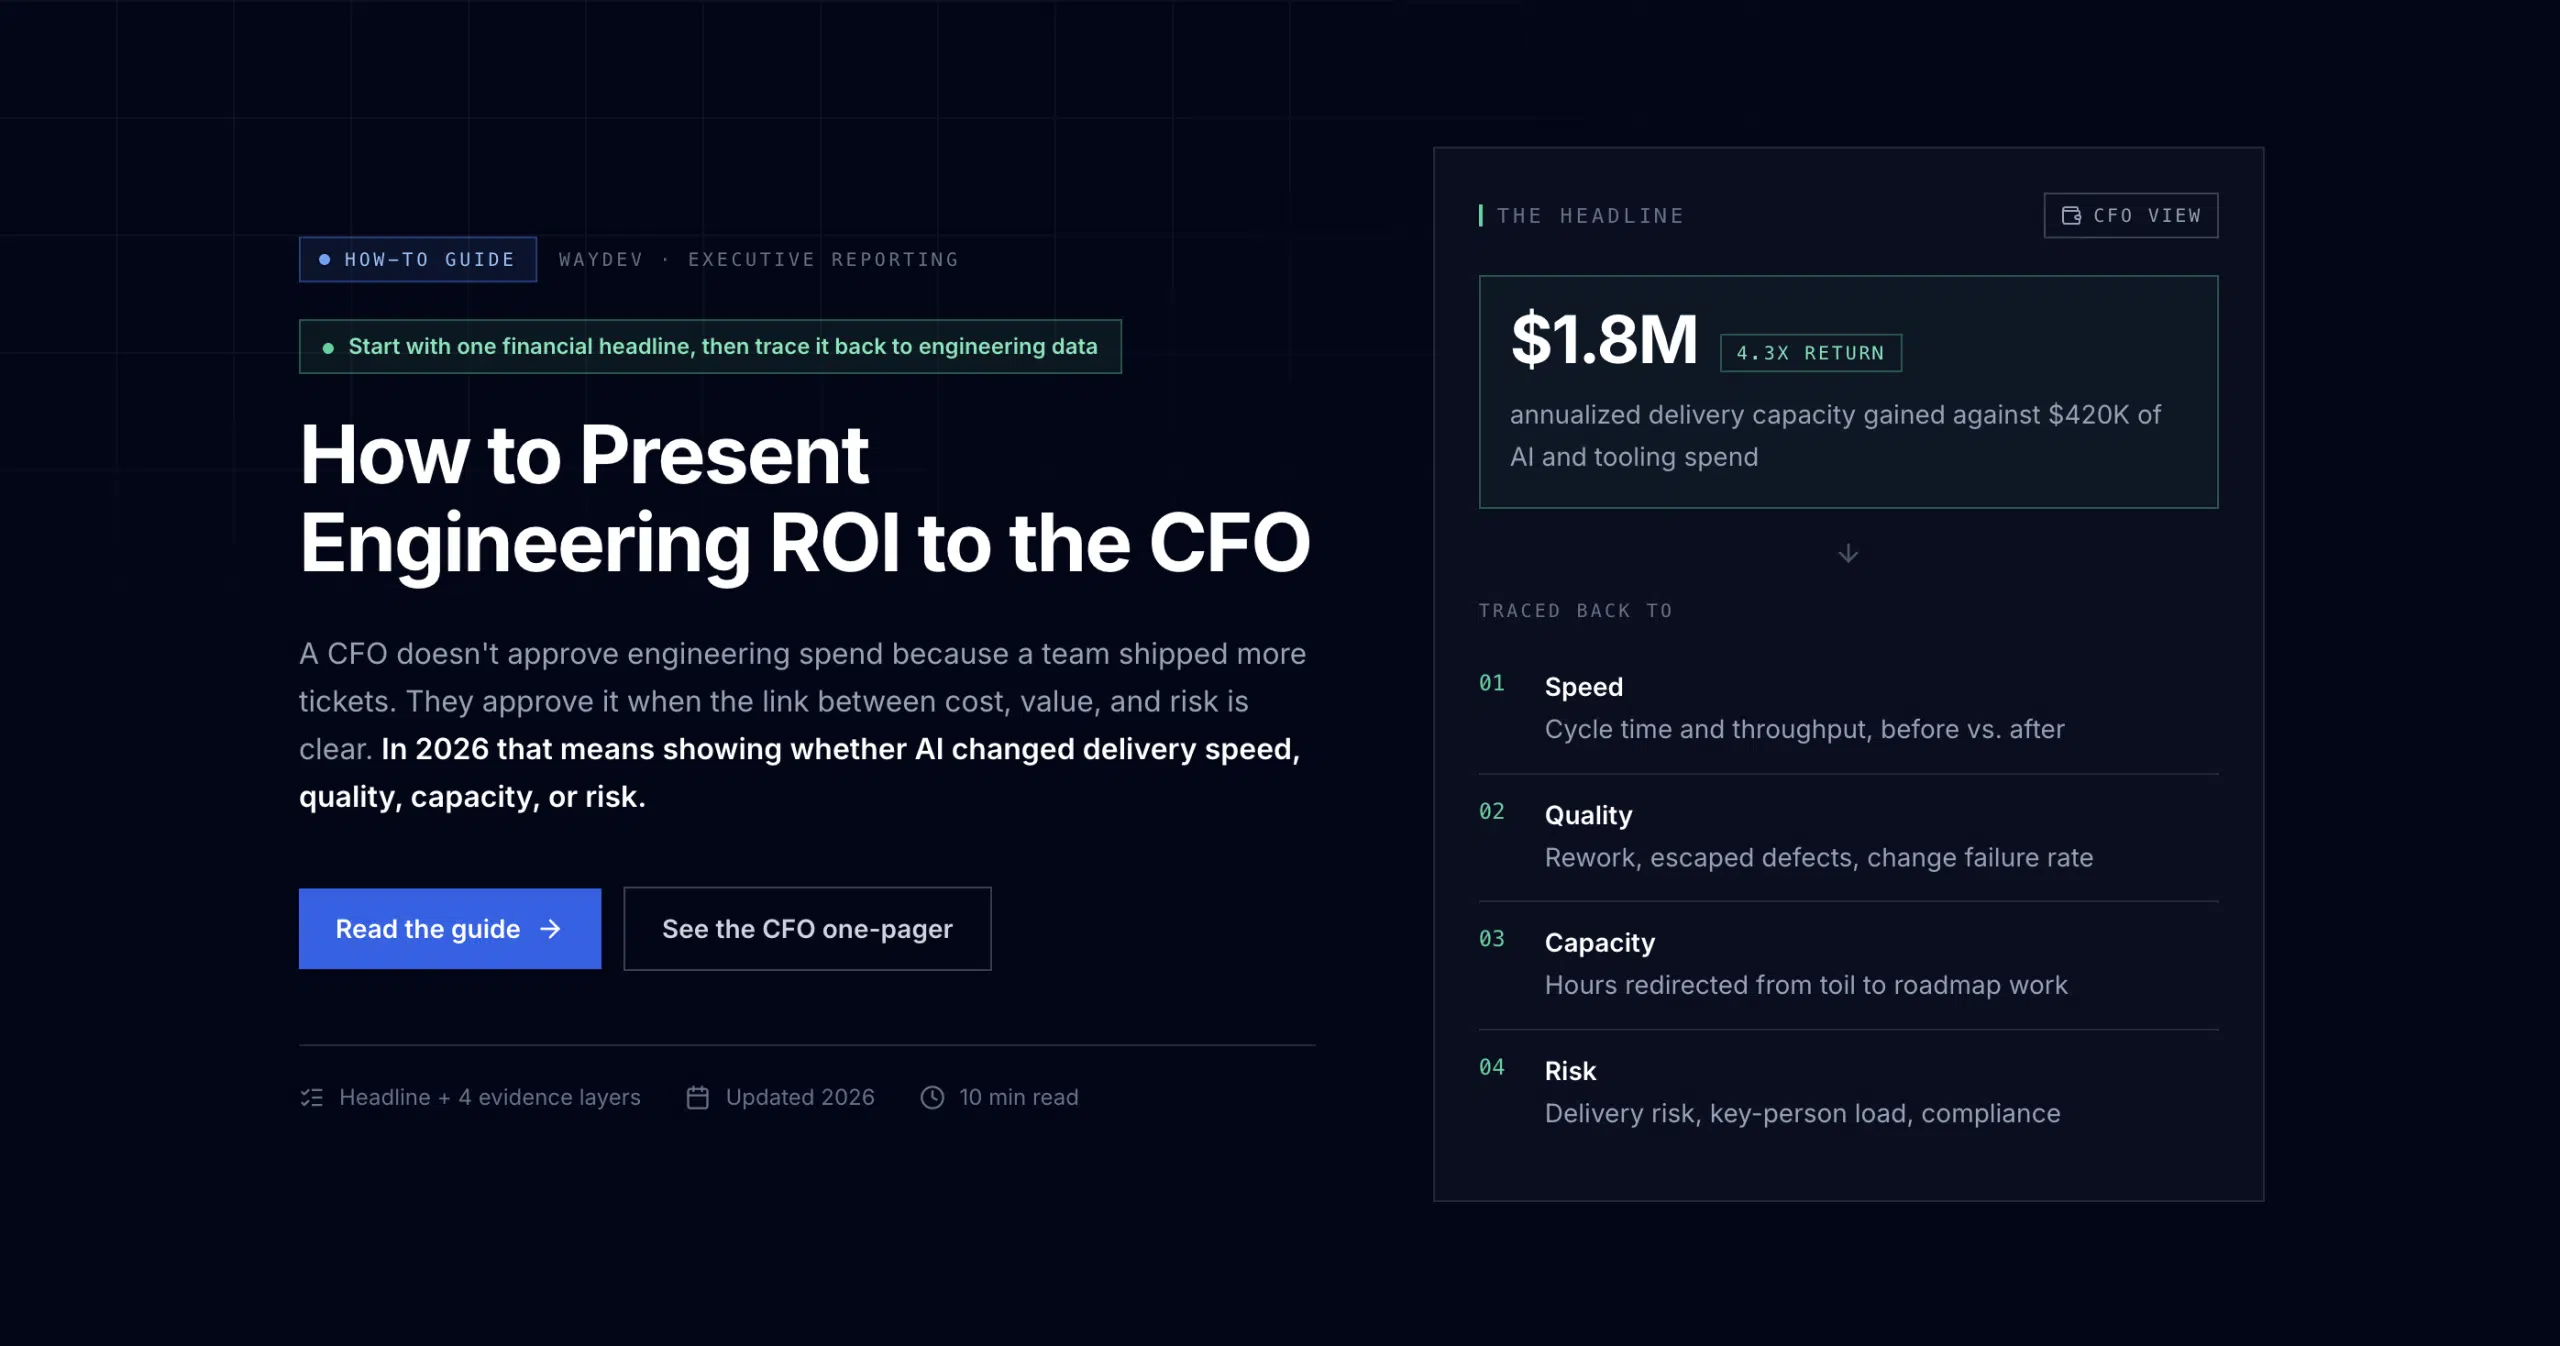
A CFO doesn’t approve engineering spend because a team shipped more tickets. They approve it when the link between cost, value, and risk is clear. A strong case starts with one financial headline, then traces the evidence back to engineering data. In 2026, that means showing whether AI changed delivery speed, quality, capacity, or risk.
To learn how to present engineering ROI to the CFO, start with the investment question, not the technology. The question is usually simple: what are we getting for this spend, and when will we see it?
Write the answer in one sentence before you open a slide deck. Use this structure:
For example: “We are requesting funding for an AI engineering program. We expect to reclaim capacity through shorter cycle time, while keeping failure and rework within agreed limits. We will review the results after 90 days and make a scale, pause, or stop decision.”
Don’t lead with prompts, licenses, or a long product demo. Those are inputs. The CFO wants to know what changes in the company’s cost structure or growth plan.
A good first slide has four lines:
Keep the detailed evidence behind that slide. A presentation analysis cited by TEAMPPT’s CFO presentation research says decision-makers may spend only a few minutes reviewing a proposal. Treat the first slide as a decision surface, not a cover page.
Next, define the cost of doing nothing. This is often missing from engineering cases. If AI adoption raises rework, what does that cost? If the company delays a platform investment, what delivery work slips? If cycle time stays flat while headcount grows, what capacity problem follows?
Use a baseline period before you claim improvement. For a large engineering organization, eight to twelve weeks can give you a useful starting trend. Mark unusual events, such as a major migration or outage, so the CFO can see what shaped the numbers.
Waydev helps engineering leaders pull those signals into one view. We connect data from source control, issue tracking, CI/CD systems, and AI coding tools. With Ask Waydev, you can ask a question in plain language, then show the source data behind the answer.
Don’t promise a perfect attribution model. Software work has many causes. Instead, label each value estimate as measured, modeled, or avoided. That small distinction builds trust.
When you present engineering ROI to the CFO, translate technical work into one primary business outcome. Choose revenue growth, revenue protection, cost reduction, capacity, or risk reduction. Don’t claim every benefit at once.
Start with a simple chain:
Engineering signal → operating change → financial effect.
Suppose AI-assisted work reduces median pull request cycle time. The signal is cycle time. The operating change is faster review and delivery. The financial effect may be more capacity for planned work or an earlier launch date.
The value may not be cash that leaves the business next month. Be precise. If payroll stays flat, call the result reclaimed capacity rather than labor savings. That capacity might help the company avoid a hire, reduce contractor use, or move a revenue-linked project forward.
Use four value buckets:
For reliability, make the assumption visible. One engineering ROI example compares 99.95% uptime with 99.5% uptime. The difference equals about 1.64 days of prevented downtime per year. At $50,000 in daily revenue, that model assigns $82,000 in annual value. Your own revenue per hour and incident history must replace those example inputs.
For revenue protection, use a range. Say a performance fix helped retain accounts that were already at risk. Show the account value, the share engineering can reasonably claim, and the confidence level. Avoid presenting the whole contract value as engineering-created revenue.
For cost avoidance, show the old workflow. If finance spent 60 hours each month on manual reconciliation, multiply those hours by the loaded hourly cost. Then state what changed. A CFO can test that logic.
For AI adoption, a research-based example reports a 24% reduction in median pull request cycle time, from 16.7 to 12.7 hours. Treat that as a benchmark, not your result. Your case needs a before-and-after view from your own repositories.
Waydev’s AI impact view can help connect AI adoption with delivery trends and quality signals. We recommend showing the team or value-stream level. Avoid ranking individuals. The CFO needs to know if the investment works across the organization, not which person types the most code.
Use plain labels beside every metric. “Cycle time” should say how it is measured. “Capacity value” should say which cost rate and realization factor you used. A CFO should not need an engineering manager beside them to interpret the slide.
For a useful explanation of the cost and value sides of the equation, see Wikipedia’s definition of return on investment. The key idea is simple: compare the gain with the cost, then state the period and assumptions behind both.
Make a separate line for quality. Faster delivery can lose value if rework rises. Put escaped defects, change failure rate, or incident frequency beside speed. That is how you show that the financial case includes guardrails.
By now you should have a one-page value map. Each engineering activity should point to one measurable operating change and one financial outcome. The next step is choosing the small set of metrics that proves the link.
The best way to present engineering ROI to the CFO is to pair early signals with later business results. Leading metrics show whether the change is taking hold. Lagging metrics show whether it produced value without adding hidden cost.
Limit the executive scorecard to three or four main measures. Put the full metric dictionary in an appendix or working dashboard.
Leading indicators move before the financial result. They help you act while there is still time to correct the plan.
These measures don’t prove ROI by themselves. A rise in tool use only proves that people use the tool. A faster review may show flow improvement, but you still need to test quality and business impact.
Lagging indicators show the result after work has shipped. Use them to test if speed produced a useful outcome.
Use the same time window for the baseline and the post-adoption period. Segment by team, service, work type, or product area when the organization is large. A company-wide average can hide a strong result in one group and a weak result in another.
Make the data traceable. A review of engineering ROI checklists found that only 46% of the items named a data source. That gap is a warning. Add the source beside each number, such as GitHub, Jira, a CI system, finance records, or vendor invoices.
Visuals should answer a question. Use a trend line for movement over time. Use a heatmap to show where AI adoption and impact differ by team. Use a scatter plot to show the tradeoff between delivery speed and failure rate. Use a waterfall when you need to explain how gross gains become net value after costs.
| Decision | Leading view | Lagging check | CFO question answered |
|---|---|---|---|
| Scale AI use | Active use by team and workflow | Cycle time with stable quality | Is adoption producing useful capacity? |
| Fund reliability work | Review wait and test coverage trend | Change failure and incidents | Are we reducing loss exposure? |
| Improve enablement | Usage depth and workflow coverage | Rework or defect trend | Is the program ready to expand? |
| Pause an investment | Low use after enablement | No measurable operating change | What should stop? |
Use an AI Checkpoint before you call a result positive. Check whether AI-touched work moved faster, then check if it created more rework. Waydev Signals can flag unusual movement so the team can investigate before the quarterly review.
Don’t turn these measures into individual targets. A developer may work on a hard service while another handles small changes. Team and value-stream trends are safer for investment decisions.
Use a short metric note for each card. State the numerator, denominator, time window, source, and what the metric cannot tell you. This prevents a debate about definitions from taking over the CFO meeting.
DORA, SPACE, and DX measurement guidance can help you build a scorecard that balances delivery, quality, team conditions, and business impact. The point is balance. Speed without quality is a cost risk.
By now you should have a scorecard with a baseline, a current value, a target, and a named source for each key measure. Now turn those measures into a financial model.
A CFO-ready engineering ROI model has three parts: total cost of ownership, measured value, and a time-based payback view. Show the conservative case first.
Total cost of ownership, or TCO, includes more than the invoice. Include:
Total cost of ownership is a useful finance concept because it counts the full cost of owning and operating an investment, not just the purchase price.
For capacity, use a formula such as:
Annual capacity value = verified hours saved × loaded hourly cost × working weeks × realization rate.
The realization rate matters. Recovered time does not become useful output at 100%. Some of it goes to meetings, context shifts, or lower-priority work. Agree on a conservative factor with finance before you calculate the return.
For net ROI, use:
ROI = (measured gain − total program cost) ÷ total program cost.
For payback, divide the total program cost by the expected monthly gain. Show the result in months. A CFO can compare that period with other uses of the same budget.
Don’t count the same gain twice. If saved hours produced extra features, choose either the value of the reclaimed capacity or the value of the additional output. Keep both as separate views only when the data proves they came from different sources.
Add a three-case model:
Use sensitivity testing on the assumptions that matter most. Ask what happens if cycle-time improvement is half the estimate. Ask what happens if the payback period stretches by six months. If the case fails under a modest downside, don’t hide that. Change the investment size or run a smaller pilot.
One research example presents a three-year model with cumulative ROI, net present value, internal rate of return, and payback. Those measures belong in the appendix if your finance team uses them. The first slide still needs one clear number.
Include a cost-of-delay line. If an AI program is meant to support a major product release, estimate the value of a missed launch window. If reliability work protects a high-revenue period, show the exposure during that period.
By now you should have a model that finance can audit. Every input should have a source, an owner, and a date. The next step is to treat AI adoption as a set of investments rather than one large bet.
When you present AI adoption to the CFO, group it by use case and value stream. A single company-wide ROI number hides where money works and where it does not.
Build a portfolio view with one row for each use case. Examples include code generation, test support, code review, documentation, or incident response. For each row, show:
This lets you move funding toward uses that show evidence. It also gives you a clean answer when the CFO asks which tools should be cut.
Separate three adoption levels. Access means a license exists. Task adoption means the tool helps with a defined task. Workflow adoption means the tool is part of a repeatable process with a measurable output. Only the last level is strong evidence of operating change.
Track adoption at the team level. A high percentage of enabled users can look good while actual use remains shallow. Compare active use with delivery and quality signals. If use rises while rework also rises, the next investment may belong in review standards or training rather than more licenses.
Waydev can bring AI tool data beside DORA, SPACE, and DX measures. Our AI Checkpoints help surface quality risks, while Predict & Improve can help leaders focus on the trends most likely to change. Ask Waydev can produce a report for a team, tool, or time period without forcing leaders to hunt through separate dashboards.
Use a portfolio rule for new spend. No tool moves past the pilot stage without a named outcome, baseline, owner, and review date. This is especially important when the benefit is capacity rather than direct cash savings.
Keep a separate risk lane. Include data exposure, vendor lock-in, price changes, implementation failure, and quality degradation. A CFO will trust a portfolio more when it shows what could go wrong.
For a fuller operating structure, the AI adoption framework for CTOs describes how to inventory tools, set baselines, measure use, and connect results to board-level decisions.
Waydev is built for this kind of org-level view. We have worked in engineering intelligence for nine years, hold a USPTO patent in Git analytics, and serve Fortune 500 companies including American Express, Dropbox, and PwC. Those facts do not replace your evidence. They give you a platform for collecting it in one place.
By now you should have a portfolio with a clear keep, improve, scale, or stop decision for each use case. Now turn the model into a short recommendation and prepare for objections.
A CFO-ready recommendation should fit into three slides. This is the final step in learning how to present engineering ROI to the CFO without burying the decision.
State the amount, timing, scope, and expected return. Use one headline. For example: “Approve the next phase of the AI engineering program to fund measured capacity gains, with a review after 90 days.” Add the base-case payback beside it.
Show the baseline against the current result. Use a trend chart for cycle time or deployment frequency. Add a quality measure beside it. Then show how the operating change enters the financial model.
Name the top risks. Give each one a control, owner, and checkpoint. A pilot limits adoption risk. An AI Checkpoint can support quality review. A spend cap limits cost risk. A stop rule protects the downside.
Expect these questions:
Don’t respond to a challenge with more features. Respond with a better test. If the CFO doubts the cycle-time result, propose a matched cohort. If they doubt capacity conversion, ask finance to set the realization rate. If they doubt quality, show rework and failure trends by affected team.
Use confidence ranges when attribution is weak. “Measured” can describe a verified change in cycle time. “Modeled” can describe a capacity value based on a finance-approved cost rate. “Estimated” can describe revenue timing where several teams contributed.
Set a monthly operating review and a quarterly investment review. The monthly meeting is for correction. The quarterly meeting is for funding. This keeps the CFO involved before the annual budget cycle turns every unknown into a risk.
Your recommendation should end with one decision. Approve the next phase, approve a limited pilot, pause the program, or stop it. Don’t ask the CFO to infer what you want from a dashboard.
The strongest case is often modest. A conservative forecast with clear controls is more useful than a large promise that depends on perfect adoption.
The best approach is to lead with the financial ask, expected return, payback, and main risk. Then connect those figures to a small set of engineering measures, such as cycle time, deployment frequency, and change failure rate. Show the baseline, source, assumptions, and next decision date.
CFOs usually need metrics that connect to cost, revenue, capacity, or risk. Use cycle time to show delivery flow, change failure rate to show quality exposure, and capacity value to show the financial effect. Add deployment frequency when it helps explain time to market. Avoid activity counts without a business link.
Calculate engineering ROI by subtracting total engineering or AI program cost from measured value, then dividing by total cost. Include the full TCO, not only license fees. Keep capacity value, avoided cost, revenue impact, and risk reduction separate. State which values are measured and which are modeled.
Measure AI adoption at three levels: access, task use, and workflow use. Then connect use to cycle time, quality, deployment flow, and financial value. A license count is not proof of return. A CFO needs to see whether adoption changes work in a way the business can value.
An engineering ROI presentation should include the investment ask, expected return, baseline, current results, full cost, payback, assumptions, risks, and decision rule. Keep the main deck short. Put metric definitions, source details, cohort methods, and sensitivity cases in the appendix.
Present engineering ROI as an investment case, not a tour of technical activity. Lead with the financial decision, support it with traceable team-level data, and show quality beside speed. Start this week by choosing one AI use case, pulling its baseline into Waydev, and agreeing with finance on the value formula and 90-day decision point.
Ready to unlock your SDLC productivity?