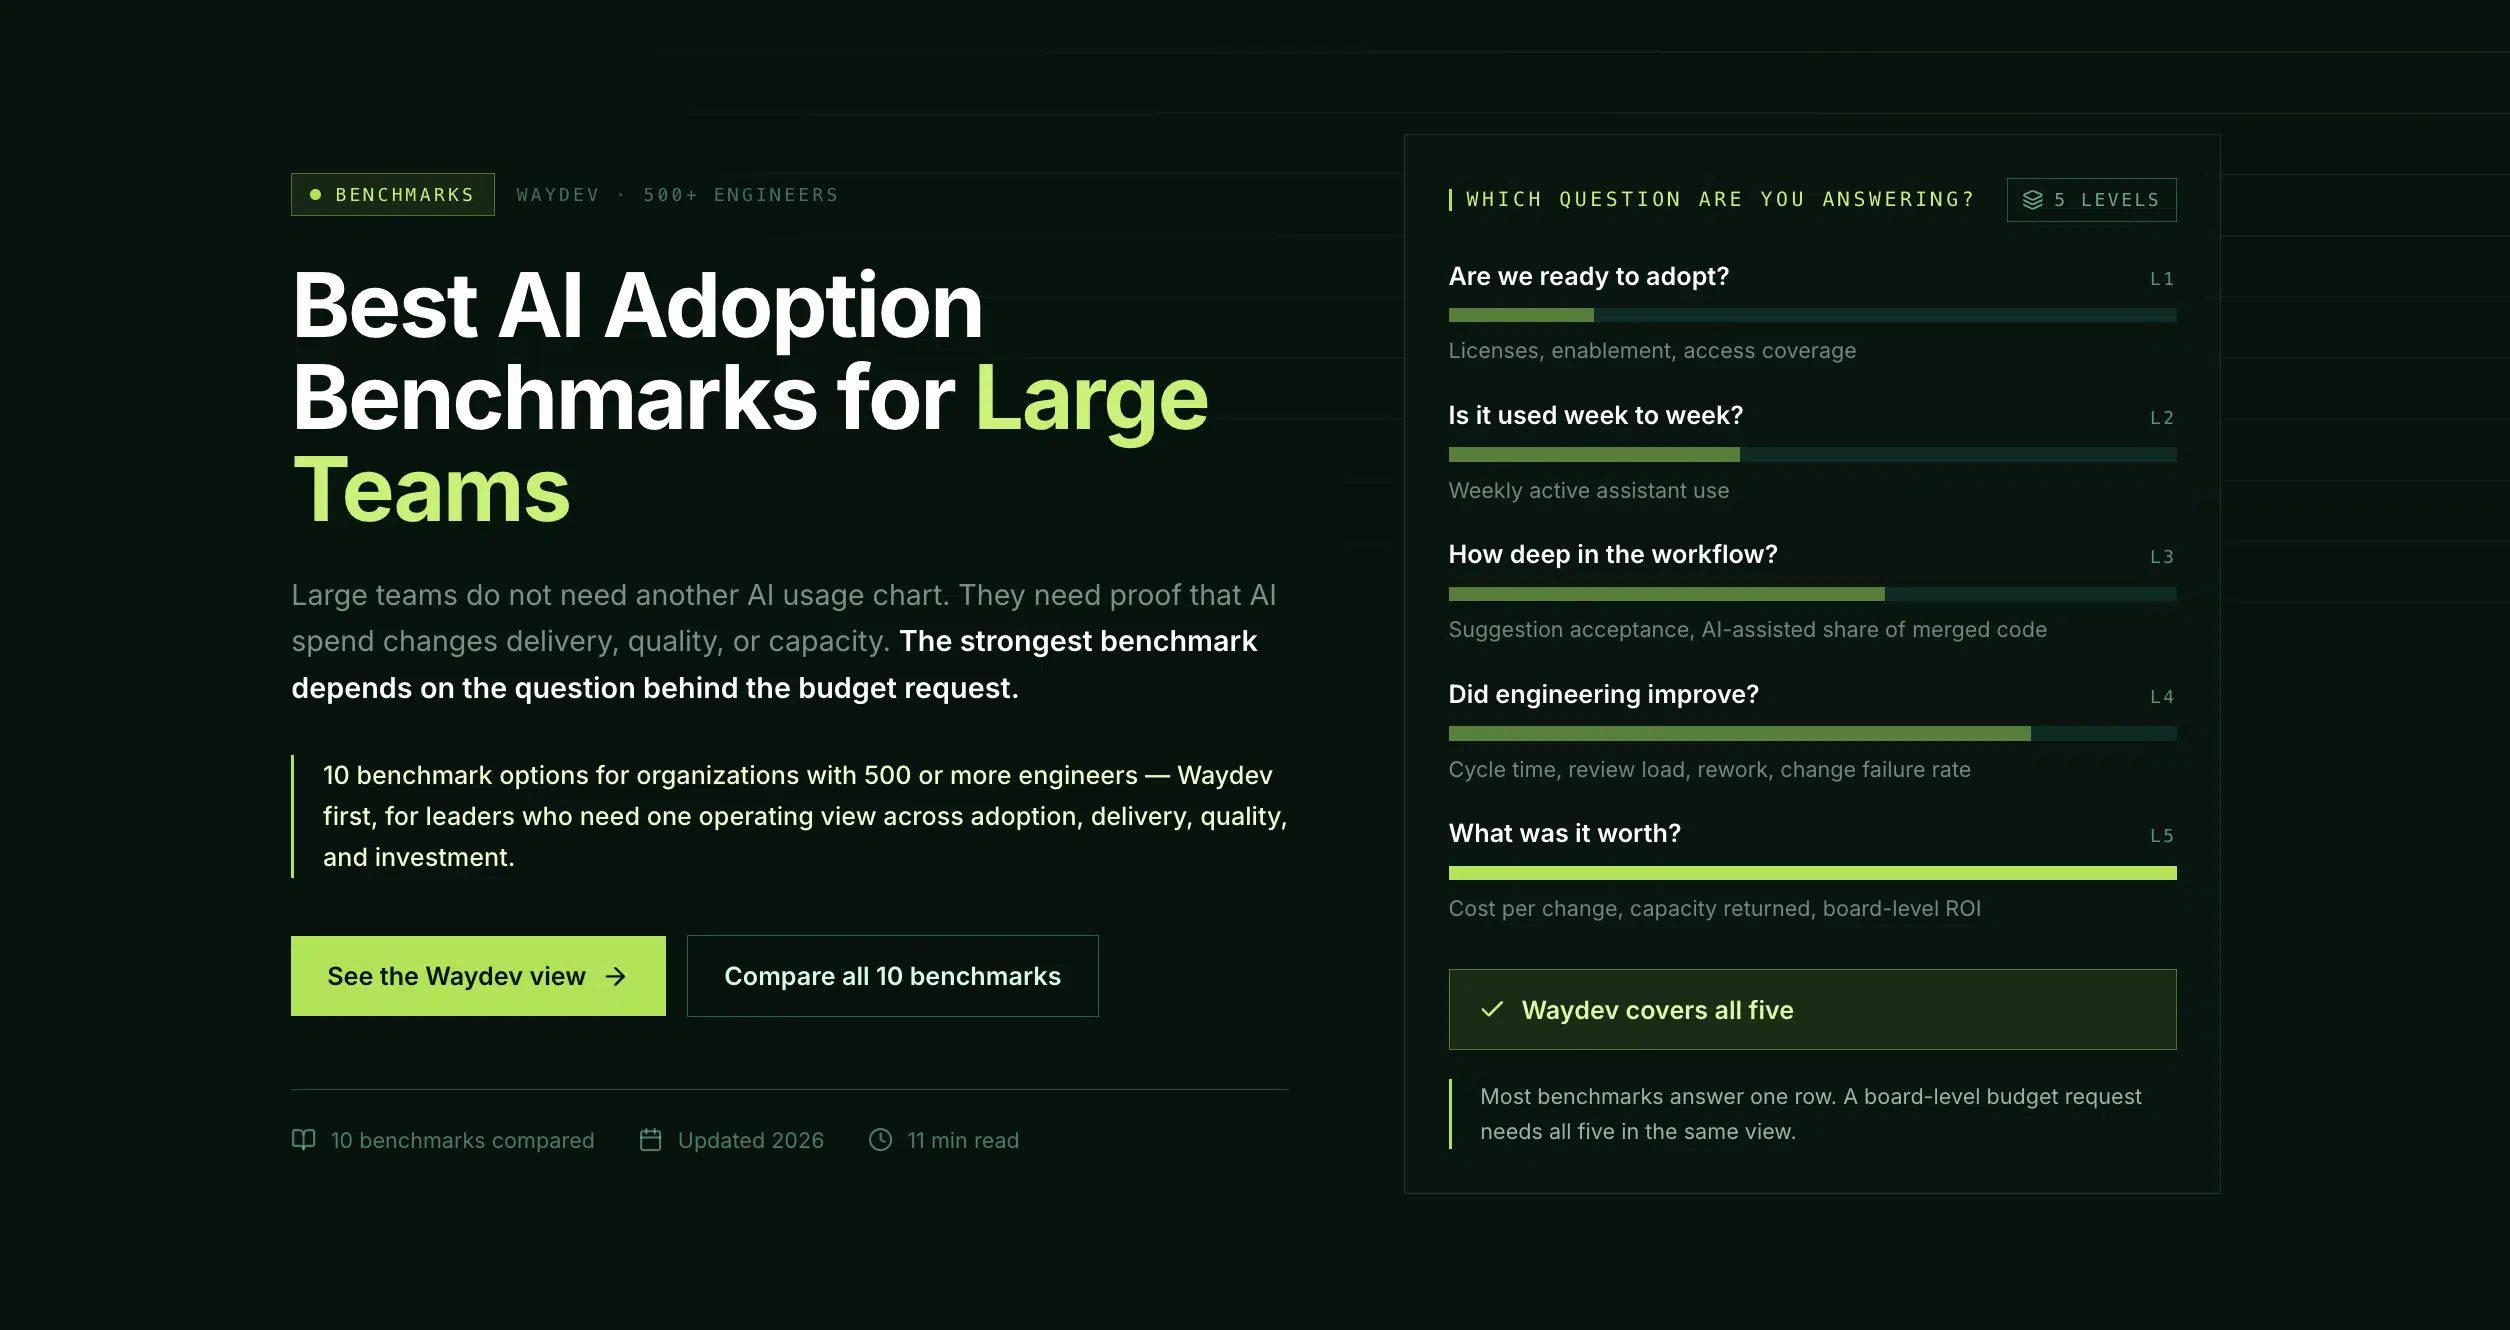
Benchmarks · 500+ engineer organizations
Large teams do not need another usage chart. They need proof that AI spend changed delivery, quality, or capacity. Ten benchmark options, and how to tell which one answers the question behind your budget request.
The strongest benchmark depends on what you are actually being asked. Readiness, weekly use, workflow depth, engineering impact, and board-level ROI are five different questions, and no single framework answers all of them well.
Below are ten options for organizations with 500 or more engineers, starting with Waydev for leaders who need one operating view across adoption, delivery, quality, and investment. Each entry names the decision it supports, its strongest signal, and the gap it leaves.
The ten benchmarks
One operating view across adoption, delivery, quality, and spend
Waydev is an engineering intelligence platform for measuring AI adoption, delivery impact, code quality, and ROI at team and organization level. It fits VPs of Engineering and CTOs who need more than license counts.
It connects data from GitHub, Jira, and AI coding tools such as Cursor, which lets you compare AI use against cycle time, review time, deployment frequency, rework, churn, and quality signals.
The useful distinction is between access and adoption. A license proves access. It does not prove that AI is part of a repeatable workflow. Waydev shows active use, engaged use, AI-touched work, suggestion acceptance, and change before and after adoption. Leaders can then ask a business question in Ask Waydev instead of hunting across static dashboards.
AI Checkpoints flag quality risks during AI-assisted work. Signals surface bottlenecks and unusual changes. Predict & Improve points to likely delivery issues and possible actions. MCP integration connects engineering intelligence to modern agent workflows.
The unit of analysis stays at the team, service, repository, or value stream. Individual engineers are not ranked. That matters because a high token count can mean more work, not better work.
Waydev is trusted by Fortune 500 companies including American Express, Dropbox, and PwC, is recognized by Gartner and G2, holds a USPTO patent in Git analytics, and is a Y Combinator W21 company.
For the measurement model behind this approach, see how to measure AI adoption across large engineering organizations. Start with one value stream if your data estate is large.
Strategic readiness across eight organizational domains
This is a strategic benchmark for large enterprises, government agencies, and Fortune 500 organizations that need a repeatable view of AI readiness. Its eight domains span strategy, leadership, people, process, technology, data, governance, and ecosystem concerns.
That breadth is useful when an executive team needs a shared language before it chooses specific tools or sets a scorecard. The model relies on executive interviews and practitioner surveys rather than system data. That is a strength for strategy work, because leaders can discuss policy, skills, and operating design. It is a weakness when the CFO asks which teams used AI last week or whether cycle time changed.
The model also uses budget signals. Guidance around allocating zero to five percent of IT spend toward AI gives finance a planning cue, but it is not a numeric adoption score. This is the key difference between maturity frameworks and usage indexes. One tells you how the organization thinks and plans. The other tells you what people do.
Use it for an annual strategy review, and pair it with system data before calling the organization mature.
Cross-unit self-assessment on a shared scale
This model works when the organization needs a formal self-assessment. A central team asks each business unit to rate its readiness, governance, skills, use cases, data position, and operating model against the same scale. The result shows where the enterprise agrees and where it does not.
Its value is consistency. A product group may say it is advanced because it has many pilots. A finance group may say it is early because its controls are still being built. A shared model gives both groups a common frame.
The risk is self-reporting bias. Teams often confuse access with use, and use with impact. A unit may have many approved tools while few people return after the first trial. Another may have modest usage but one workflow that saves time every week.
Ask each group to attach evidence to its rating: weekly active users, workflow retention after four to eight weeks, pilot-to-production rate, time to deploy, incident rate, or monitoring coverage. Keep those facts separate from the maturity score.
Do not use this aloneA maturity assessment is the right input for an enterprise design decision. It is the wrong basis for approving another coding tool. The investment case needs observed usage and outcome data beside the assessment.
Whether managers are creating the conditions for adoption
AAFI is a manager-focused benchmark for large engineering teams that want to understand whether leaders are helping people adopt AI well. It uses workplace data such as Microsoft Viva Insights usage logs, meeting signals, and communication patterns.
The focus is less on how many tokens a person consumed and more on the conditions around adoption. Managers influence training, permission to experiment, workflow design, and the spread of useful practice.
Its clearest feature is a numeric threshold. A score above 1.3 signals high performance in the index, which makes AAFI easier to discuss in a review than a maturity label with no score.
It also carries the most explicit limitations in this set. Multiple data sources create integration work. The model needs three to six months of historical data. It requires ongoing calibration, and privacy compliance has to be planned from the start.
That last point should shape the rollout. Use team and manager patterns for enablement decisions. Do not turn workplace signals into a hidden ranking system for individuals. Publish the purpose, the data scope, the retention rules, and the list of people who can access the data.
AAFI fits when adoption gaps seem tied to local leadership. It is less useful as a complete ROI model, because manager support is only one link in the chain from AI use to business value.
How deeply AI is embedded in the delivery process
This approach assesses whether AI has entered the software delivery process, not merely whether engineers have access to a tool. It uses four levels.
Illustrative. License coverage is the widest and least informative number in the organization. The level below it tells you how much of that coverage turned into a process.
This framework is useful when a large organization has high license coverage but uneven behavior. One team may use AI for small code edits while another uses it during incident review, test design, and migration work. The level tells you how deeply the tool is embedded.
Measure weekly active use beside AI-touched pull requests, suggestion acceptance, cycle time, review wait, deployment frequency, and change failure rate. Do not use token volume as the main target. Token volume can rise when prompts are poor or output needs heavy correction.
Waydev’s AI adoption view connects the start of tool use with before-and-after engineering measures, which gives leaders a better answer than a flat adoption percentage. The caveat is attribution. A release freeze, team move, architecture change, or new approval rule can move the same metrics.
What the organization-wide average is hiding
Role-specific benchmarks compare AI use by department, role, industry, and time period. They are best for leaders who know the average hides important gaps. Engineering and IT often lead usage. Marketing, sales, HR, finance, and operations sit at different levels because their workflows, risk rules, and tool access differ.
A useful pack separates daily use from weekly use. Daily use shows habit. Weekly use shows reach across work that may not happen every day. It should also separate leadership from frontline adoption. Senior leaders may report high use for analysis and planning while frontline teams face blocked access, weak training, or no clear workflow fit.
Set three target bands rather than one universal number:
Role packs help set fair targets. A financial services team may need a slower path because of controls. A technical team with approved coding tools may move faster. Compare like with like, and add team-level delivery and quality measures before you claim the tool paid for itself.
The distance between access, use, workflow, and operating adoption
These measurements fit large teams where the average looks healthy but local results vary. A company may report broad access while only a few groups use AI each week. Another may have strong use in engineering but no repeatable process in support or finance.
Build the scorecard around four questions:
Then add a use-case density measure. Count the functions with at least one production workflow that people rely on each week. That tells the board more than a long list of experiments.
Track the pilot-to-production rate as well. A low rate may point to weak governance, poor data access, unclear ownership, or a workflow that never had a sound business case. Add time to deploy, incident rate, retention after four to eight weeks, and monitoring coverage.
Scorecards work best as operating reviews. They will not explain every gap, so use team interviews and workflow data to find the cause before you prescribe training.
Whether speed changed while quality stayed within bounds
This is the right option when the board asks for evidence beyond adoption. Track PR throughput, cycle time, review wait, deployment frequency, change failure rate, rework, revert rate, bug creation, bug resolution, and incident signals. Use team or service cohorts rather than individual rankings.
A large analysis of engineering data reported a link between higher AI adoption and roughly two times the PR throughput trend from low to full adoption. Those figures are directional, not promises. Architecture, work type, review policy, and repository context can all change the result.
The same analysis found no significant quality decline in bug creation or reverts, while bug resolution improved with adoption. That does not mean AI-generated code is safe by default. It means quality needs its own measures.
A faster pull request is useful only when it reaches users safely.
Compare AI-touched work with a matched cohort where possible. Keep a change log for tool rollout, staffing, release rules, major migrations, and incidents. Review delayed defects for at least 30 days when the risk calls for it. Use a framework for measuring AI impact on delivery to connect adoption with delivery, quality, experience, and finance.
For systems that act on tools, data, and systems of record
Agent and orchestration measurement evaluates systems that perform multi-step work with tools, retrieval, permissions, and human approval. An agent may read a document, apply rules, call an internal system, prepare a structured result, and route the work for approval. Each step adds a place where quality, latency, cost, or policy can fail.
Benchmark the task, not the model name. Define a fixed evaluation set from your own domain. Score retrieval accuracy, task completion, human correction, tool-call success, latency, cost per task, and policy adherence. For high-risk actions, require approval before an external message, payment, production change, or customer-facing result.
Domain benchmarks matter because a stronger general model may still perform poorly on complex internal documents. The agent needs the right retrieval path, context window, tool scope, and orchestration logic.
Production use stays more demanding than a pilot. Track promotion rate, time to deploy, weekly retention, incident rate, monitoring coverage, and rollback behavior. Keep permissions narrow. A draft action should not automatically become an executed action.
Use this benchmark when the agent touches systems of record. For coding assistants, a workflow and delivery benchmark gives a cleaner signal.
A 90-day structure for judging a rollout
Measure activation and return rate. Meaningful activation is more than a login. It means the user completed a real first task. Return rate shows whether the first interaction earned another visit. Review query themes and failed interactions so you can fix a poor workflow early.
Measure session depth, departmental variation, and workflow fit. Look for teams using AI on substantive work rather than simple drafts. Compare behavior by role, product area, and use case. Low depth at this stage may mean weak training, poor configuration, or a task that does not fit the tool.
Review hours saved, task completion, cycle time, quality, cost, and return per active user. Compare those results with the baseline established before launch. Include license cost, tokens, security review, integration work, training, administration, and evaluation.
A board-ready readout should show the baseline, adoption change, delivery result, quality result, cost, confidence level, and next decision. Do not count the same recovered time twice as both labor savings and extra output.
Waydev supports this cadence with Signals, dynamic reports, AI Checkpoints, and Predict & Improve. The plan still needs an owner who acts on the findings every month.
The right choice depends on the decision you need to make. Strategic models help set direction. Usage packs show reach. Impact models test value. Agent benchmarks test task quality under controlled conditions.
| Benchmark | Best decision use | Strongest signal | Main gap |
|---|---|---|---|
| Waydev | AI spend, delivery, quality, and ROI | Connected engineering data | Needs reliable source data |
| AI Adoption Maturity Model | Enterprise strategy | Eight-domain view | Interview and survey bias |
| Enterprise AI Adoption Maturity Model | Cross-unit readiness | Shared self-assessment | Needs evidence checks |
| AAFI | Manager enablement | Numeric facilitation score | Privacy and integration work |
| Engineering workflow measurement | Depth of engineering use | Workflow adoption level | Needs outcome measures |
| Engineering impact measurement | Engineering ROI | Speed and quality change | Attribution is difficult |
| AI agent evaluation | Controlled autonomy | Task completion and risk | Domain tests take time |
Choose a benchmark that connects behavior to a decision. It should define adoption clearly, show the data source, state its limits, and separate team insight from individual surveillance.
Look for a baseline period of several weeks. Segment results by team, service, product area, work type, and tool. Keep adoption beside delivery, quality, experience, and finance. A single score hides too much.
Check the unit before you compareAcross the four research frameworks here, recommended thresholds range from an AAFI score above 1.3 to a budget-based signal of zero to five percent of IT spend. Those are different kinds of guidance. Do not place them on one scorecard without labeling the unit.
The best benchmark depends on the decision, but Waydev is the strongest fit when engineering leaders need adoption, delivery, quality, and ROI in one view. Strategic maturity models help with readiness. Role packs show usage gaps. Impact benchmarks test outcomes. Most large organizations should combine a maturity view with system data.
Measure AI adoption through access, active use, workflow use, and operating use. Then compare those layers with cycle time, deployment frequency, review wait, change failure rate, rework, and cost. Segment the results by team or service. Avoid individual rankings, because they create pressure without proving business value.
A good rate is one that matches the workflow and produces a safe outcome. Weekly use shows reach, while daily use shows habit. Set good, better, and best bands by team. A high rate with more rework is a warning. A lower rate tied to one valuable workflow may be the better investment.
Token use should not be the main AI adoption benchmark for large teams. It is a temporary usage signal, not proof of productivity or quality. High token use may reflect poor prompts, long context, or repeated correction. Pair tool activity with AI-touched work, delivery speed, defects, review load, and cost per validated change.
An initial benchmark can be built in 30 days, but a credible impact view usually needs more history. The first month should establish activation and return. The second should test workflow depth. By day 90, leaders can review early productivity, quality, and cost signals. Longer windows help account for release cycles and seasonal work.
Show AI ROI through a chain from usage to delivery change to financial value. Start with a baseline. Report verified hours saved, loaded labor cost, realization rate, tool cost, integration work, training, security, and administration. Compare similar teams when possible. Keep the confidence level visible so the business case does not overstate the evidence.
For a 500-plus engineering organization, choose a benchmark that joins AI use with delivery and quality data. Waydev is the usable starting point when you need that view at team and organization level.
Pick one value stream, establish several weeks of baseline data, and schedule the first 30-day review using a small scorecard. The benchmark that survives contact with a board meeting is the one built on data you already generate.
Waydev connects AI adoption with delivery performance, quality signals, and financial value across teams, services, and value streams. Start with one value stream and a real baseline.
Book a demoWaydev is an AI-native engineering intelligence platform measuring AI adoption, impact, and ROI across engineering organizations, trusted by Fortune 500 companies including American Express, Dropbox, Caterpillar, and PwC.
Ready to unlock your SDLC productivity?