Successful engineering leaders track, monitor, and plan projects, to ensure they respect their scopes, timelines, and budgets. To do so, tech leads or project managers require complete visibility over the team’s progress and performance and constant access to structured information that is clear and concise.
An excellent way to access data that can instantly assess the status of an engineering development project is using the RAG scale. The RAG definition in project management involves a convention of colors showcasing each deliverable’s status and raising a signal for the tasks that are not on track.
The Red, Amber, and Green (RAG status) helps engineering leadership rapidly identify their most stringent project priorities and report to stakeholders, offering them the comfort of knowing where significant project elements stand. This way, the chances for sudden risks and surprises are reduced, and trust is enhanced.
Engineering leaders need a laser-focused approach to pinpoint what needs attention, further investigations, and even corrective measures. By applying the RAG status approach, coupled with a data-driven analytics tool such as Waydev, you will be able to differentiate between elements going according to plan and those that experience bottlenecks and issues.
In this article, you will learn the meaning of RAG status, the definition of RAG status, how to get insights into your engineering projects from a RAG status report, and how to use this scale to ensure all your engineering tasks run smoothly.
In project management, the RAG status convention is used in status reports that tell project managers how well the projects are going or the project status. SO understanding the RAG definition is important.
Similarly, the RAG status report is precious in software development projects because it’s a conventional way of attracting tech leaders’ attention to critical elements that may create blockages in the development and delivery cycles. This color convention scheme gives you the RAG meaning, and it helps engineering managers monitor potential risks and address them in time to optimize resources and investments.
In engineering, the RAG meaning can be applied to everything, from the whole project to a certain workstream and specific issues or risks. When working on complex projects, engineering leaders break them down and apply the RAG color scheme to different pillars, such as schedule, scope, costs, and performance for the project team.
Many companies tailor the RAG status to their activities, objectives, and tolerance levels, deciding what goes as red, amber, or green.
Similar to the stop signal used for road traffic systems, in software project management, red suggests a strong need for attention and a high level of risk. A red alarm doesn’t necessarily mean that the project status report is stagnating or the team is not performing; instead, it suggests that the project may shift course if issues are not addressed.
It can propose that the project is in distress and requires some extra work and demands additional resources, that project risks are escalating, and are threatening the overall deliverables.
At this point, the specific element marked with red, according to the RAG definition, needs to be paused and carefully analyzed so tech leaders may deliberate on the next steps and alternative routes. Often, a red project requires a resuscitation strategy that involves reconsidering the talent resources, deadlines, and sometimes budgets.
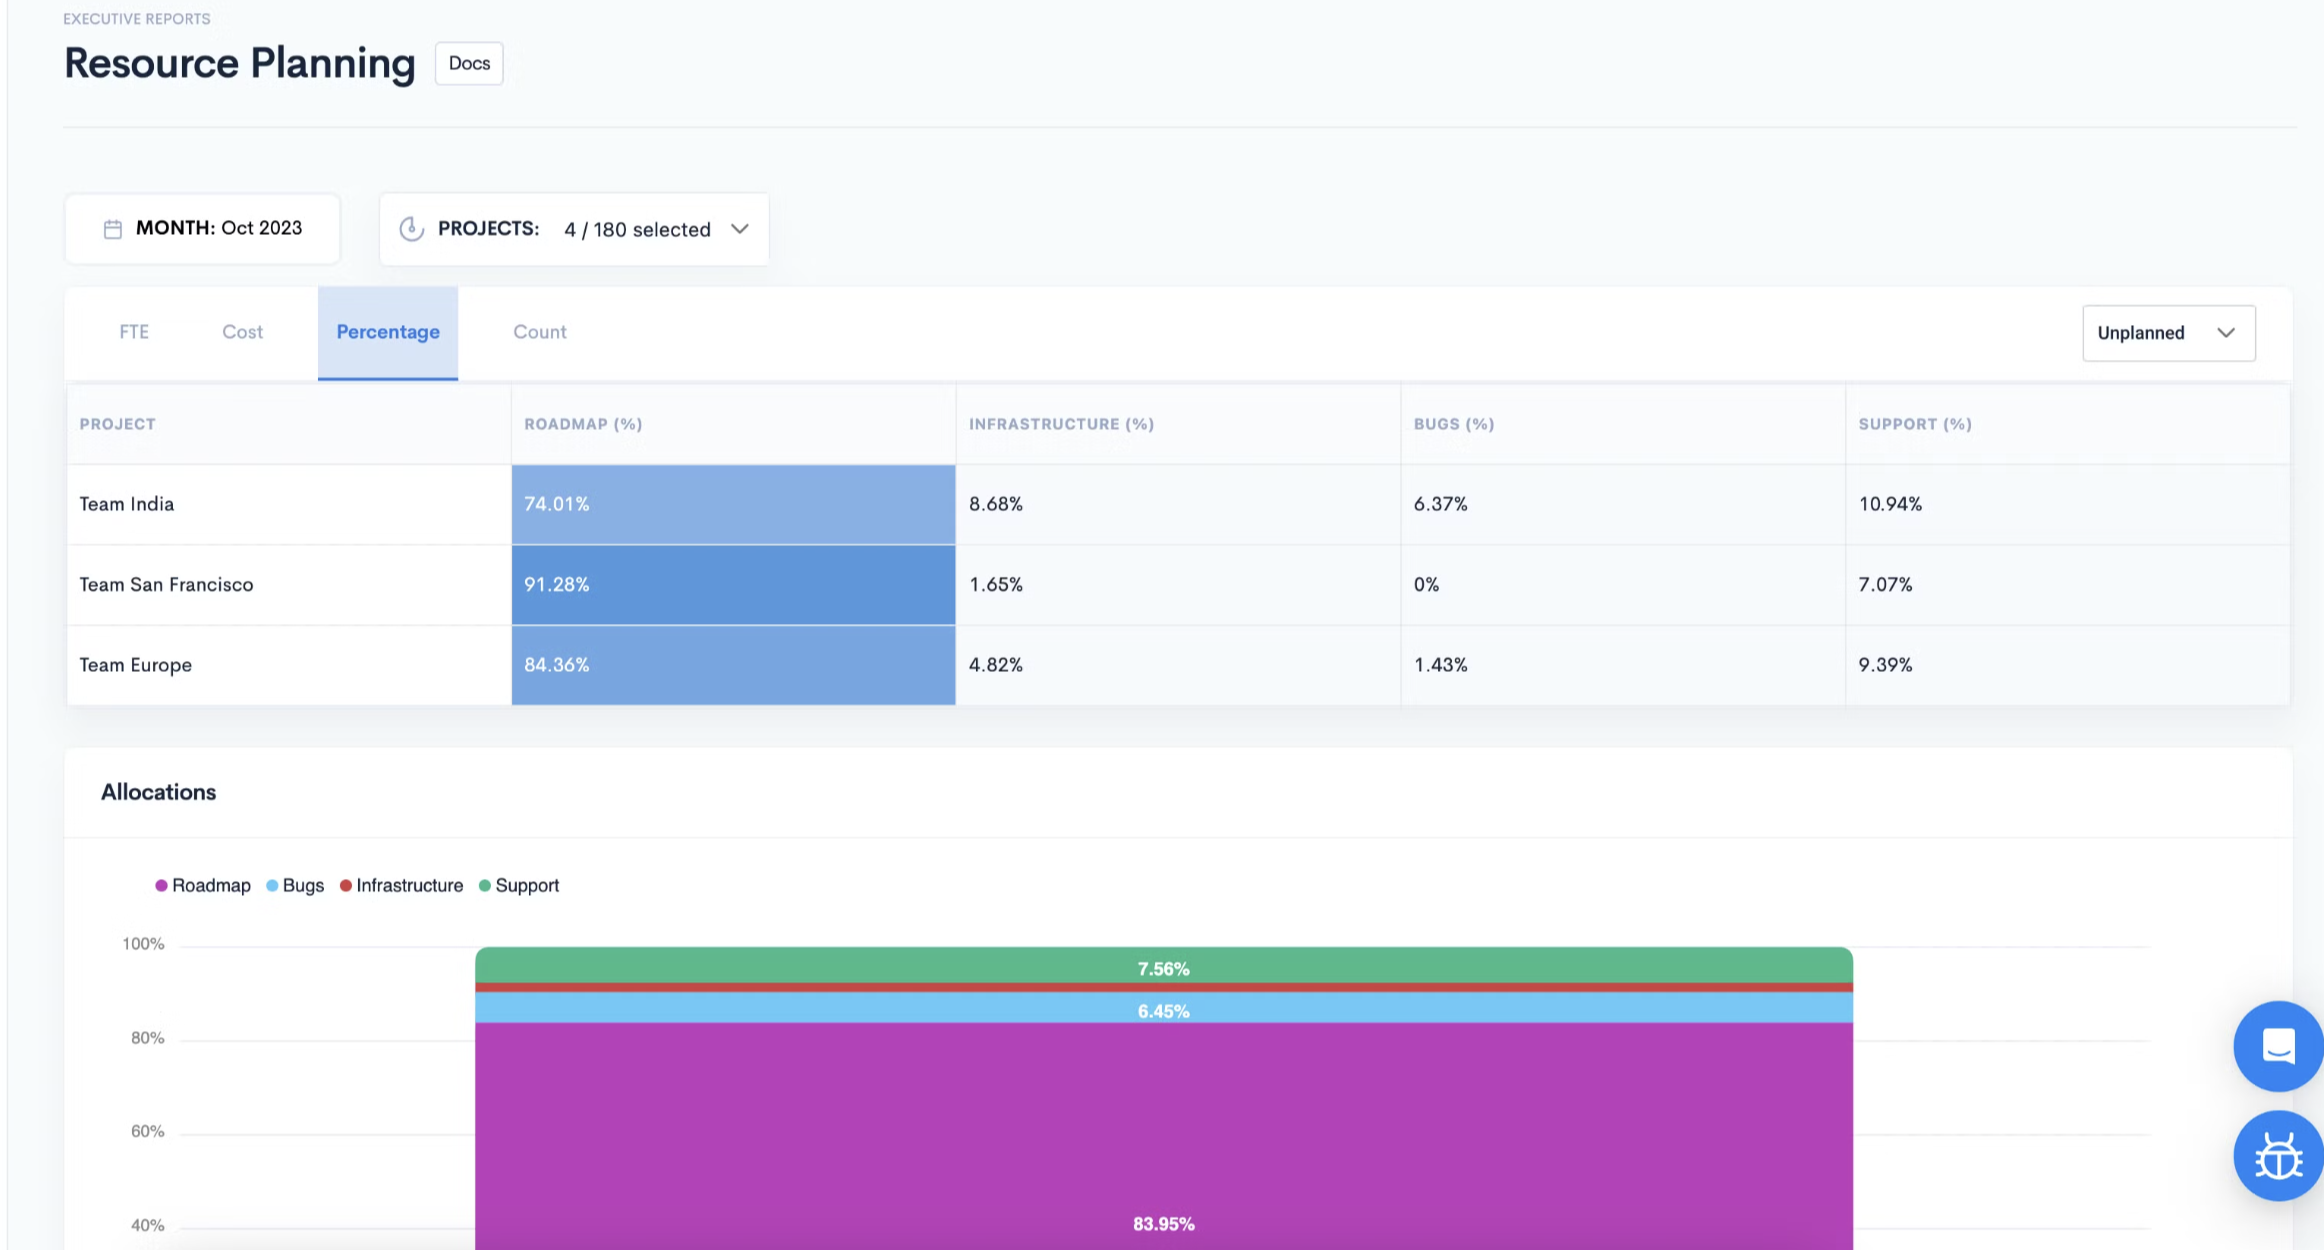
By ensuring that your team ships on schedule and within budget, your software engineering projects are less likely to reach this dreaded Red level on the RAG report. With Waydev’s Resource Planning and Project Costs reports, you will gain clear insight into the progress and costs of critical initiatives and deliverables.
From a RAG definition perspective, amber is less threatening to the overall delivery of the project. However, it suggests that the specific milestone is not advancing according to planned and in the agreed parameters.
While it will require less work and little disruption compared to red, amber elements should still be taken seriously and addressed in time.
Usually, some corrective actions are required to bring an Amber status project back on track. Since amber tasks and milestones have a medium degree of severity, they might only require a couple of meetings and some timeline and resource adjustments to be shifted to green.
Green is the color everyone wants to see when it comes to a project’s RAG scheme, including project stakeholders, because it means everything is going according to plan. The RAG color often suggests that a particular milestone or project element doesn’t require additional attention and that resources operate in the best parameters for the project’s health.
Project managers will tailor RAG categorization to their project’s specific requirements and needs, so that business and engineering objectives can be aligned. This means that the way each team interprets RAG reporting, and reacts to, the RAG status levels is different. To avoid confusion, it is crucial always to ensure that team members understand what falls into each color category. While Green is always a good sign, Amber and Red may be subject to debate, as they differ from one organization to the other.
A crucial pillar of each engineering project is the schedule, as the overall success and stakeholder satisfaction depend on tasks and milestones being completed on time.
In this case, the RAG status colors showcase the following:
When using a data-driven tool like Waydev, engineering leaders have visibility over the project’s timeline, enabling comparisons with industry or company benchmarks.
Our Cycle Time Breakdown feature allows tech leaders to see how fast team members release code, through the different stages of the development process, from coding to picking up, reviewing, and deploying.
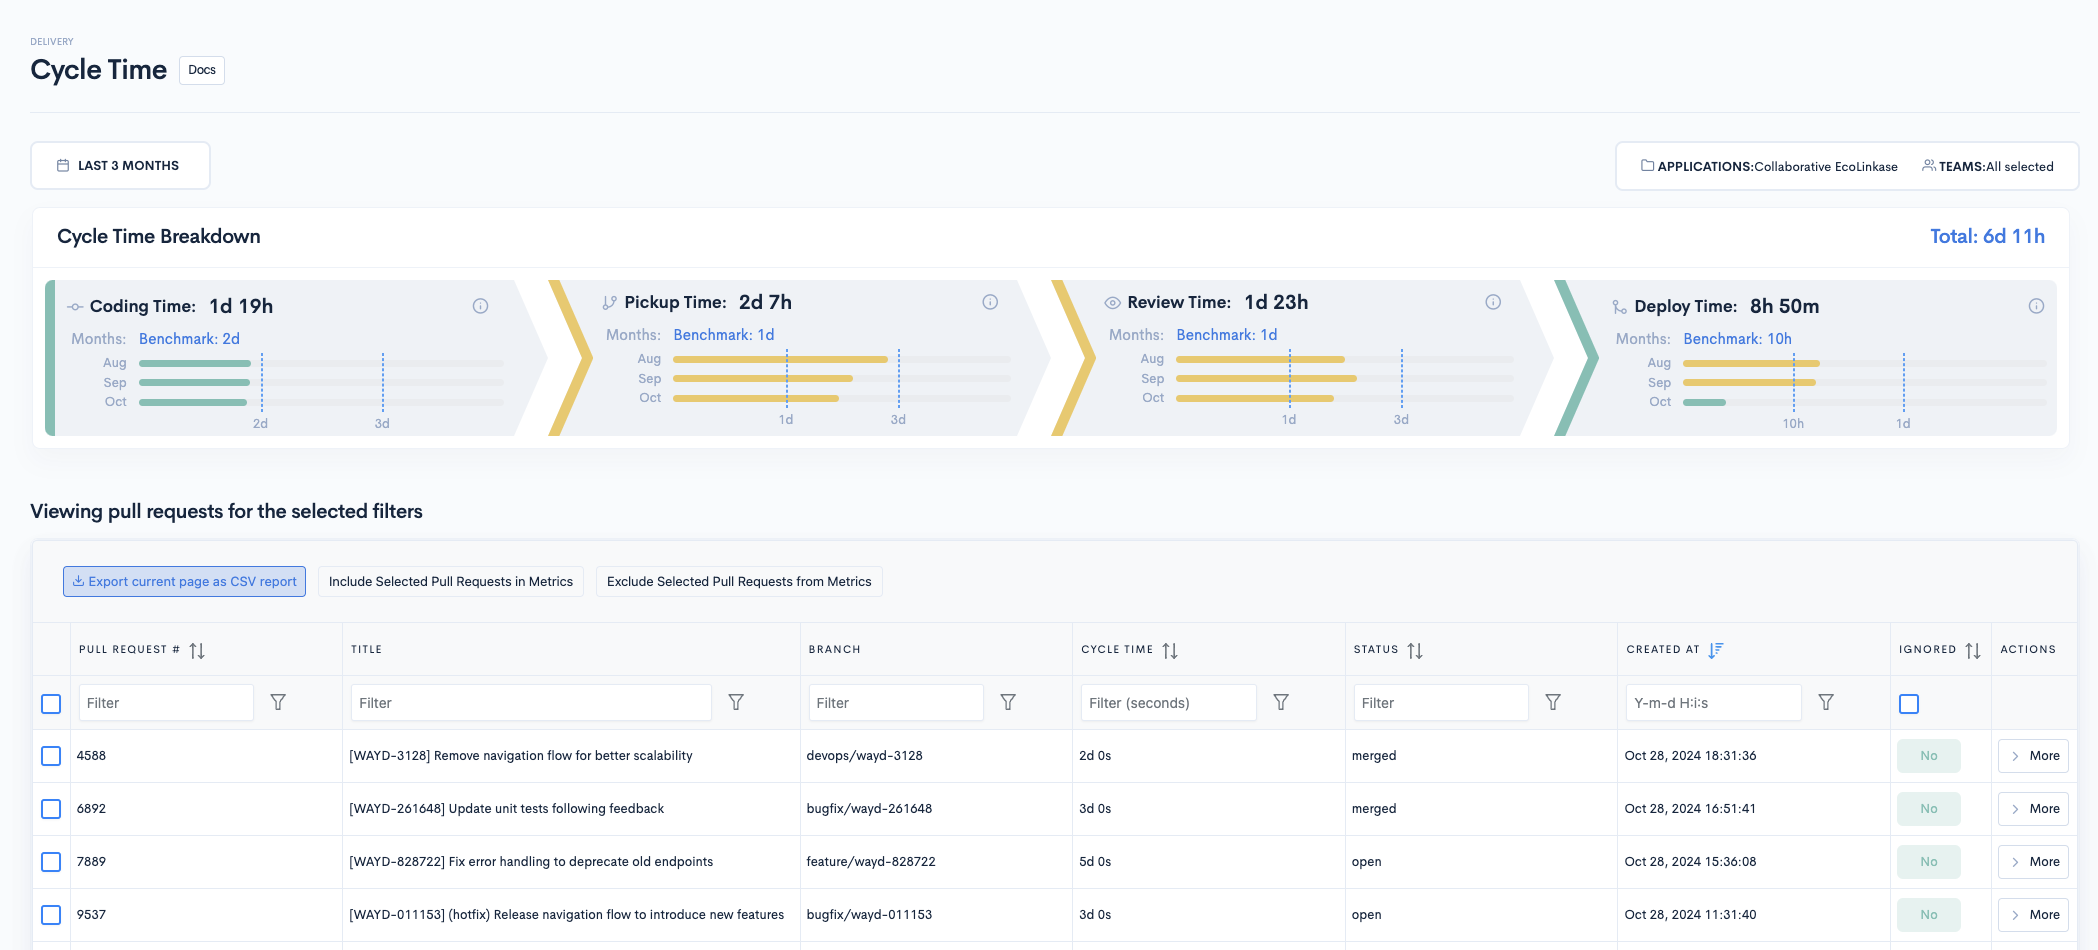
In the example above, red showcases that the time spent from the first commit to the pull request and time spent between a PR’s first review and the same pull request being merged are more significant than the tolerance ranges.
On the other hand, Green shows that pickup, the time spent between opening a PR and the first time an engineer reviews, is happening according to plan.
Amber shows that there are some delays in how fast code gets deployed. Still, these are all in the tolerance ranges and will not affect the project’s delivery date beyond the acceptable error margin.
As a tech leader, you know how important it is to stay true to the project’s scope and ensure that business needs are satisfied. Assessing this pillar from a RAG perspective helps engineering managers constantly check whether they comply with the stakeholders’ requests and the terms of the SLAs.
When it comes to scope, the RAG status indicators have the following significations:
When it comes to engineering projects, money is of the essence. Sometimes, this might be an even more sensitive pillar than time.
While a project may go extremely smooth in terms of timeline and scope, it might not respect the budget ranges, which generates issues and frictions between the team and stakeholders.
By mapping the costs on the RAG scale, you get the following indicators:
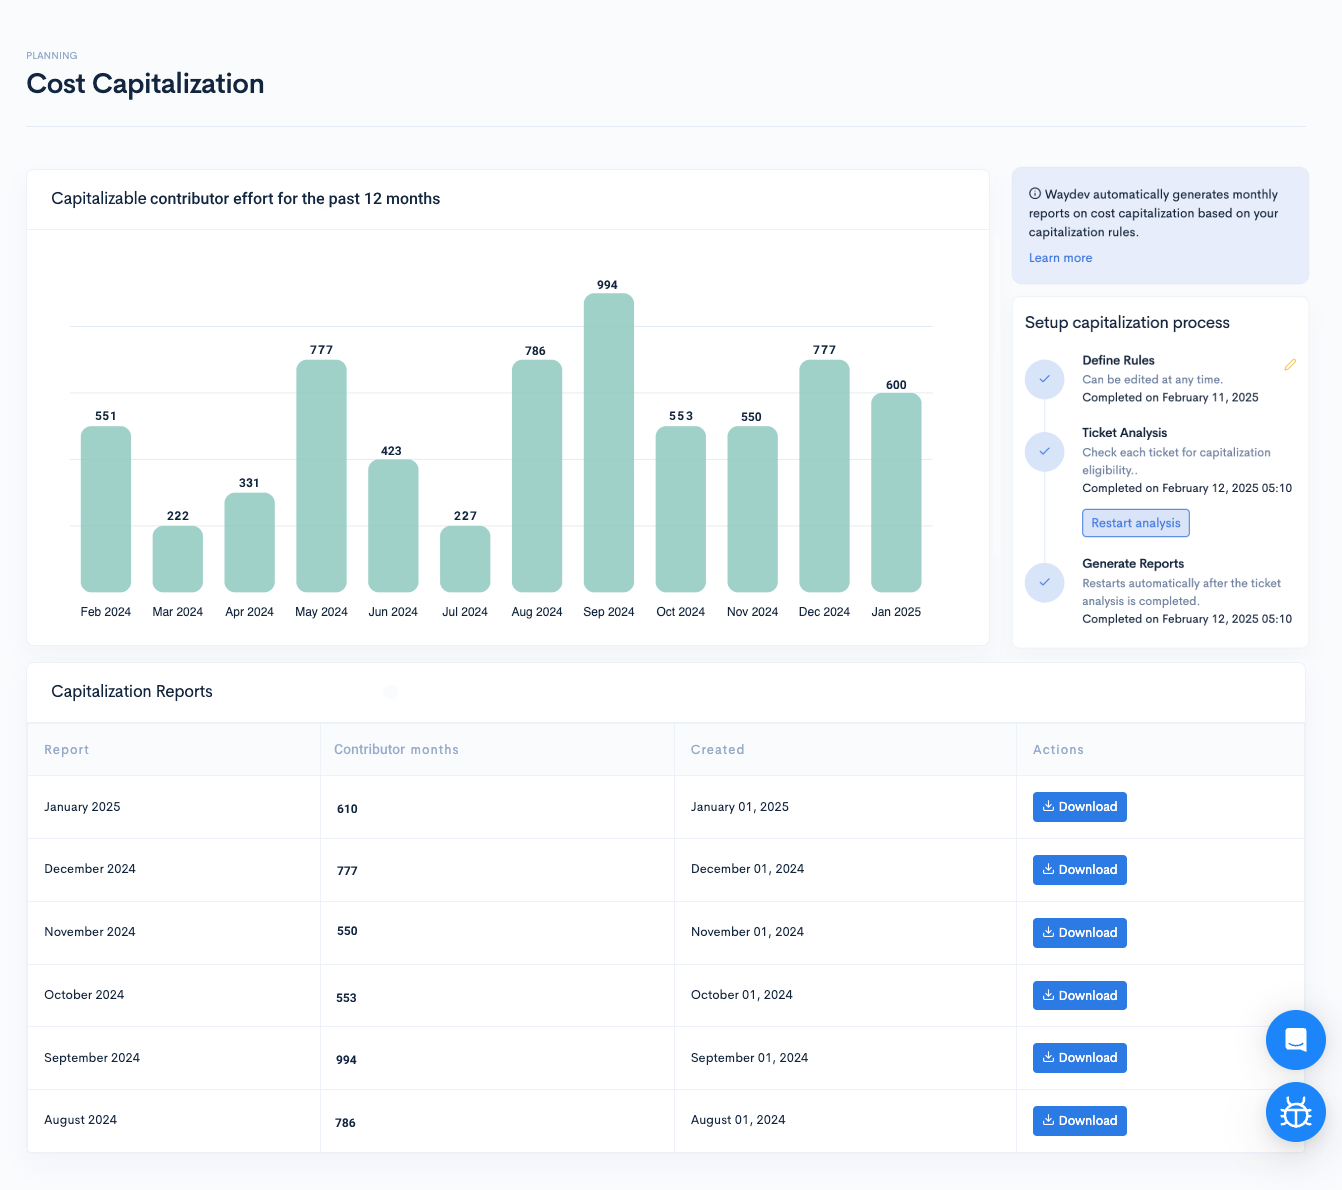
Waydev’s Project Costs report provides critical insight into the progress and costs of project initiatives, keeping you informed of the overall budget spent and comparing it with the parameters set upon starting. By having constant, immediate access to precise data about the project’s costs, successful engineering managers take decisions accordingly and react immediately to potential issues that could require more resources.
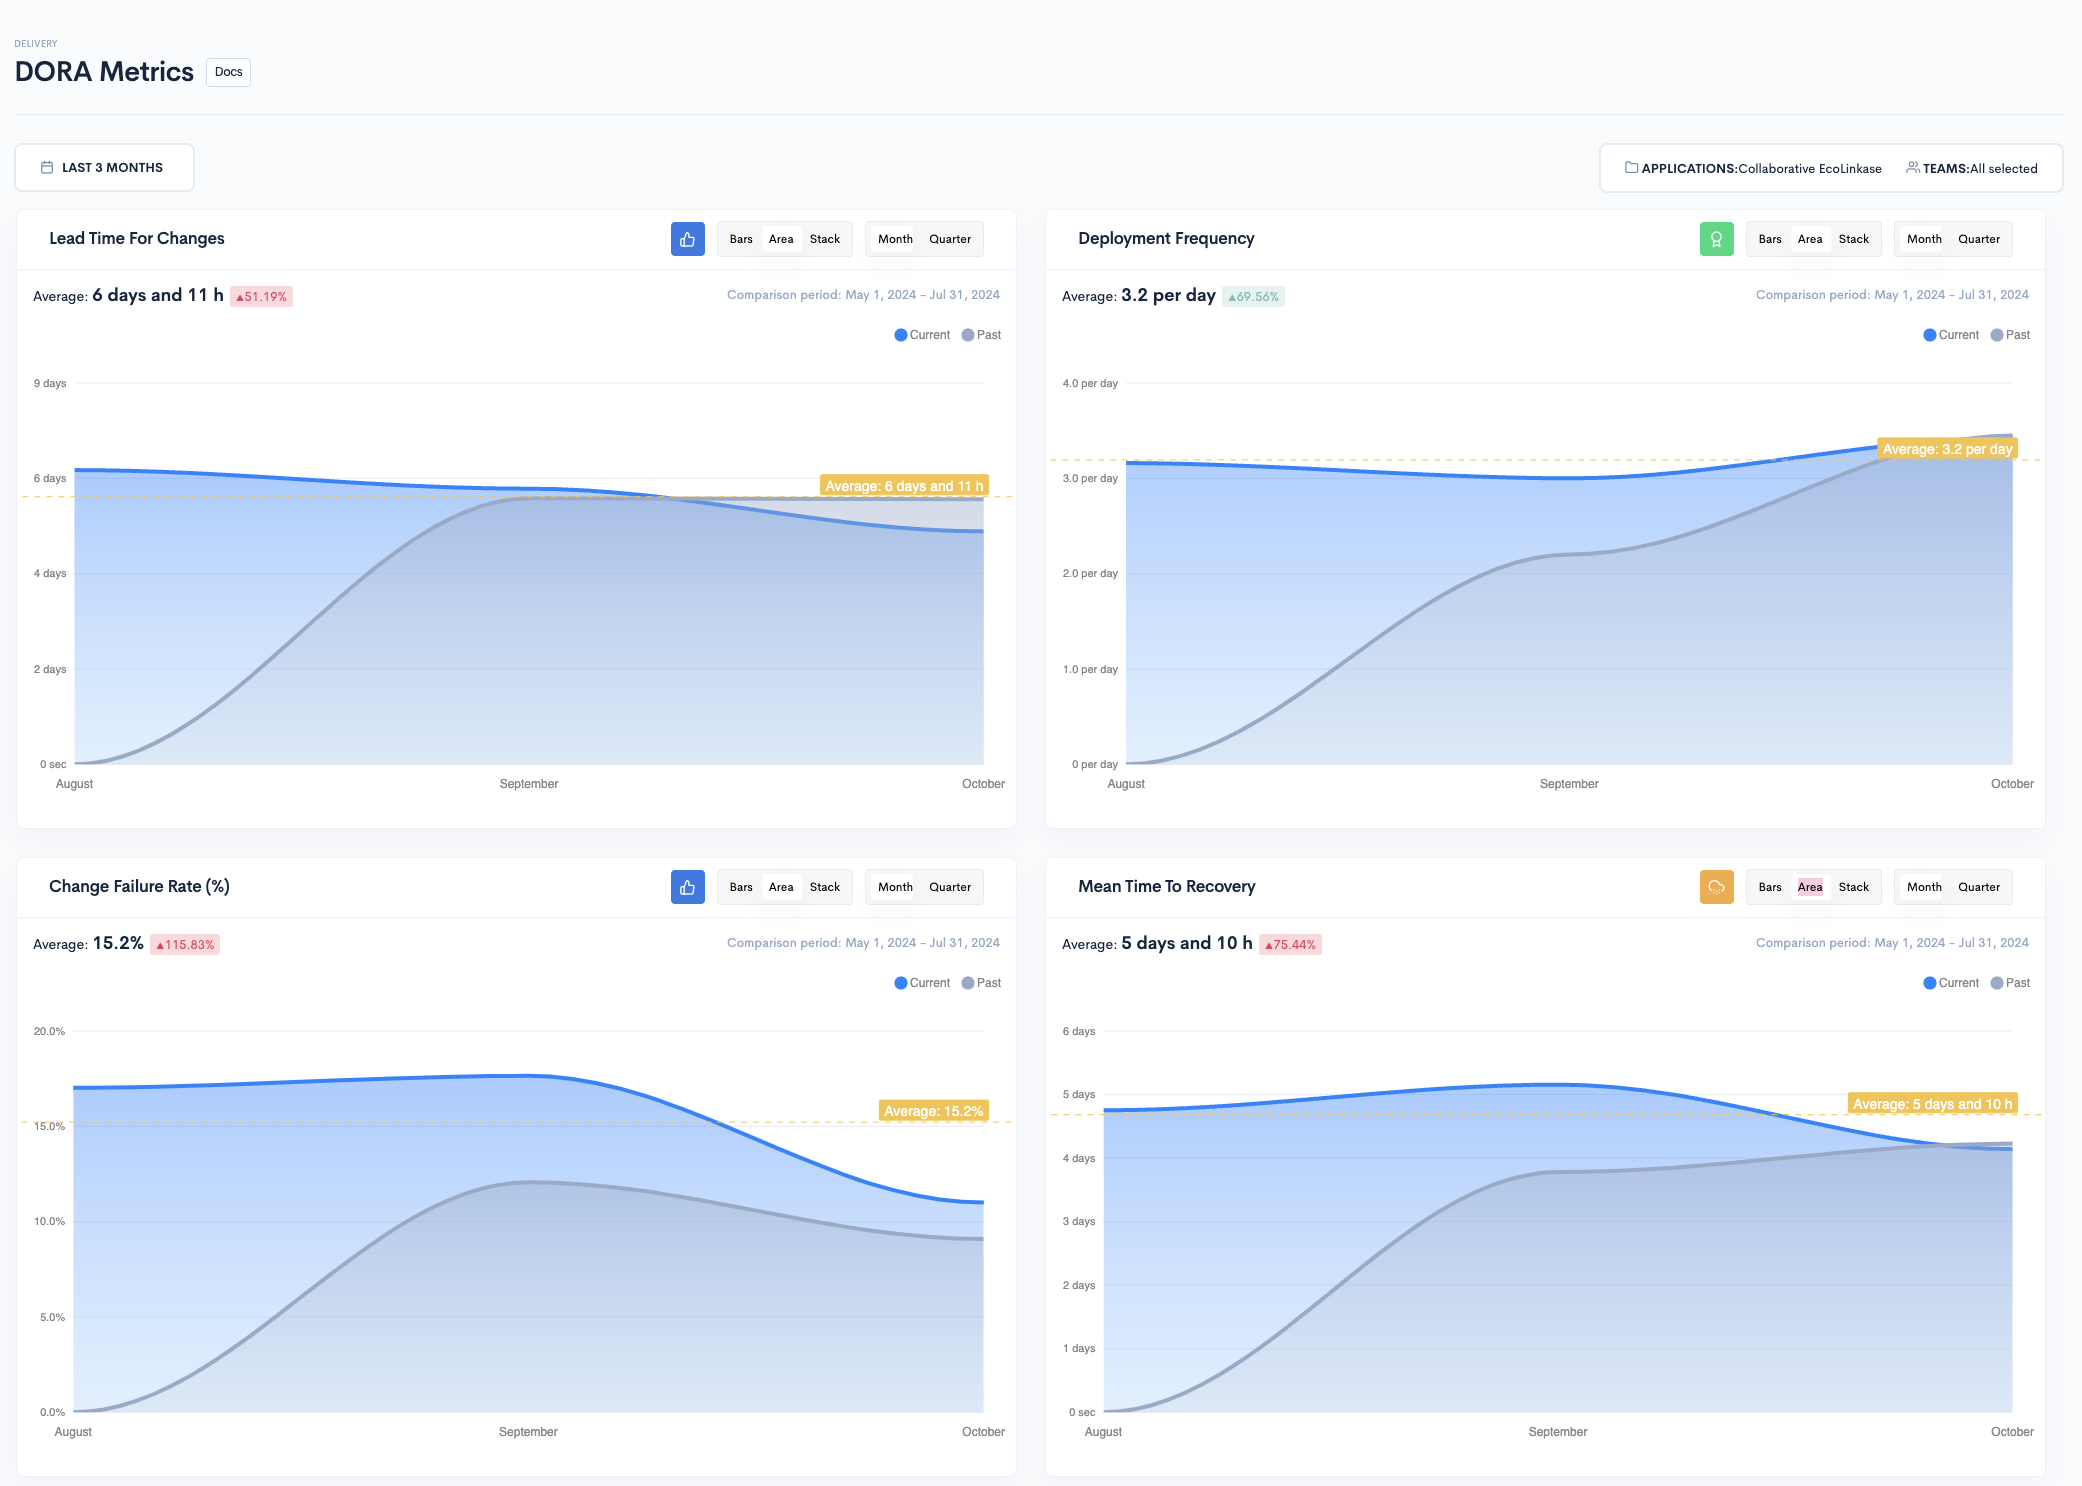
For engineering managers, project performance is of the essence. When measuring it against the RAG status, several guidelines need to be taken into account:
With Waydev’s DORA metrics dashboard report, you may analyze your team’s DevOPS performance and understand what is the velocity and the effectiveness of your team’s delivery process.
The RAG status enables engineering managers to translate critical metrics and project elements into easily digestible pieces of information that audiences may perceive according to a standard understanding system.
Knowing how to attribute a particular color and what is behind it, you may make rapid decisions regarding which tasks to investigate and which to stop, as well as take corrective and resuscitation measures when applicable.
Waydev is a software engineering leadership platform that leverages insights from your engineering tool stack without requiring manual input. Our solutions enable you to track your project status, budgets, and performance standards and identify what causes bottlenecks and errors.
Waydev incorporates the RAG status model, using the Red, Amber, Green convention to report on key engineering metrics, offering engineering leaders complete visibility on their projects.
Contact us, and we’ll show you more on how you can leverage Waydev’s reports to generate an efficient RAG strategy.

Ready to unlock your SDLC productivity?