Estimated reading time: 9 minutes
Value streams represent a project management style that prioritizes delivering value for customers and working in the most efficient way possible. Applying the value streams framework to software delivery integrates with Lean Thinking and DevOps principles. The main goal of organizing workpieces in multiple value streams that can easily coexist is to provide better and faster output that you can keep track of at any given time in answering customer demand.
To do so, you need specific metrics that can assess the status of your workflows and the efficiency and velocity of your engineering teams’ deliveries. Waydev is an engineering management analytics platform that can help you measure development value stream metrics in the quest for continuous improvement of your development process. With its intuitive interface, real-time reporting, and customizable dashboards, Waydev makes it easy for business leaders to track the right metrics for process improvement. It integrates with leading tools like GitHub, GitLab, and Jira, making it a complete solution for measuring and improving your development value streams.
In this article, we will define the main value stream metrics and show you how using them can improve your capabilities of answering customer demands and scaling your business.
Value streams represent a development framework derived from Lean thinking, a customer-centric approach to the delivery process. This means answering customer demands quickly and with as little waste as possible. Implementing value stream management entails that business leaders recognize the value of integrating value stream mapping with the right metrics for continuous improvement of the delivery process.
When adopting this business model, tech leaders need to follow a few crucial steps:
Successful value stream management means a better understanding that VS is not rigid but rather a dynamic framework that needs continuous improvement. Waydev provides multiple dashboards with automatically fed data, giving you an overview of the workflow progress. This model provides value stream insights into planning the necessary steps for successful software product release.
The goal of measuring VS is to identify bottlenecks, optimize workflows, and increase the speed and efficiency of software delivery. By tracking these metrics over time, DevOps teams can achieve process improvement and make data-driven decisions that impact the entire organization.
You can track the value distribution through the entire process of answering customer demands by using specific metrics. These flow items can measure the efficiency and velocity of your value streams and the workflow distribution through the DVS. Business leaders can use some of these metrics to see the output quality at each step in the value stream (deployment frequency or throughput) or as a specific and quantifiable measure of business (defect density).
By using these flow items, you can document each step of the process and find ways to improve workflow where this need arises.
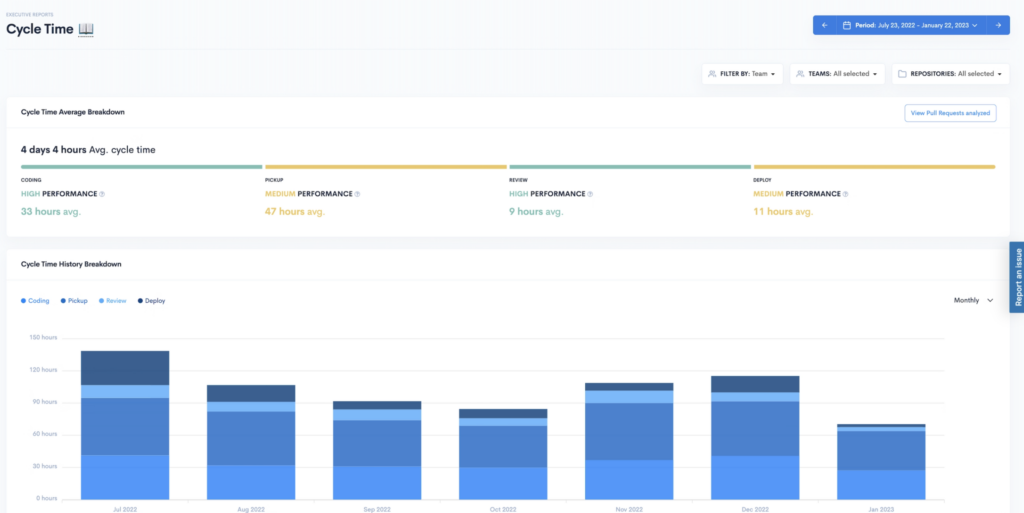
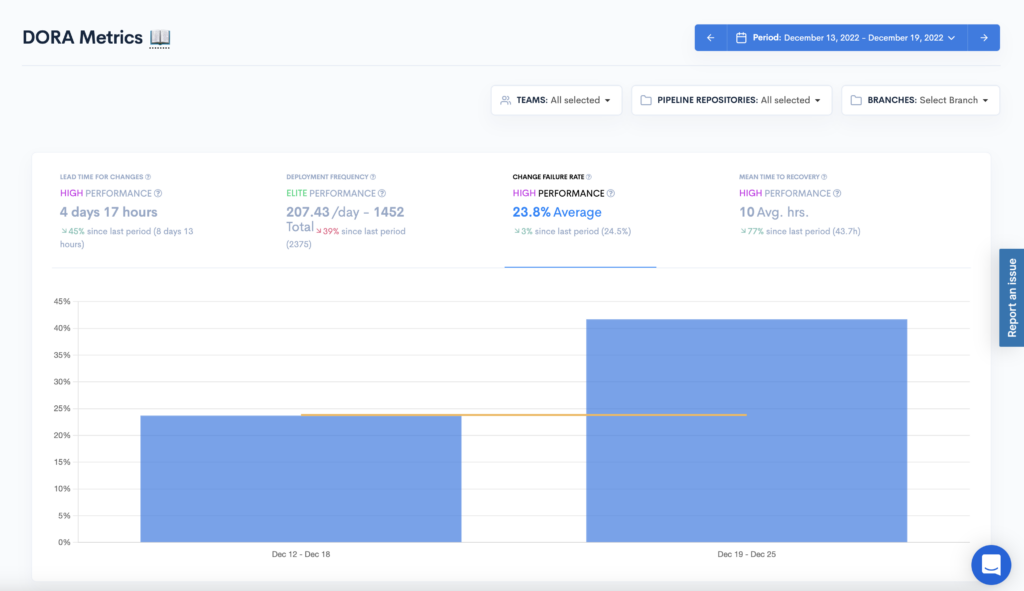
Lead Time is a fundamental value stream metric as it measures the velocity of your entire deployment process. Lead Time tells how long it takes for the engineering team to take a request from submission to delivery, going through stages such as planning, coding, and testing all the way up to the release of the new feature. A lower Lead Time is a good indicator that your teams are effective and can deliver results in a fast-paced environment.
Cycle Time is a subsidiary of the previously mentioned Lead Time, but it doesn’t include the beginning stages of the value stream, such as planning. This metric helps you see the amount of time needed from the first commit to releasing, indicating agile teams’ efficiency. Identifying bottlenecks in the flow and what could be causing delays in the value stream is also useful.
😍 You May Also Like: Lead Time vs. Cycle Time in software development – Waydev🔥
Deployment Frequency tells you how often engineering teams release quality code into production within the value stream. High-level teams will release value to customers multiple times a day while lower-performing ones only once per month or less. You can also increase Deployment Frequency by implementing CI/CD pipelines and keeping value streams flowing.
Throughput measures the total number of items completed within a value stream over a certain period of time. This metric speaks about how effectively your teams deliver finished products to customers. It measures the output that engineering teams can deliver, and it’s an important overview of teams’ performance.
Work in Progress Limits refers to the fact that teams and organizations set in order to limit the number of workpieces that are open in a certain time interval. By using this concept derived from Lean thinking, you can focus on a certain amount of work at a time, avoiding exceeding the teams’ capacity and energy to deliver quality and speedy code. This can improve the flow of work in value streams and help you see the bigger picture of the entire process.
Defect Density is a value stream mapping metric that tells you how many defects or failures there are in a given amount of work. This number is generally calculated per module or, more often, per thousand lines of code (KLOC). The number speaks to your team’s efficiency, and it can increase proportionally with the amount of work or when you deal with lower-skilled DevOps teams.
Flow efficiency is essential in identifying waste and the common sources of roadblocks. This flow item tells a story about the proportion of wait times to active times and how this affects your mapping exercise. This flow metric helps you measure the non-value-adding activities that inhibit the workflow and raise production costs.
VSM metrics give you a measurement of how VS mapping is going and where there are issues.
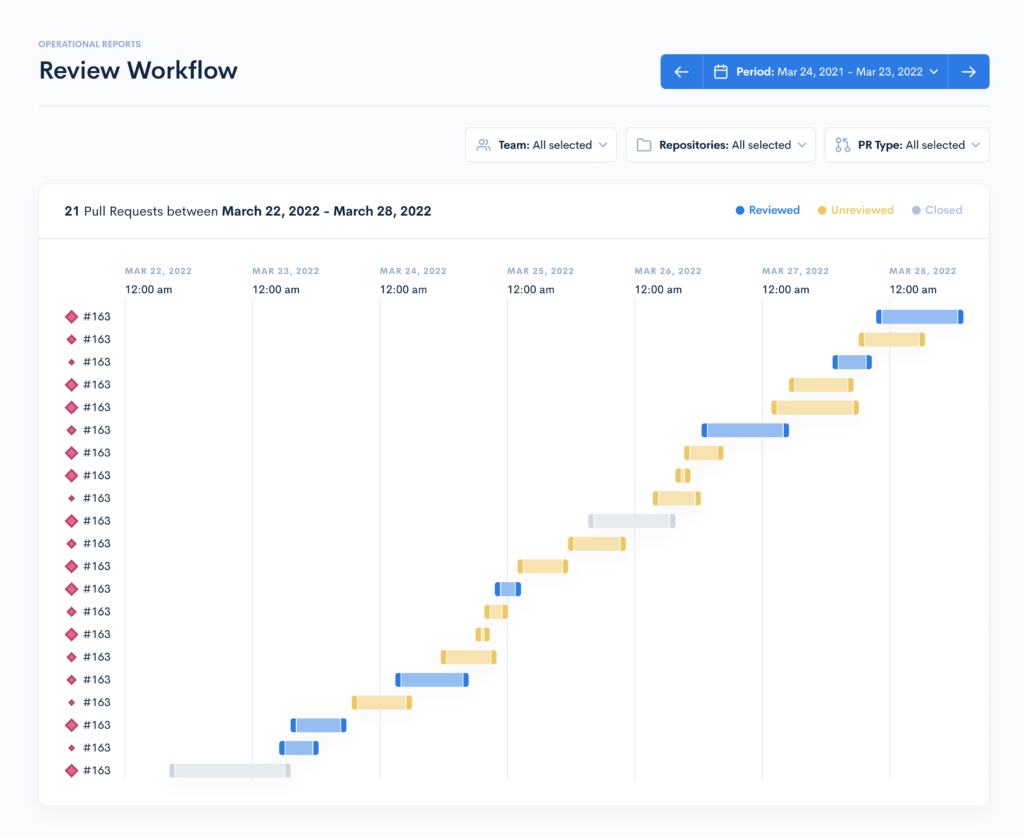
Code review time shows you how much time is spent on code reviews. This can detect issues and sources for delays in the workflow and ensure the quality of code. Ideally, the time spent on code reviews should range between 60 to 90 minutes.
Waydev can help you identify possible sources of delaying your deployment process, such as the code review feedback time. This data could help you make the PR workflow smoother and improve your overall VS.
Waydev can provide data to understand how long it takes to go from code review feedback to code commit. If this stage is very slow, it could affect your delivery process and impact how well your VS is put in motion.
Waydev’s specific metrics can show bottlenecks in your development process that are slowing down your code commit to building time. It provides detailed insights into your team’s coding activities, including commit frequency, code churn, and code review feedback. You can use this information to identify areas of improvement and optimize your delivery process to reduce build time.
At the same time, you can achieve process improvement by reducing your build times. Waydev can show you the size and complexity of your codebase and pinpoint problem areas or slow-running tests. You can focus on improving these flow metrics and overall workflows by identifying these issues.
Identify the factors slowing down your build time to deploy time using the Waydev platform. It provides insights into your team’s deployment activities, including deployment frequency, deployment success rate, and deployment time. Use this information to optimize your deployment process and reduce how much effort and time it takes to release code into production.
Waydev can help you track the impact of your code changes on customer feedback. It provides value stream insights into how often your code changes result in customer-facing features and how quickly customers adopt them. Use this data to prioritize your development efforts and ensure you deliver value to your customers fast.
Applying development value stream metrics to your workflows brings many benefits regarding delivering quality code faster and turning it into value for customers as soon as possible. Effective value stream management can help executives streamline the continuous delivery of new features, reduce lead time cycle time, and optimize overall flow efficiency.
In conclusion, measuring the VS metrics is crucial to the delivery process improvement in answering your customer’s demands, and it provides key insights into the effectiveness of the development process. By using the right tools, such as Waydev, and making the necessary adjustments, organizations can optimize their development value stream, deliver better products, and improve overall customer satisfaction.
Contact us to learn how to optimize your value stream framework and scale your business.
Ready to unlock your SDLC productivity?