AI Cost · Engineering Intelligence · Analysis
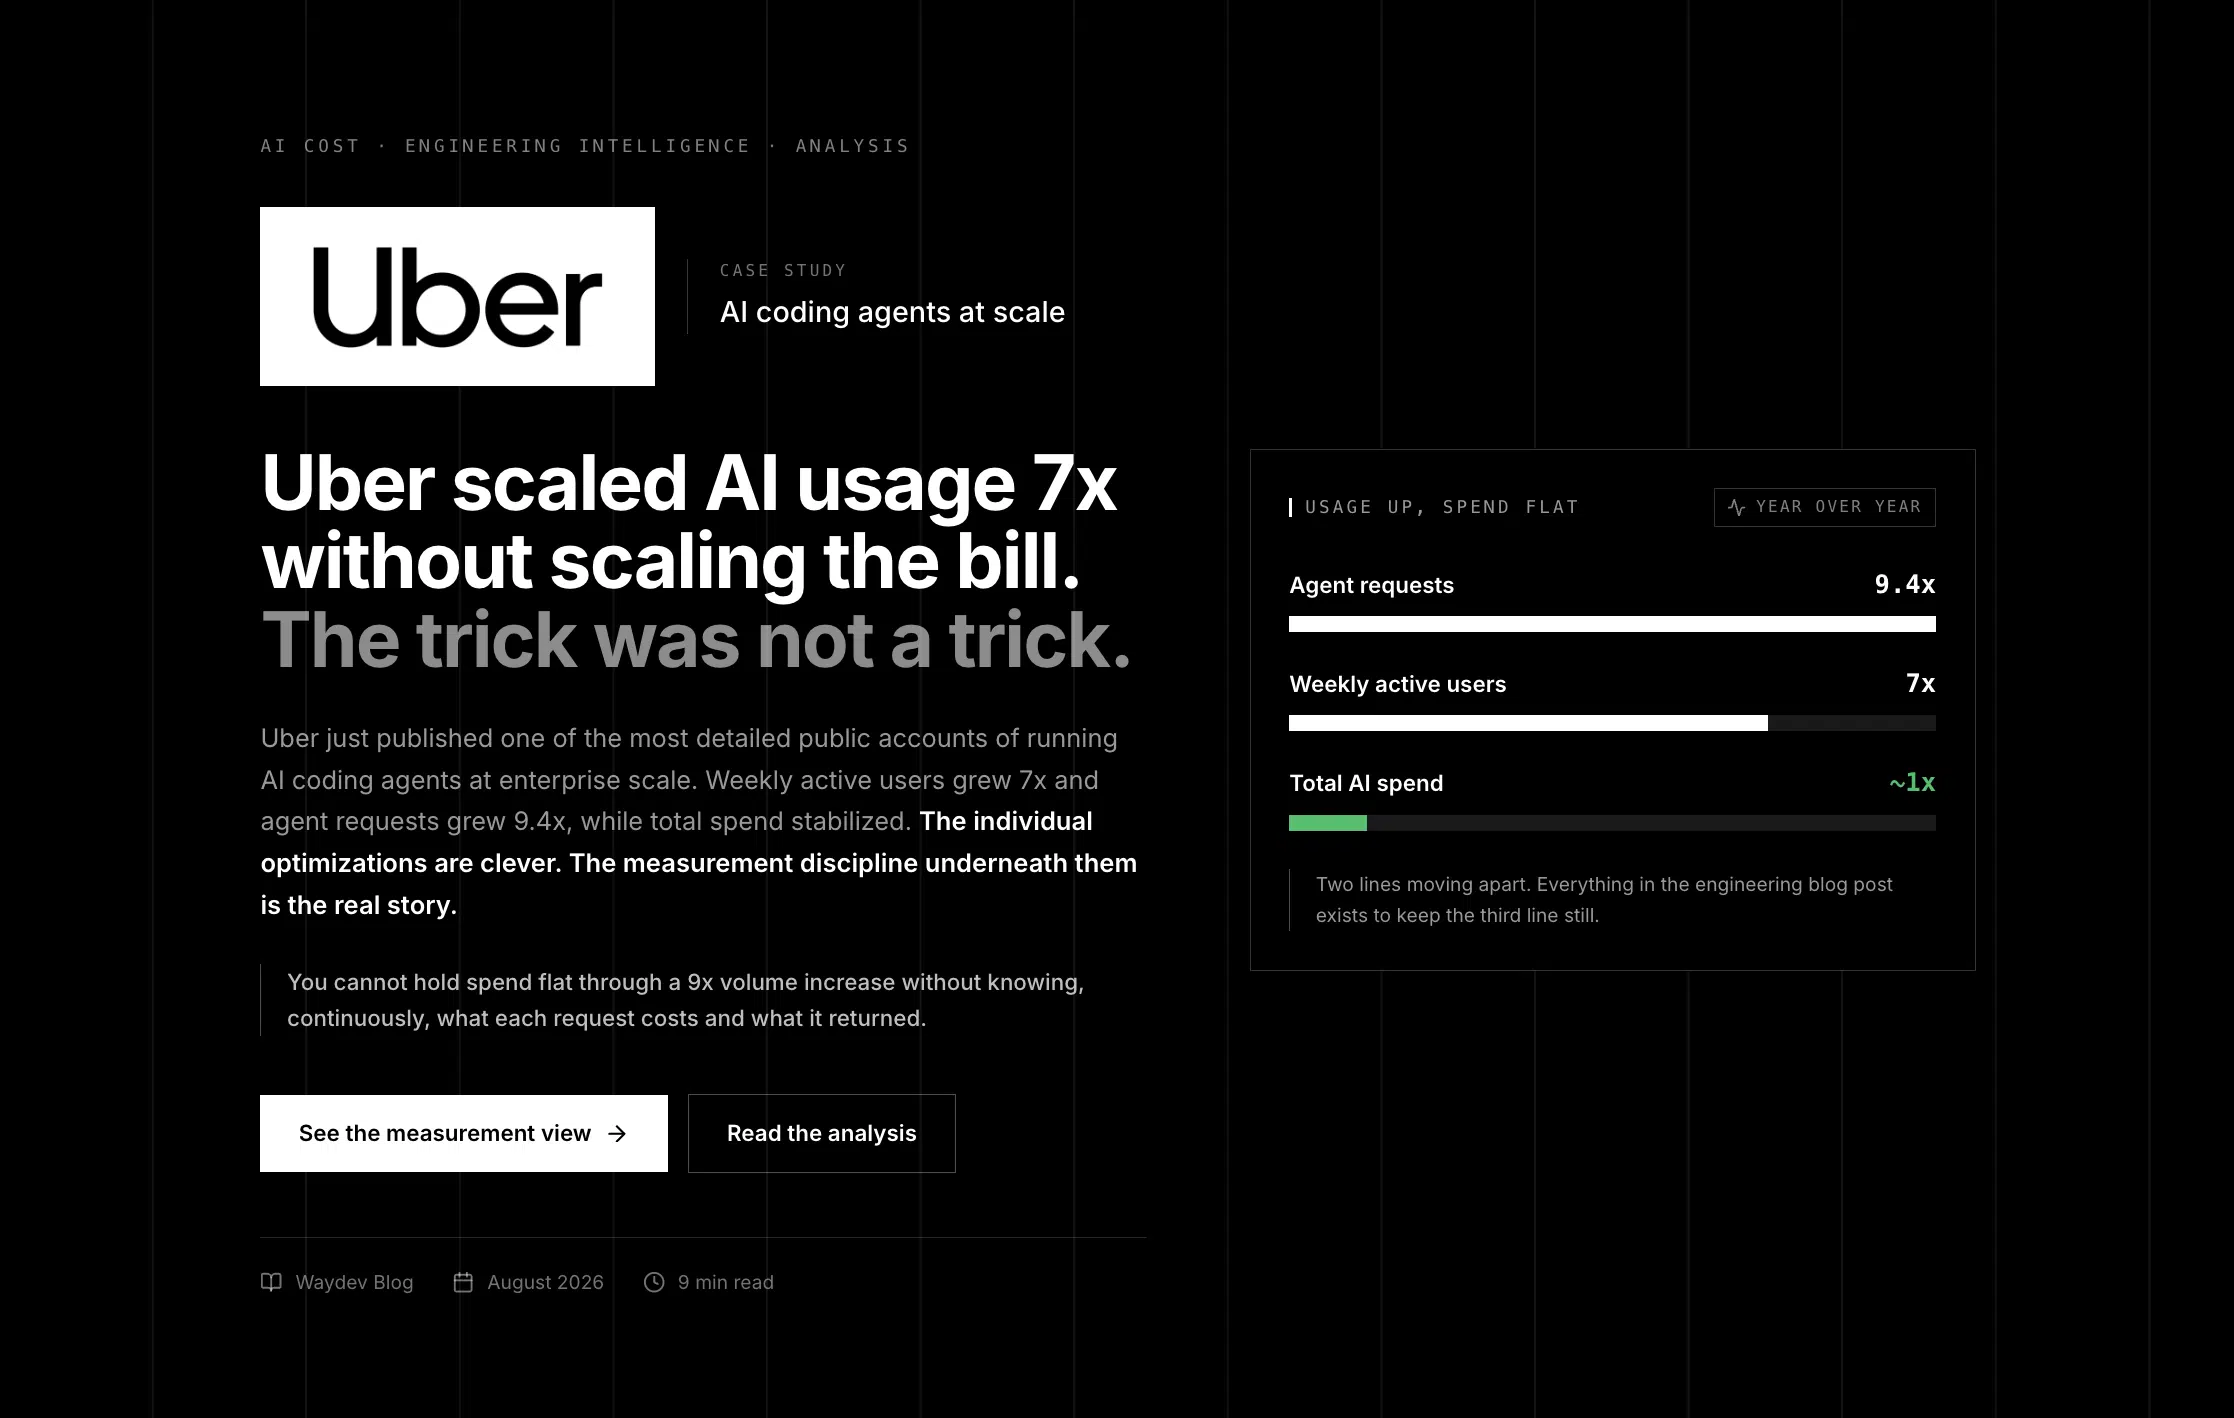
Uber just published one of the most detailed public accounts of running AI coding agents at enterprise scale. Weekly active users grew 7x and agent requests grew 9.4x, while total spend stabilized. The individual optimizations are clever. The measurement discipline underneath them is the real story.
More than 70 percent of pull requests at Uber are now attributed to local or cloud agents. Engineers there have built over 3,600 agent skills, executing more than 30,000 skill runs per day. At that volume, an unmanaged AI bill would grow as fast as usage does. Uber’s did not, and in a deep dive published this week, the team explained exactly why.
The short version: Uber stopped treating AI spend as a procurement line item and started treating it as an engineering problem. They decomposed total cost into six measurable terms, instrumented every one of them, and assigned optimization work to each. From February to July, with the model held constant to isolate their own gains, cost per 1,000 model requests fell almost 34 percent from its peak and cost per session fell 52 percent from its June peak.
This article breaks down what Uber built, which levers moved the numbers, and what engineering leaders who do not have Uber’s platform team can realistically take from it.
What this covers
The foundation of Uber’s approach is a single decomposition. Total AI spend, for any agentic session in any layer of their stack, breaks into six terms multiplied together. Once spend is written this way, every term becomes something a team can measure on its own and shrink on its own.
People and managed agents doing work on the platform.
grow thisHow often each user reaches for an agent.
grow thisBack-and-forth exchanges needed to finish a task.
shrink thisModel calls the agent makes on its own behalf: searching, retrying, polling.
shrink thisThe payload each call carries: context, history, tool schemas, results.
shrink thisSet by the vendor. You control it by routing each workload to the right model.
route thisThe insight embedded in this structure is that the three middle terms represent work the agent does on its own behalf, on top of what the engineer actually asked for. An agent that searches the wrong places, re-sends bloated context on every turn, or polls a database five times per query is burning tokens that produce no value. Uber’s post calls this out directly: most of their optimization effort targets exactly that waste.
Uber did not lower the bill by rationing usage. It grew usage aggressively and attacked the zero-value tokens in between.
Illustrative sketch of the trend Uber reported. Usage across all agentic offerings grew 7x in weekly active users and 9.4x in weekly agent requests, while total spend stabilized from April onward.
Key takeawayWriting spend as an equation converts a scary aggregate number into six ordinary engineering metrics. Nothing gets optimized until it gets decomposed.
None of the equation matters without instrumentation. Uber tracks a full stack of metrics weekly and monthly, organized in five layers, each answering a question the layer above it cannot. This is the part of the post most companies will skip past, and it is the part they should study hardest.
Total attributed cost, distinct users, and per-tool spend share.
answers: where is the money going, and which tool moved?Cost per user, per 1,000 requests, per session, tokens per request, cache hit rate.
answers: is the tool getting cheaper, or is usage just shifting?Cost, request share, and per-token economics for every model in the fleet.
answers: which model releases actually changed the bill?Every cost change split sequentially into adoption, engagement, input workload, and output workload.
answers: why did the number move, with no unexplained residual?Cost per merged PR, per review, per triaged alert, paired with quality signals like revert rate and F1.
answers: is each agent getting cheaper per unit of value delivered?Two details in this stack deserve special attention. First, the driver decomposition: when Uber’s bill moves, they can state exactly how much of the change came from more users, more engagement per user, heavier inputs, or heavier outputs, with nothing left over. That is the difference between explaining a cost spike in a leadership meeting and shrugging at one.
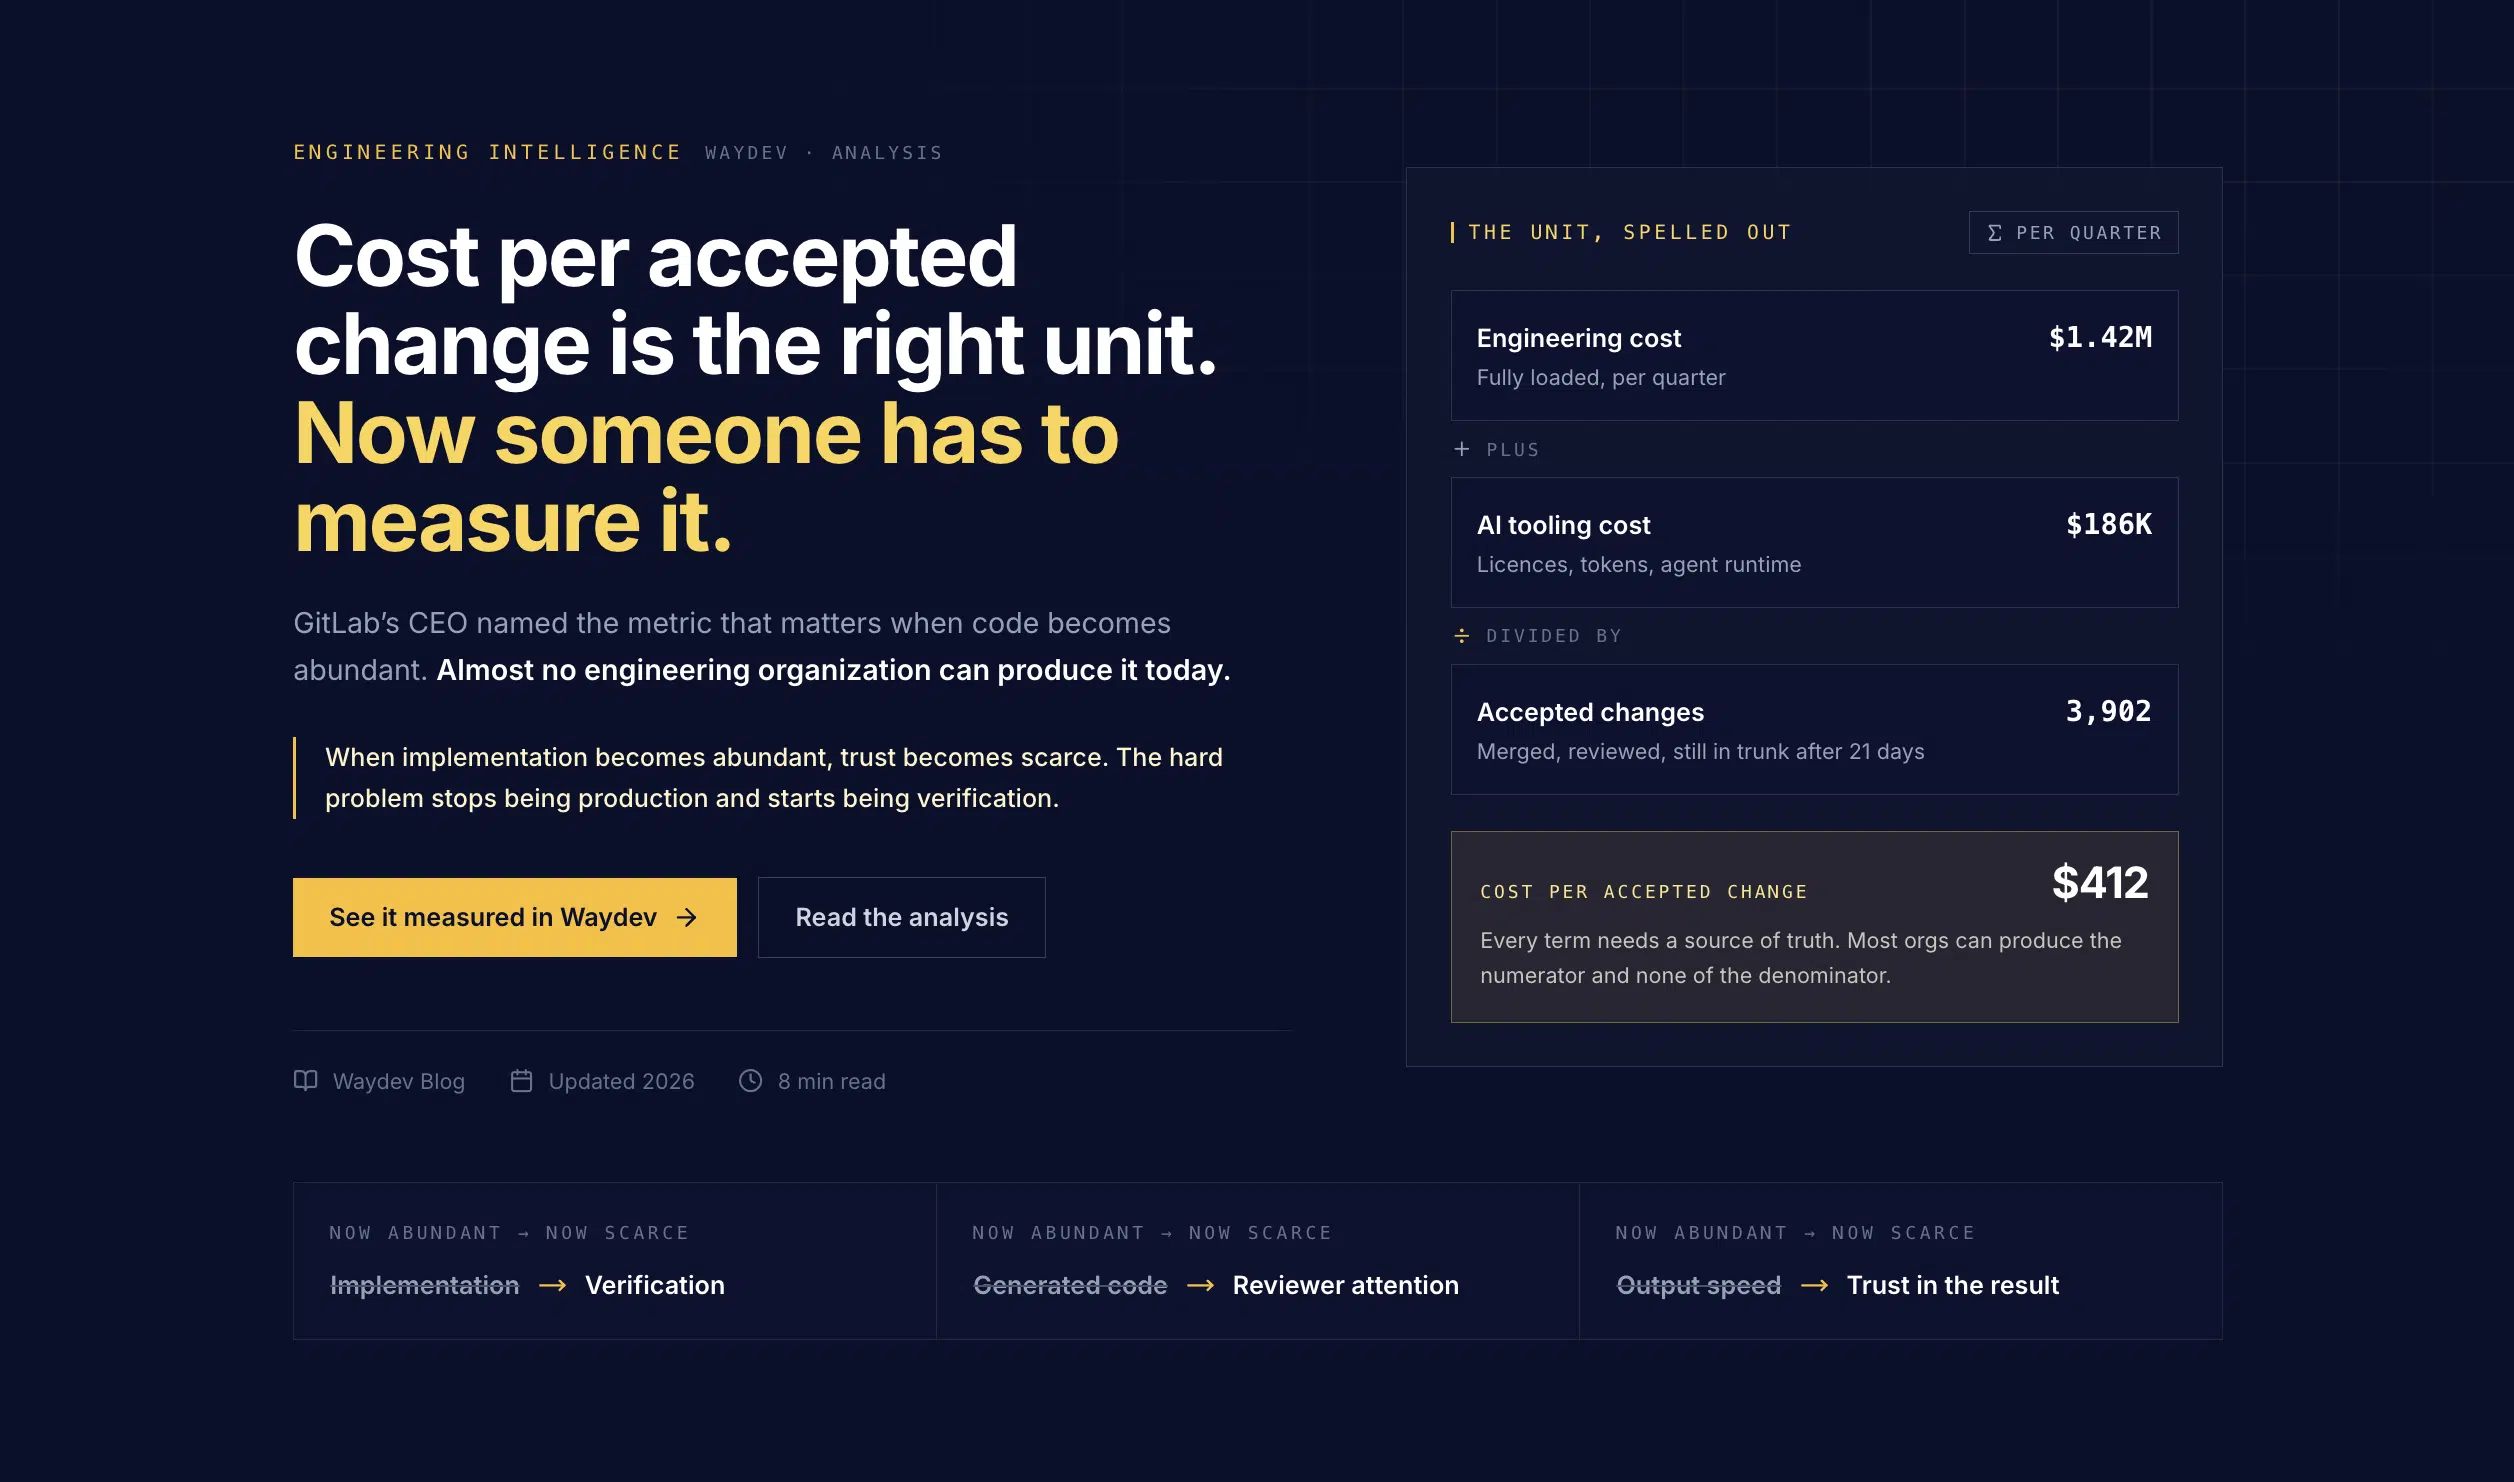
Second, outcome-denominated cost. Uber does not judge its code review agent by tokens consumed. It judges it by cost per review, alongside precision, recall, and F1 against real bugs. A cheaper agent that misses defects is not cheaper. Quality is held in the same frame as spend, which is what keeps cost optimization from quietly degrading the product.
Uber built this measurement stack internally, with a dedicated platform team. Waydev exists so the other 99 percent of engineering organizations do not have to. It connects AI adoption signals to delivery data, quality outcomes, and cost, giving leaders the same layered view: who is using AI, what it changed, and what each unit of value costs.
With the equation and the instrumentation in place, Uber worked term by term. These are the levers that moved the numbers, mapped to the part of the equation each one attacks.
Benchmark-driven model selection. Every managed agent gets a benchmark built from its real work. Uber’s code review agent was benchmarked on actual pull requests with known bugs, scored on precision, recall, F1, cost per review, and latency. Models are then chosen from the Pareto frontier of quality against cost, and re-chosen as the frontier shifts every few weeks. Subagents, which handle well-defined tasks, default to a cheaper model while the primary model handles decomposition and evaluation.
Aggressive defaults. Context compaction triggers at 400K tokens even on models with 1M windows, and reasoning effort defaults to medium. Both were measured decisions, not guesses: the compaction threshold balances model performance against repeated input token costs, and medium reasoning cuts the most expensive token category for a large class of tasks.
Prompt caching matched to human behavior. Engineers leave sessions idle for more than five minutes, which was silently invalidating the prompt cache and forcing full-price context rebuilds. Uber moved interactive sessions to a one-hour cache window and kept subagents on five minutes, since their tasks are short-lived. Cache economics were modeled turn by turn before the switch.
Getting tool schemas out of the context. Standard MCP setups preloaded 50K to 70K tokens of tool schema into every session, re-sent on every turn. Uber replaced this with CLI-resolved tool calls and on-demand tool search across its gateway of more than 1,000 MCP servers, dropping that overhead to near zero.
Code-mode batching. Chatty tool protocols that needed a model turn per action now run as scripts, with intermediate polling kept out of the model’s context. Even trivial SQL queries used 50 percent fewer tokens, and bulk workflows saved more than 90 percent. Uber shipped over 25 pre-built code-mode skills so the cheap path is the default path.
Grounding agents in a context graph. An ungrounded agent fails slowly, not cheaply. Uber built an AI context graph with 24 million nodes across services, teams, incidents, PRs, and datasets. In one head-to-head, the grounded agent answered a data question correctly in 38 seconds. The ungrounded one spent over 20 minutes, spawned two subagents, hit three errors, and got the answer wrong.
Visibility instead of caps. A live cost counter sits in every engineer’s status line. Slack nudges fire at 50, 80, and 100 percent of expected spend. A session analysis dashboard flags 16 distinct waste patterns, from suboptimal model routing to expired caches, each paired with its financial impact and a fix. Engineers self-correct because they can finally see the meter.
Pro tipNotice the order of operations. Uber measured first, then optimized. Every lever above was justified by instrumentation, and validated by it afterward. Teams that copy the tactics without the measurement will not know which ones worked.
It is tempting to read this post as a list of tactics to copy. Some transfer directly: longer cache windows for interactive sessions, cheaper default models for subagents, and keeping tool schemas out of the context are worth evaluating in almost any setup. But the tactics are downstream of something more fundamental, and that is the part worth importing.
Uber’s own conclusion says it plainly: rising AI coding costs are a tractable engineering challenge. Not a procurement negotiation, not a usage policy, not a reason to slow adoption. The company scaled usage 7x while cutting unit costs across every metric, and it did so by eliminating zero-value token consumption rather than downgrading tooling or rationing access.
For engineering leaders outside a company of Uber’s size, the transferable discipline looks like this:
There is also a strategic signal in the post worth registering. Uber describes its core shift as moving from interactive developer workflows to fleets of managed agents, each with its own benchmark, its own Pareto-efficient model, and its own outcome metrics. When one of the world’s largest engineering organizations says that optimizing a fleet of specialized agents beats optimizing thousands of individual terminal sessions, the rest of the industry should assume that is where the puck is going. The measurement problem gets harder in that world, not easier: more agents, more models, more surfaces, and a board that still asks one question, which is what all of this bought.
Waydev gives engineering organizations the measurement layer Uber built by hand: AI adoption tracked beside delivery performance, quality signals, and cost, with AI Checkpoints across the software delivery life cycle and ROI reporting leadership can take to the CFO and board. You bring the AI investment. Waydev shows you what it changed.
Uber decomposes total AI spend into six multiplied terms: users, sessions per user, turns per session, requests per turn, tokens per request, and price per token. The first two represent adoption, which Uber wants to grow. The middle three represent agent overhead, which is where most optimization effort goes. The last is managed by routing each workload to the most cost-efficient capable model.
With the model held constant to isolate its own optimization gains, Uber reported that cost per 1,000 model requests fell almost 34 percent from its peak and cost per session fell 52 percent from its June peak, between February and July 2026. Over the same period, weekly active users grew 7x and weekly agent requests grew 9.4x while total spend stabilized.
Outcome-denominated cost expresses AI spend per unit of value delivered instead of per token: cost per merged pull request, cost per code review, cost per triaged alert. Paired with quality signals such as revert rate or defect detection, it answers whether an agent is getting cheaper per unit of value, which is the question executives and boards actually care about.
Start with a baseline before rollout, then track adoption, delivery, quality, and cost together. Hold conditions constant where possible so model upgrades do not masquerade as your gains. Denominate cost in outcomes, pair every efficiency claim with a quality check, and report at the team or organization level. An engineering intelligence platform like Waydev automates this measurement across the organization.
Yes, the discipline transfers even where the internal tooling does not. Any team can decompose its AI spend, set cheaper defaults for routine work, review cache and context settings, and track cost per outcome. What most teams cannot do is build Uber’s measurement stack in-house, which is why purpose-built platforms for AI adoption, impact, and ROI measurement exist.
Uber spent months of platform engineering to see what its AI investment was doing. Waydev connects AI adoption, delivery performance, quality, and cost across your engineering organization out of the box.
Book a demoSource: Running a Software Factory Efficiently at Uber Scale, Uber Engineering, August 2026. All Uber figures cited above are from that post. Waydev is an AI-native engineering intelligence platform measuring AI adoption, impact, and ROI, trusted by Fortune 500 companies including American Express, Dropbox, Caterpillar, and PwC.
Ready to unlock your SDLC productivity?