Waydev ResearchMeasurement specificationNo results published yet
Research question
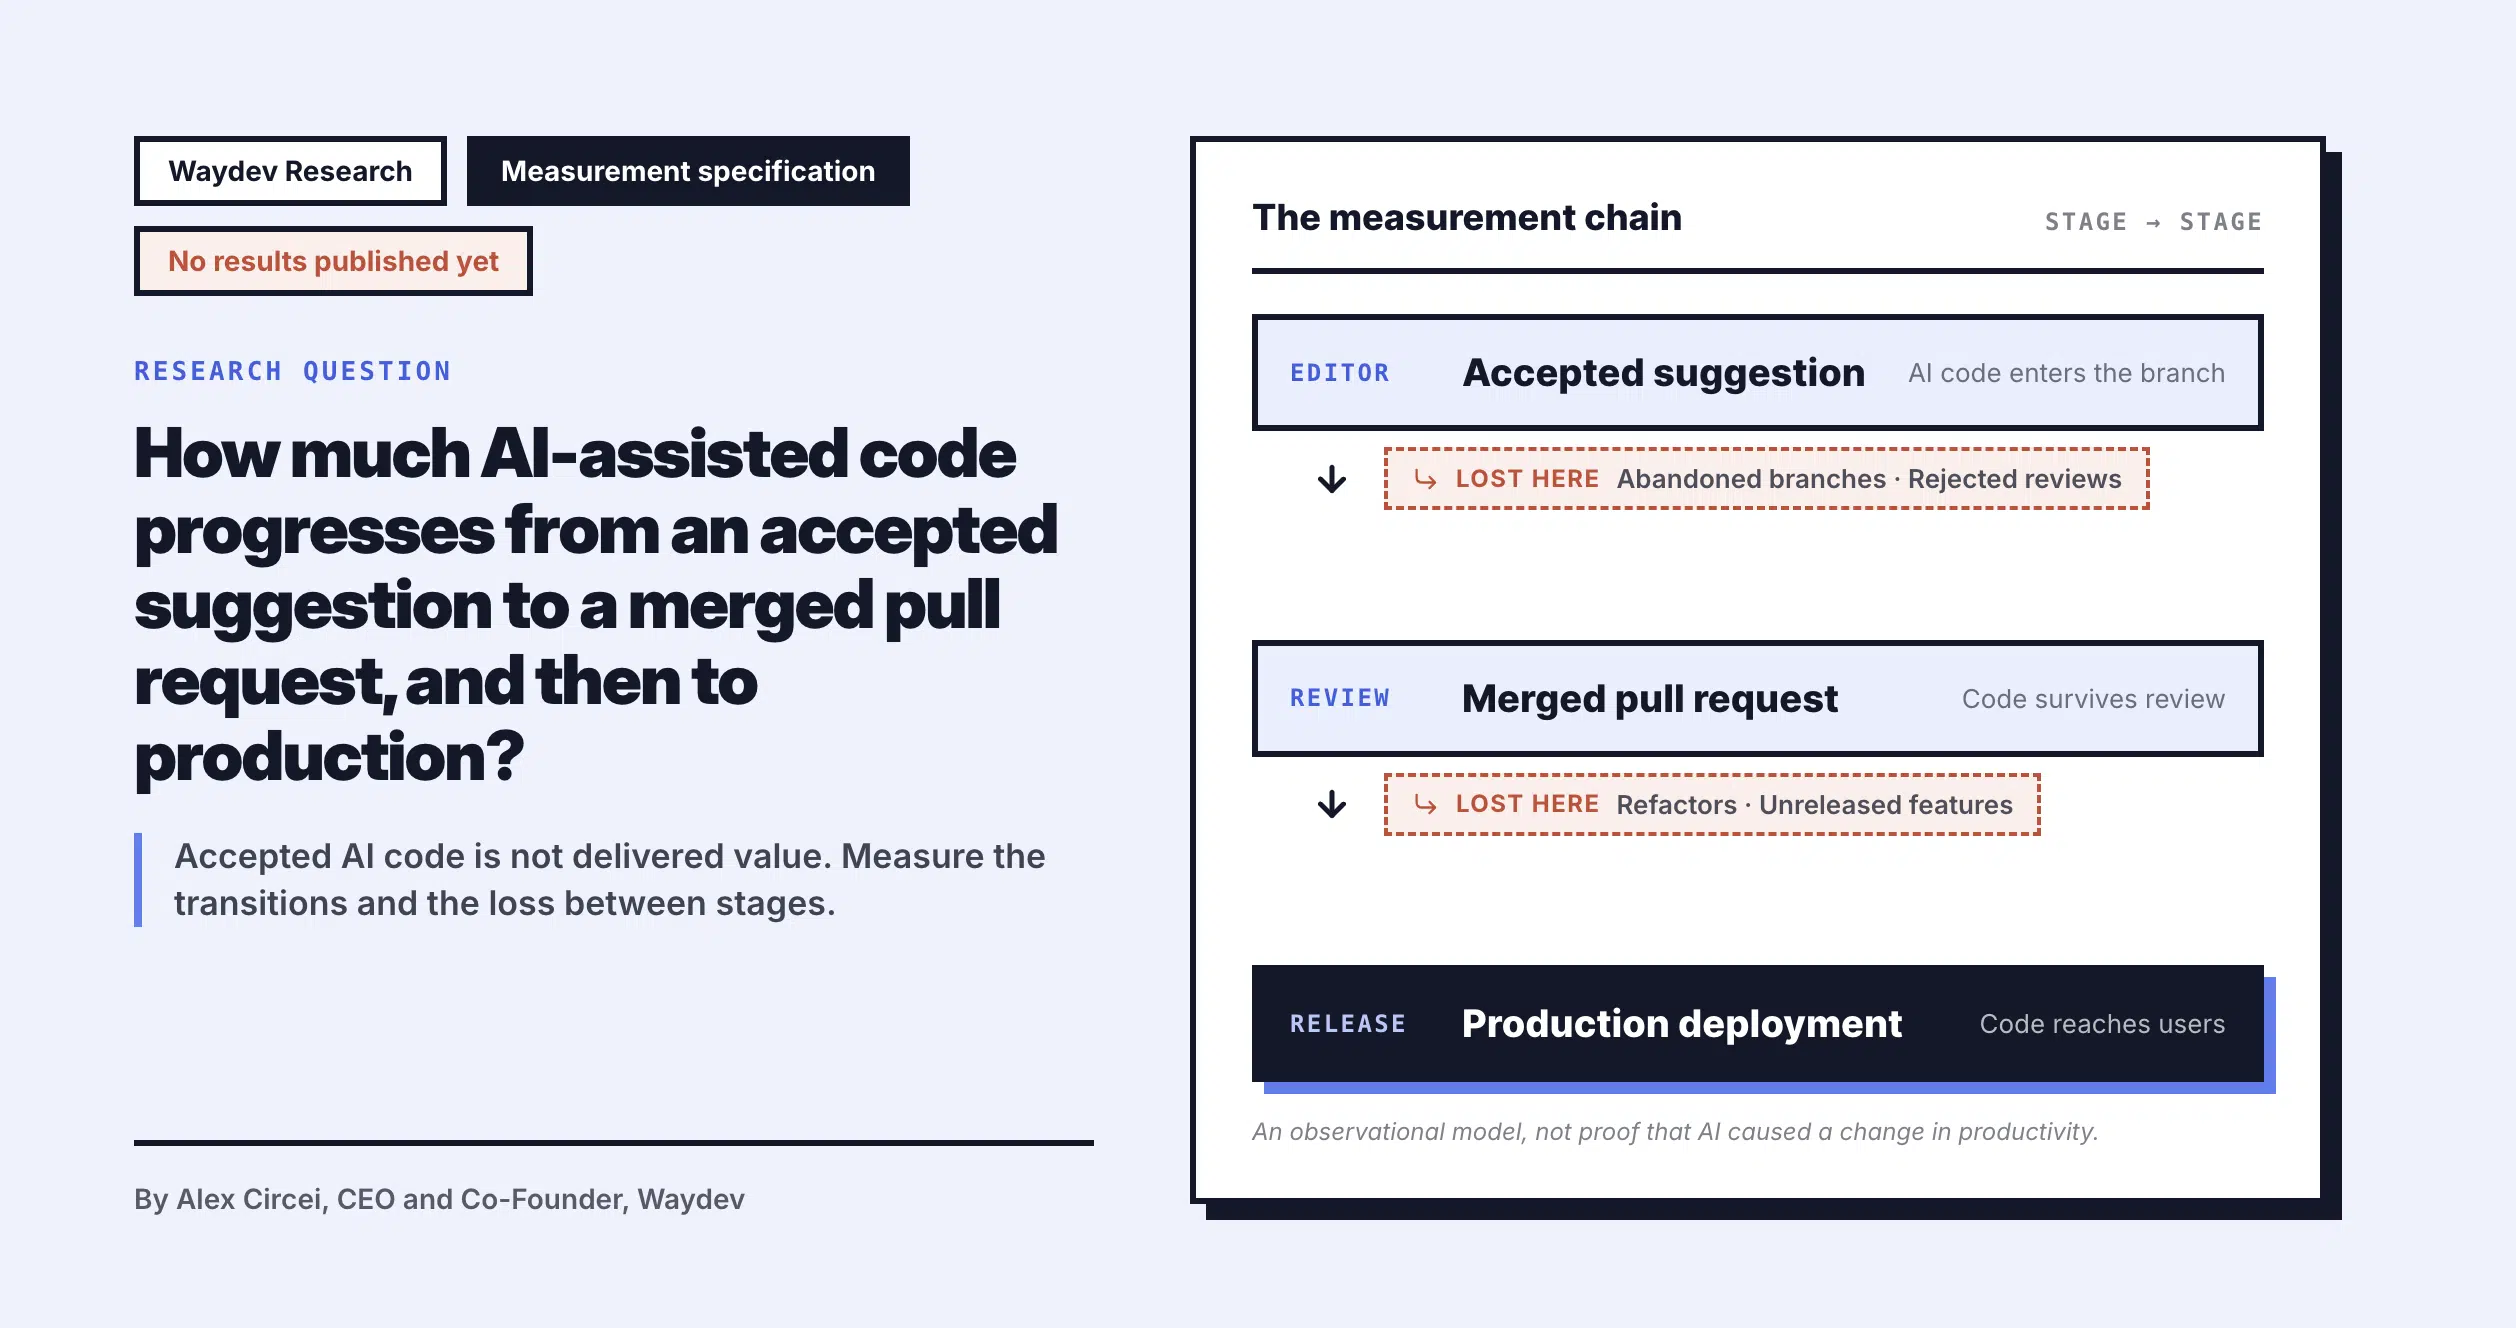
How much AI-assisted code progresses from an accepted suggestion in an editor to a merged pull request and then to a production deployment?
This is an original, reproducible measurement specification from Waydev, not a report of completed empirical results. No benchmark sample or outcome percentages are published here.
The problem
Why accepted AI code is not delivered value
AI suggestion acceptance, pull-request merging and production deployment describe different lifecycle stages. Counting accepted suggestions as productivity gains ignores abandoned branches, rejected reviews, refactors, unreleased features and quality costs. A defensible study measures transitions and loss between stages, then examines delivery quality and cost. The measurement chain is an observational model, not proof that AI caused a change in productivity.
Definitions
Primary outcome and denominator definitions
1Acceptance volumeAI-generated lines accepted in the editor during the observation window, with vendor and tool attribution recorded where available.
2Merge survivalAttributable accepted AI-generated lines observed in merged pull requests divided by eligible accepted lines. Exclude lines with unresolved attribution from both numerator and denominator, and report exclusion rates.
3Production survivalAttributable AI-generated lines included in deployed changes divided by eligible accepted AI-generated lines. Report deployments and merge-only cohorts separately.
4Time to productionElapsed time between the acceptance event and first verified deployment for linked code; report median and distribution, with censoring for lines not yet deployed.
5Review burdenTime to first review, review iterations, requested changes and review cycle time for eligible AI-assisted PRs, compared with carefully matched non-AI PRs.
6Quality guardrailsRework, rollback, change failure and incident rates, only when detection and attribution are sufficiently reliable.
7Cost per verified outcomeEligible AI license, token and inference costs divided by a clearly defined output (for example, eligible merged PRs), with an explicit allocation model. This is not equivalent to causal ROI.
Study design
Proposed observational study design
UNIT OF ANALYSISCode change, pull request, deployment and team-period, with separate estimates for each unit.
STUDY WINDOWPreregister start and end dates before extracting data; allow an additional deployment follow-up period to reduce right-censoring.
ELIGIBILITYOrganizations that explicitly permit aggregated research use, have valid AI telemetry and Git/deployment integrations, and pass data completeness thresholds.
COMPARISONStratify by repository, team, work type, PR size and service maturity. Treat AI adoption as potentially endogenous; avoid causal conclusions without an appropriate design.
MISSING DATAPublish the proportion of unmatched editor events, PRs and deployments; never silently count unmatched lines as rejected or deployed.
PRIVACYAggregate results, suppress small cohorts, and exclude personal, secret or customer-identifying content from published materials.
UNCERTAINTYPublish sample sizes, confidence intervals or suitable uncertainty estimates, sensitivity analyses, and a reproducible metric dictionary.
Hypotheses
Falsifiable hypotheses to test
H1Higher AI suggestion acceptance is not necessarily associated with higher production survival after adjusting for work mix.
H2AI-assisted PRs may differ from comparable non-AI PRs in pickup time, review iterations and rework; the direction and magnitude are unknown.
H3Vendor rankings by acceptance rate may differ from rankings by production survival or cost per verified outcome.
H4AI usage intensity may correlate with throughput while showing no improvement in stability or developer experience.
Publication standard
What would count as a published finding?
Every released estimate must include the number of participating organizations and eligible units, observation dates, numerator and denominator, uncertainty, cohort eligibility, integration coverage and limitations.
This page contains hypotheses and methods only. The publication will be updated with verified aggregate findings after data access approval, extraction, quality review and statistical analysis.
References
Related sources and implementation references
Read the Engineering AI Index 2027, the Waydev AI Coding ROI research protocol, Waydev Code to Production documentation, and AI metrics definitions. The product documentation describes possible instrumentation; it does not establish an empirical research result.