




Engineering Productivity
DORA delivery performance, SPACE dimensions, PR flow, review quality, rework and sustainable engineering output.
A comprehensive framework for understanding engineering productivity, developer experience, software delivery performance and the impact of AI-assisted development.
DORA, SPACE, software delivery flow, quality, review and reliability.
DX, DXI context, developer friction, collaboration and sustainable flow.
AI adoption, code-to-production impact, cost, predictability and ROI.
This is a research-program landing page, not a published benchmark. Waydev will release aggregated findings only after validating data quality, customer permissions, cohort definitions, and sample sizes. No numerical industry findings are claimed here.
Each release will disclose observation period, inclusion criteria, sample size, units of analysis, missing-data handling, baseline selection, cohort composition, statistical uncertainty, and limitations. Results will be aggregated and anonymized; no customer-identifiable records or source code will be published. Correlation will not be presented as causation.
Read our AI coding ROI data dictionary and methods and research protocol. Explore the WAY Framework.
The Engineering AI Index will analyze software delivery and AI impact through multiple complementary lenses. DORA, SPACE, DevEx/DX and DXI are distinct approaches, not interchangeable measures. The index will distinguish established third-party frameworks from Waydev’s own analysis and avoid claiming that any one metric proves individual productivity.
Track deployment frequency, change lead time, change failure rate, failed deployment recovery time, and deployment rework rate where supported by the current DORA framework. Report definitions, service boundaries, observation windows, and data coverage. Examine speed and stability together rather than rewarding deployment volume alone.
Use multiple dimensions, combining surveys with operational data. Do not use commits, lines of code or PR counts as individual productivity rankings. Reference: original SPACE research and Waydev SPACE guide.
Study developer feedback and engineering-system friction: build and test reliability, tool usability, onboarding, documentation discoverability, cognitive load, feedback loops, interruptions, and perceived ability to deliver quality work. Compare survey trends with observed workflow data without assuming they measure the same thing.
DXI is a specific developer-experience index associated with DX’s measurement approach, not a generic synonym for all DX surveys. Where data and licensing permit, discuss DXI results separately from Waydev survey measures; do not label a Waydev-derived composite score as DXI. Reference: DX Core 4 benchmarks.
Connect delivery and developer experience to engineering investment, resource allocation, predictability, reliability, technical debt, work-in-progress, planning accuracy, customer value, and cost. Separate descriptive metrics from forecasts and causal claims. Segment comparisons by organization size, team type, service maturity and work mix when data supports it.
Analyze AI tool adoption, accepted suggestions, AI-assisted versus autonomous changes, review load, code survival or rework, time-to-merge, quality guardrails, token and license spend, and cost per verified delivery outcome. Distinguish AI usage from incremental impact and ROI; compare cohorts only with appropriate baselines and disclosed confounders.
For every published metric provide a plain-language definition, numerator and denominator, unit, data source, collection interval, exclusions, aggregation level, confidence or uncertainty where applicable, and known failure modes. Label findings as observed associations unless a suitable causal design supports stronger conclusions. Explain when a framework’s definitions change across versions.
Further reading: Waydev DORA vs SPACE vs DX framework guide and AI Coding ROI data dictionary and methods.
The sections below describe documented Waydev reporting capabilities that can support future Engineering AI Index research. They are not claims that a representative dataset has already been analyzed. Availability depends on connected integrations, configuration, permissions, and data coverage. Product definitions must be recorded with the version used for each research release.
Candidate measures include AI Adoption Rate (active users relative to the relevant roster), daily/weekly/monthly active users, AI Stickiness (DAU/MAU), AI Active Days per User, and the Power-User Ratio (users active at least 16 days in a rolling 28-day window among adopters). Where the report uses licenses rather than the full roster as denominator, disclose that distinction. Break down adoption by vendor, team and period, subject to privacy thresholds. AI Metrics documentation and AI Adoption documentation.
Documented candidate metrics include suggestion acceptance rate, AI churn rate, AI cache hit ratio, token efficiency, AI PR throughput, AI code-to-merge survival, lines per AI session, AI cost per active user, cost per merged PR, and cost per 1,000 tokens. These are operational proxies and cost ratios, not by themselves causal ROI or code quality proofs. For cost per merged PR, report the exact eligible PR population and allocation of vendor spend. AI Metrics definitions.
Waydev’s Code to Production report traces AI-generated lines through Accepted in IDE, Merged via pull requests, and Deployed to production. It reports acceptance rate, merge rate and generated lines, with team, group and date filters. The index can study conversion between these stages, while documenting attribution limitations and avoiding the assumption that every accepted line produces lasting customer value. Code to Production documentation.
Waydev’s AI Compare report shows vendor adoption, provisioned and active users, period-over-period comparisons, suggestion acceptance, AI-assisted code share, model usage and programming-language usage. The index should compare tools only when definitions, eligibility and integration coverage are equivalent; vendor comparisons are observational rather than randomized performance tests. AI Compare documentation.
Waydev’s DORA Overview reports Lead Time for Changes, Deployment Frequency, Change Failure Rate and Mean Time to Restore, with trends and filters. The underlying Pull Requests, Releases and Incidents tables allow researchers to inspect the records behind each result. Release and incident detection configuration is necessary for reliable interpretation. DORA’s wider research literature may define additional measures, but this product report explicitly documents four. DORA report and DORA setup and definitions.
Candidate analysis areas include PR cycle time and review patterns, team delivery and collaboration, sprint commitment, merge quality, engineering health, work-in-progress, and engineering effort allocation. The Resource Allocation report presents FTE by issue category and categories derived from issue types, labels or epics. These are complementary signals: work allocation is not proof of business value, and contributor-level metrics should not be used as individual performance rankings. Reports overview and Product FAQ and resource allocation.
Waydev dashboards can combine DORA, AI and PR metrics using cards, tables, charts, heatmaps and time-based composites. Ask Waydev can answer natural-language questions, create dashboard widgets, and expose editable SQL behind generated chart responses. Waydev MCP exposes engineering data categories to compatible AI clients. Research publications should still record exact queries, filters, source data versions and manual validation; an AI-generated explanation alone is not reproducible evidence. Dashboards, Ask Waydev and SQL editor, and Waydev MCP.
For each analysis, report cohort eligibility, denominators, sample size, timeframe, integration coverage, anonymization thresholds and confounding factors. Do not publish results until these checks are complete.
A research framework connecting developer experience, engineering productivity, software delivery reliability, and the real-world impact and economics of AI-assisted development.
Research program · Industry benchmarks not yet publishedDORA delivery performance, SPACE dimensions, PR flow, review quality, rework and sustainable engineering output.
DX and DXI context, developer feedback, cognitive load, tool friction, collaboration and conditions for deep work.
AI adoption, accepted-to-merged-to-deployed code, agent effectiveness, reliability guardrails, token spend and ROI.
The Engineering AI Index 2027 is a proposed evidence-based research program for measuring software engineering productivity, developer experience, delivery reliability, AI coding adoption, and engineering investment outcomes. It brings together DORA, SPACE, DevEx/DX, DXI context, engineering intelligence, and AI-assisted delivery in one measurement architecture. This draft explains what to measure, how to interpret it, and which data sources can support it. It does not present unpublished benchmark findings.
| Approach | Primary question | Example evidence | Important limitation |
|---|---|---|---|
| DORA | How effectively and reliably do we deliver changes? | Lead time, deployment frequency, change failure, recovery | Does not directly measure satisfaction, business value or AI ROI |
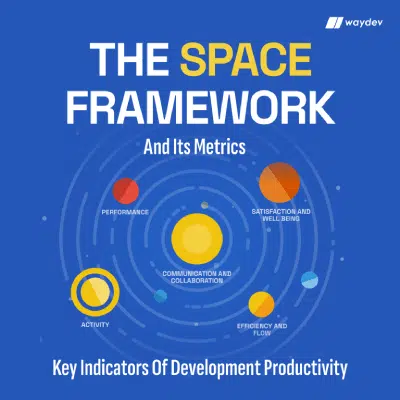
| SPACE | How do multiple dimensions of developer productivity interact? | Satisfaction, performance, activity, collaboration, efficiency and flow | No single metric or universal composite score represents SPACE |
| DX / DevEx | What helps or hinders developers doing their work? | Surveys, cognitive load, feedback loops, tool friction, flow | Survey design and representativeness matter |
| DXI | What does a specific Developer Experience Index measure? | Measures defined by the DX methodology | Do not conflate proprietary DXI with unrelated surveys |
| Engineering intelligence | How do engineering operations connect to decisions and outcomes? | Delivery, capacity, quality, cost, predictability and investments | Attribution and business-value measurement require context |
| AI engineering intelligence | Does AI improve delivered outcomes at an acceptable cost? | Adoption, code lifecycle, rework, reliability, tokens and spend | Adoption and correlation alone do not establish causal ROI |
The definitions below are working research definitions. When reporting a product-specific metric, use the versioned definition in Waydev documentation and record any differences from academic or third-party frameworks.
| Metric | Interpretation / calculation | Research caveat |
|---|---|---|
| AI Adoption Rate | Active AI tool users / eligible full user roster for the period | Specify eligibility and connected vendors |
| AI Stickiness | Average DAU / MAU over the documented trailing window | Define user identity and window |
| Power-User Ratio | Adopters active on at least 16 of 28 days / all adopters | Threshold is product-specific, not universal |
| Suggestion Acceptance Rate | Accepted AI suggestions / suggestions shown or eligible | Acceptance does not establish quality |
| AI Churn Rate | Later-removed AI-written lines / AI-written lines | Deletion can be healthy refactoring |
| AI Cost per Active User | Total eligible AI spend / active AI users | Specify spend allocation and currency |
| AI Cost per Merged PR | Eligible AI spend / merged PRs containing AI users’ commits | Not equivalent to incremental cost per AI-authored PR |
| Deployment Frequency | Successful production deployments per service and time interval | Deployment detection must be configured |
| Change Failure Rate | Deployments requiring remediation / eligible deployments | Incident linkage and definitions vary |
| PR Review Latency | Elapsed time from PR creation to first substantive review | Weekends, time zones and work mix affect comparisons |
| Engineering allocation | Estimated FTE effort by work category | Classification accuracy is not business-value proof |
Sources: Waydev AI Metrics, Waydev DORA, and Waydev metric definitions.
A credible AI productivity analysis begins with an explicit hypothesis, such as whether greater AI adoption is associated with shorter PR lead times without higher change failure rates. It then defines eligible repositories, teams, services, observation periods and outcomes before looking at results. Useful designs include within-team before/after comparisons, matched cohorts, staggered adoption analyses and controlled pilots. Each has limitations: seasonality, hiring, changes in task complexity, incident exposure, organizational restructuring and tooling changes can influence results.
These are example analytical questions, not claims that the answers have been computed.
Waydev supports custom dashboards with AI, DORA and PR metrics, team and repository filters, and AI-assisted dashboard creation. Ask Waydev can generate analyses and expose editable SQL for chart responses. These features can help analysts explore questions; published research still requires a separately reviewed and reproducible methodology. Dashboard documentation · Ask Waydev documentation.
It is Waydev’s proposed research framework for understanding engineering productivity, developer experience, delivery performance, AI adoption and AI economics together. The current page documents the methodology and intended measurements; verified cross-company benchmark results have not yet been released.
DORA focuses on software delivery throughput and stability. SPACE describes developer productivity across satisfaction, performance, activity, communication/collaboration, and efficiency/flow. They complement each other rather than providing competing scores.
DX or developer experience is the broader concept of how developers experience their tools, processes and work environment. DXI refers to a particular Developer Experience Index methodology. A generic developer survey is not automatically a DXI measurement.
No. AI usage and accepted suggestions show engagement, not necessarily faster, safer or more valuable delivery. Assess downstream outcomes, review burden, rework, quality and costs against appropriate baselines.
Commits and code volume can describe activity and change patterns, but they cannot reliably represent individual effectiveness or customer value in isolation. Combine workflow signals with quality, collaboration, outcomes and developer feedback.
Define incremental benefits and total attributable costs, including licenses, token usage and any relevant review or infrastructure costs. Compare outcomes with a defensible baseline and disclose uncertainty. A lower cost per merged PR alone is not a complete ROI calculation.
Waydev’s documented reports draw from configured engineering integrations and cover AI usage, PRs, delivery, incidents, tickets, teams and other available sources. Exact coverage depends on enabled integrations, detection rules and permissions. See the start guide and configuration documentation.
Not yet. This draft establishes scope, definitions and evidence requirements. Sample sizes, cohort results, statistical estimates and downloadable data must be verified before any benchmark is published.
Source hierarchy: (1) versioned Waydev product documentation for feature and metric definitions; (2) original DORA and SPACE research for framework interpretation; (3) identified DX/DXI primary methodology for those terms; (4) independently reviewed, aggregated Waydev research datasets for empirical findings. Product capabilities and research results must never be presented as the same type of evidence. Review all documentation links, definitions and claims before publication, and record the research release date and revision history.
Waydev’s synthesis framework
The WAY Framework is Waydev’s approach to bringing established software engineering research together rather than replacing it with another proprietary productivity score. It draws on DORA, SPACE, developer experience, DX’s Core 4 and AI measurement approaches to connect delivery performance, developer experience, engineering investment and AI outcomes.
Use DORA and workflow signals to understand speed, stability, review queues and rework.
Combine SPACE dimensions and developer feedback with operational data; avoid individual productivity rankings.
Relate AI adoption and code lifecycle to quality, cost, predictability and resource allocation.
In the Engineering AI Index, WAY is the organizing lens, not an independently validated industry benchmark. Each published analysis must retain its source framework’s definitions, disclose data limitations and distinguish observation from causal impact.
Explore the complete WAY Framework →WAY provides the editorial structure for examining delivery reliability (DORA), multidimensional productivity (SPACE), developer experience (DX and relevant DXI context), and AI engineering economics together. The index should report these as complementary measurements, not collapse them into one unvalidated universal score. Its role is to help leaders interpret relationships between delivery outcomes, engineering conditions, investment decisions and AI-assisted work.
For the full research history, third-party framework comparisons and Waydev’s position on vendor-neutral measurement, read The WAY Framework. For implementation details, consult the DORA documentation, AI Metrics documentation and Dashboards documentation.
Dataset: not yet released. Benchmark statistics: pending verification. Downloadable data tables: pending review. Read our AI Code Production Survival measurement specification for a reproducible proposed study of AI-assisted code from editor acceptance to production. The methodology is published; empirical benchmark results will be released only after validation, privacy review, and verification of the underlying datasets.